Python正態分布
正態分布是通過排列資料中每個值的概率分布來呈現資料的形式。大多數值保持在平均值附近,使得排列對稱。
可使用numpy庫中各種函式來數學計算正態分布的值。 通過繪製概率分布曲線來建立直方圖。
import matplotlib.pyplot as plt
import numpy as np
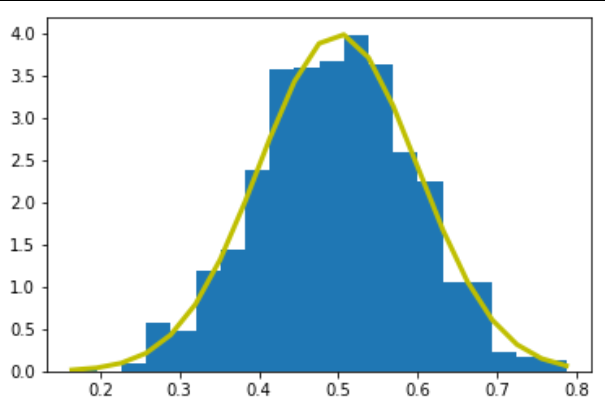
mu, sigma = 0.5, 0.1
s = np.random.normal(mu, sigma, 1000)
# Create the bins and histogram
count, bins, ignored = plt.hist(s, 20, normed=True)
# Plot the distribution curve
plt.plot(bins, 1/(sigma * np.sqrt(2 * np.pi)) *
np.exp( - (bins - mu)**2 / (2 * sigma**2) ), linewidth=3, color='y')
plt.show()
執行上面範例程式碼,得到以下結果 -