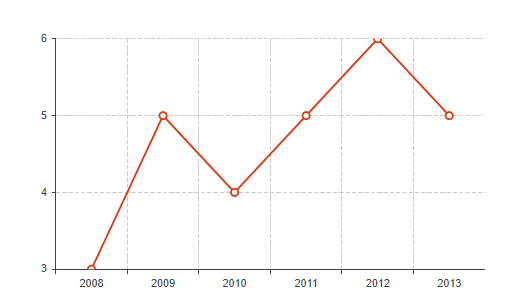
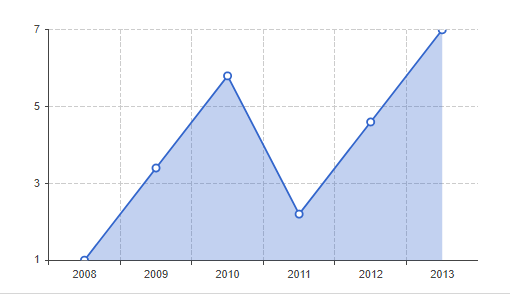
SVG圖形
可以使用SVG製作圖表,SVG圖範例如下所示。

參考以下程式碼 -
<!DOCTYPE html>
<html>
<head>
    <meta charset="utf-8">

    <style type="text/css">

        #div1{
            width: 588px;
            height: 396px;
            margin: 19px -21px 0;
        }
    </style>
</head>
<body>
<div id="div1"></div>
</body>
<script type="text/javascript">
    window.onload = function(){
        var oDiv = document.getElementById("div1");
        var svgNs = "http://www.w3.org/2000/svg";
        var center = {
            X:oDiv.offsetWidth/2,
            Y:oDiv.offsetHeight/2
        }
        var circleNum = 9;
        var angle = 360/circleNum;
        var centerR = 150;
        var data = {
            centerNode:{text:"TP"},
            otherNode:[{text:"html"},{text:"css"},{text:"javascript"},{text:"html5"},{text:"css3"},{text:"jqeury"},{text:"ajax"},{text:"json"},{text:"Android"}]
        };
        for(var i=0;i<circleNum;i++){
            data["otherNode"][i].x = center.X + centerR*Math.cos(i*angle*Math.PI/180);
            data["otherNode"][i].y = center.Y + centerR*Math.sin(i*angle*Math.PI/180);
        }


        function creatSvgTage(tage,json){
            var oTage = document.createElementNS(svgNs,tage);
            for(var attr in json){
                oTage.setAttribute(attr,json[attr]);
            }
            return oTage;
        }


        function addTage(){
            var oSvg = creatSvgTage("svg",{xmlns:"http://www.w3.org/2000/svg", width:"100%", height:"100%"});

            for(var i=0;i<data["otherNode"].length;i++){
                addOtherTage(oSvg,data["otherNode"][i]);
            }
            var oG = creatSvgTage("g",{style:"cursor:pointer"});
            var oCircle = creatSvgTage("circle",{cx:center.X,cy:center.Y,r:40,fill:"lemonchiffon",stroke:"black","stroke-width":"1"});
            var oText =  creatSvgTage("text",{x:center.X,y:center.Y+8,"font-size":"20",'text-anchor':'middle'});
            oG.appendChild(oCircle);
            oG.appendChild(oText);
            oText.innerHTML = data["centerNode"].text;
            oSvg.appendChild(oG);
            oDiv.appendChild(oSvg);
        }
        addTage();


        function addOtherTage(oParent,json){
            var oG = creatSvgTage("g",{style:"cursor:pointer",class:"Line"});
            var oLine1 = creatSvgTage("line",{x1:json.x,y1:json.y,x2:center.X,y2:center.Y,stroke:"black"});
            var oLine2 = creatSvgTage("line",{x1:json.x,y1:json.y,x2:center.X,y2:center.Y,stroke:"transparent","stroke-width":"10"});
            var oRect = creatSvgTage('rect',{'x': (json.x + center.X)/2 - 10 ,'y': (json.y + center.Y)/2 - 10 ,'fill':'#999','width':'20','height':'20','rx':'5'});
            var oText = creatSvgTage("text",{x:(json.x+center.X)/2,y:(json.y+center.Y)/2+8,"font-size":"20",stroke:"white",'text-anchor':'middle'});
            oG.appendChild(oLine1);
            oG.appendChild(oLine2);
            oG.appendChild(oRect);
            oG.appendChild(oText);
            oText.innerHTML = "?";
            oParent.appendChild(oG);

            var oG = creatSvgTage("g",{style:"cursor:pointer",class:"circle"});
            var oCircle = creatSvgTage("circle",{cx:json.x,cy:json.y,r:30,fill:"bisque",stroke:"#eb6100","stroke-width":"1"});
            var oText =  creatSvgTage("text",{x:json.x,y:json.y+5,"font-size":"14",fill:"#999",'text-anchor':'middle'});
            oG.appendChild(oCircle);
            oG.appendChild(oText);
            oText.innerHTML = json.text;
            oParent.appendChild(oG);
        }
        effect();
        function effect(){
            var doc = document;
            var oLineObj = doc.getElementsByClassName("Line");
            var oCircleObj = doc.getElementsByClassName("circle");
            for(var i=0;i<oCircleObj.length;i++){
                oCircleObj[i].onmouseenter = function(){
                    startMove(this.getElementsByTagName("circle")[0],30,40);
                    var prev = this.previousElementSibling;
                    prev.getElementsByTagName("line")[0].setAttribute("stroke","red");
                    prev.getElementsByTagName("rect")[0].setAttribute("fill","blue");
                }
                oCircleObj[i].onmouseleave = function(){
                    startMove(this.getElementsByTagName("circle")[0],40,30);
                    var prev = this.previousElementSibling;
                    prev.getElementsByTagName("line")[0].setAttribute("stroke","black");
                    prev.getElementsByTagName("rect")[0].setAttribute("fill","#999");
                }
            }
            for(var j=0;j<oLineObj.length;j++){
                oLineObj[j].onmouseenter = function(){
                    this.getElementsByTagName("line")[0].setAttribute("stroke","red");
                    this.getElementsByTagName("rect")[0].setAttribute("fill","blue");
                    var next = this.nextElementSibling;
                    startMove(next.getElementsByTagName("circle")[0],30,40);
                }
                oLineObj[j].onmouseleave = function(){
                    this.getElementsByTagName("line")[0].setAttribute("stroke","black");
                    this.getElementsByTagName("rect")[0].setAttribute("fill","#999");
                    var next = this.nextElementSibling;
                    startMove(next.getElementsByTagName("circle")[0],30,40);
                }
            }
        }

        function startMove(obj,r1,r2){
            var nowR = r1;
            var targetR = r2;
            this.speed = 0;
            clearInterval(obj.timer);
            obj.timer = setInterval(function(){
                this.speed += (targetR - nowR)/6;
                this.speed *= 0.9;
                if(Math.abs(targetR - nowR)<=1 && Math.abs(this.speed)<=1){
                    clearInterval(obj.timer);
                    obj.setAttribute("r",targetR);
                }else{
                    nowR += this.speed;
                    obj.setAttribute("r",nowR);
                }
            },30);
        }
    }
</script>
</html>
齊諾圖

齊諾曲面圖

全部程式碼下載:/upload/graph.zip