JFreeChart氣泡圖表
本章演示如何使用JFreeChart從一個給定的業務資料建立氣泡圖表。使用氣泡圖顯示在三維方式的資訊。氣泡繪製在其中(x,y)坐標相交的地方。氣泡的大小被認為是範圍或X和Y軸的數量。
業務資料
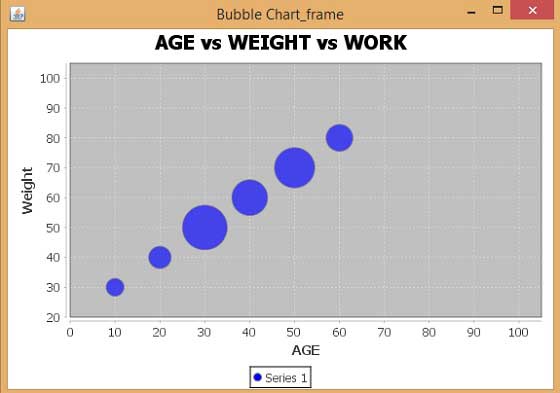
考慮不同的人的年齡,體重和工作能力可能不太相同。能力可以視為對該被繪製為圖表中的氣泡的小時數。
|
|
||||||||
|---|---|---|---|---|---|---|---|---|
| AGE | 30 | 40 | 50 | 60 | 70 | 80 | ||
| 10 | 4 | WORK | ||||||
| 20 | 5 | |||||||
| 30 | 10 | |||||||
| 40 | 8 | |||||||
| 50 | 9 | |||||||
| 60 | 6 | |||||||
基於AWT的應用
以下是對從上述給定的資訊建立氣泡圖表的程式碼。此程式碼可以幫助嵌入一個氣泡圖在AWT應用程式。
import java.awt.Color;
import java.awt.Dimension;
import javax.swing.JPanel;
import org.jfree.chart.*;
import org.jfree.chart.axis.NumberAxis;
import org.jfree.chart.plot.PlotOrientation;
import org.jfree.chart.plot.XYPlot;
import org.jfree.chart.renderer.xy.XYItemRenderer;
import org.jfree.data.xy.DefaultXYZDataset;
import org.jfree.data.xy.XYZDataset;
import org.jfree.ui.ApplicationFrame;
import org.jfree.ui.RefineryUtilities;

public class BubbleChart_AWT extends ApplicationFrame
{
   public BubbleChart_AWT( String s )
   {
      super( s );
      JPanel jpanel = createDemoPanel( );
      jpanel.setPreferredSize(new Dimension( 560 , 370 ) );
      setContentPane( jpanel );
   }

   private static JFreeChart createChart( XYZDataset xyzdataset )
   {
      JFreeChart jfreechart = ChartFactory.createBubbleChart(
         "AGE vs WEIGHT vs WORK",
         "Weight",
         "AGE",
         xyzdataset,
         PlotOrientation.HORIZONTAL,
         true, true, false);

      XYPlot xyplot = ( XYPlot )jfreechart.getPlot( );
      xyplot.setForegroundAlpha( 0.65F );
      XYItemRenderer xyitemrenderer = xyplot.getRenderer( );
      xyitemrenderer.setSeriesPaint( 0 , Color.blue );
      NumberAxis numberaxis = ( NumberAxis )xyplot.getDomainAxis( );
      numberaxis.setLowerMargin( 0.2 );
      numberaxis.setUpperMargin( 0.5 );
      NumberAxis numberaxis1 = ( NumberAxis )xyplot.getRangeAxis( );
      numberaxis1.setLowerMargin( 0.8 );
      numberaxis1.setUpperMargin( 0.9 );

      return jfreechart;
   }

   public static XYZDataset createDataset( )
   {
      DefaultXYZDataset defaultxyzdataset = new DefaultXYZDataset();

      double ad[ ] = { 30 , 40 , 50 , 60 , 70 , 80 };
      double ad1[ ] = { 10 , 20 , 30 , 40 , 50 , 60 };
      double ad2[ ] = { 4 , 5 , 10 , 8 , 9 , 6 };
      double ad3[][] = { ad , ad1 , ad2 };
      defaultxyzdataset.addSeries( "Series 1" , ad3 );

      return defaultxyzdataset;
   }

   public static JPanel createDemoPanel( )
   {
      JFreeChart jfreechart = createChart( createDataset( ) );
      ChartPanel chartpanel = new ChartPanel( jfreechart );

      chartpanel.setDomainZoomable( true );
      chartpanel.setRangeZoomable( true );

      return chartpanel;
   }

   public static void main( String args[ ] )
   {
      BubbleChart_AWT bubblechart = new BubbleChart_AWT( "Bubble Chart_frame" );

      bubblechart.pack( );
      RefineryUtilities.centerFrameOnScreen( bubblechart );
      bubblechart.setVisible( true );
   }
}
讓我們儲存上面的Java程式碼在BubbleChart_AWT.java檔案,然後從命令提示字元下編譯並執行它,如下所示:
$javac BubbleChart_AWT.java
$java BubbleChart_AW
如果一切順利,它會編譯並執行生成以下氣泡圖:
建立JPEG影象
讓我們重新編寫上面的例子,在命令列生成JPEG影象。
import java.io.*;
import java.awt.Color;
import org.jfree.chart.*;
import org.jfree.chart.axis.NumberAxis;
import org.jfree.chart.plot.PlotOrientation;
import org.jfree.chart.plot.XYPlot;
import org.jfree.chart.renderer.xy.XYItemRenderer;
import org.jfree.data.xy.DefaultXYZDataset;
import org.jfree.chart.ChartUtilities;

public class BubbleChart_image
{
   public static void main( String args[ ] )throws Exception
   {
      DefaultXYZDataset defaultxyzdataset = new DefaultXYZDataset( );
      double ad[ ] = { 30 , 40 , 50 , 60 , 70 , 80 };
      double ad1[ ] = { 10 , 20 , 30 , 40 , 50 , 60 };
      double ad2[ ] = { 4 , 5 , 10 , 8 , 9 , 6 };
      double ad3[ ][ ] = { ad , ad1 , ad2 };
      defaultxyzdataset.addSeries( "Series 1" , ad3 );

      JFreeChart jfreechart = ChartFactory.createBubbleChart(
         "AGE vs WEIGHT vs WORK",
         "Weight",
         "AGE",
         defaultxyzdataset,
         PlotOrientation.HORIZONTAL,
         true, true, false);

      XYPlot xyplot = ( XYPlot )jfreechart.getPlot( );
      xyplot.setForegroundAlpha( 0.65F );
      XYItemRenderer xyitemrenderer = xyplot.getRenderer( );
      xyitemrenderer.setSeriesPaint( 0 , Color.blue );
      NumberAxis numberaxis = ( NumberAxis )xyplot.getDomainAxis( );
      numberaxis.setLowerMargin( 0.2 );
      numberaxis.setUpperMargin( 0.5 );
      NumberAxis numberaxis1 = ( NumberAxis )xyplot.getRangeAxis( );
      numberaxis1.setLowerMargin( 0.8 );
      numberaxis1.setUpperMargin( 0.9 );

      int width = 560; /* Width of the image */
      int height = 370; /* Height of the image */
      File bubbleChart = new File("BubbleChart.jpeg");
      ChartUtilities.saveChartAsJPEG(bubbleChart,jfreechart,width,height);
   }
}
讓我們儲存上面的Java程式碼在BubbleChart_image.java檔案,然後從命令提示字元下編譯並執行它,如下所示:
$javac BubbleChart_image.java
$java BubbleChart_image
如果一切順利,它會編譯並執行在當前的目錄中建立的JPEG影象檔案namedBubbleChart.jpeg。