R語言入門——從數據匯入、數據清洗到數據分析
基本操作(包括讀取數據)
設定工作目錄
setwd(‘D://R/’)
讀取數據檔案
listing<-read.csv(‘listings.csv’,header = T,sep = ‘,’,quote = ‘’)
listings<-na.omit(listing) # 去除所有含缺失值的行
連線mysql數據庫
方法一:RMYSQL包----中文會出現亂碼
library(RMySQL)
con<- dbConnect(MySQL(),username = ‘root’,password=‘123’,host=「192.168.1.105」,port=3306,dbname = ‘ex’) # 建立連線
dbSendQuery(con, ‘SET NAMES gbk’) # 設定數據庫讀取編碼格式,避免造成中文數據出現亂碼的情況
dbGetInfo(con) # 查詢連線資訊
dbListTables(con) # 查詢數據庫的表
data<-dbReadTable(con,「test_taobao」) # 讀整個表
data<-na.omit(data)
datayy)
summary(data)
rs <- dbGetQuery(con,‘select * from test_taobao’) # 用SQL語句提取數據
dbDisconnect(con) # 關閉連線
****忽略此內容
方法二:RODBC包建立連線----與數據庫連線限制較多,但中文不會出亂碼
需要先下載安裝ODBC,建立與本機與數據庫的連線後,通過建立的連線來進行數據讀取
ODBC下載地址:https://dev.mysql.com/downloads/connector/odbc/
安裝完成後,再電腦控制面板—管理工具–ODBC數據源(64位元)——單擊「新增」。選擇mysql odbc 5.3 ansi driver
填寫需要連線的數據庫地址,埠號,選擇數據庫名
library(RODBC)
conn<-odbcConnect(‘sunhao’,uid = ‘root’,pwd = ‘123456’)
sqlTables(conn)
result<-sqlQuery(conn,‘select * from sunhao’)
result
**忽略結束
第一章 R的數據型別和數據型別的操作
數值(numberic)、字串(character)、邏輯值(logical)、複數(complex)、缺失值(NA)
1 # 數值
‘sunhao’ # 字串
TRUE # 邏輯型真
FALSE # 邏輯型假
T # 邏輯型真
F # 邏輯型假
1+2i # 複數
is.numeric(listings$price)
is.vector(listings$price)
| 數據型別 | 中文含義 | 判斷函數 | 轉換函數 |
|---|---|---|---|
| character | 字串 | is.character() | as.character() |
| numeric | 數值 | is.numeric() | as.numeric() |
| logical | 邏輯 | is.logical() | as.logical() |
| complex | 複數 | is.complex() | as.complex() |
| NA | 缺失 | is.na() | as.na() |
向量(vector)、列表(list)、因子(Factor)
向量(向量內部的數據必須是同一種數據型別)
c(1,2,3,4,5,6)    # 向量
c(1:10)           # 向量,取1-10
a <- c('sunhao','haosun','haozi')
a[2] #向量取值
is.vector(a) #判斷是否向量

列表(列表內部存的數據型別可以不是同一種數據型別
list_a <- list(student=c('sunhao','pingxinchuan'),score = c(21,31))
list_a
is.vector(list_a)
b <- as.list(a) # 將向量轉換爲列表
is.list(b)      # 判斷是否列表

因子(將向量轉化爲因子型,用於後面列聯表分析及分組型變數的分析)
sex <- c('M','F','M','M','F')
is.factor(sex)
sex_factor <- as.factor(sex)
levels(sex_factor)
levels(sex)   # 輸出NULL,因爲sex不是因子型數據型別
矩陣(matrix)、陣列(Array)、數據框(Data frame)----陣列和矩陣的運算涉及到線性代數的知識,暫時不講
矩陣
matrix_a <- matrix(c(1:10),nrow = 2)
matrix_a
matrix_b <- matrix(c(1:10),nrow = 2,byrow=T)
matrix_b

陣列(Array)三維
array1 <- array(1:18,c(3,3,2))
array1
dim1<-c('A1','A2','A3')
dim2<-c('B1','B2','B3')
dim3<-c('C1','C2')
array2 <- array(1:18,c(3,3,2),dimnames = list(dim1,dim2,dim3))
array2
array3 <- array(1:6,c(2,3))
array3


數據框(Data frame)
names <- c('A','B','C','D','E')
english <- c(60,62,80,90,95)
math <- c(80,88,90,65,70)
scores <- data.frame(names,english,math)  # 數據框每一列的數量必須相同
scores
scores$names   # 取數據框的names變數的值
scores[[1]]    # 取數據框第一列的值
第二章 數據清洗
數據選擇(數據框行列的選擇、篩選、列操作)
b <- listings[1000,] # 中括號中用,分開,左邊是行,右邊選列,行列都可以寫向量c(1,2,3)傳給行,就是取第1,2,3行,傳給列則是第一到三個變數(欄位)
b <- listings[,c('price','room_type')] # 取listings表的price和room_type變數
b <- listings[c(100,200,300,400),]     # 按向量提取數據,提取第100/200/300/400行的數據
b <- listings[c(100,200,300,400),c('price','room_type')] # 按向量提取數據,提取第100/200/300/400行的price和room_type數據

c <- listings[which(listings$room_type == 'Private room'),]  #  按條件篩選,which返回的是行號
c <- listings[which(listings$room_type == 'Private room' |listings$room_type == 'Entire home/apt'),]  #  按條件篩選,連線兩個同時成立的條件用&,兩個或關係用|

d <- listings$price^2/1000   # 由於單獨取某一列及爲向量,向量中如果是數值的話,可以直接做加減乘除等一般的數位計算
library(tidyr)   # tidyr包,合併兩列數據,不論是字串還是數值,
new_lisitngs = unite(listings, "newtype2", room_type, neighbourhood, sep = "/", remove = FALSE)   # 將room_type和neighbourhood變數合併,合併中間加/符號,remove傳邏輯值,TURE代表合併後刪除原變數,FALSE表示合併後保留原變數
數據分組、分割、合併和變形
tapply(listings$price,list(listings$neighbourhood,listings$room_type),FUN = mean) # 分組彙總,求各地區各種房型價格的均值,FUN傳遞需要計算的參數函數。
sc表
| 序號 | S_id | C_id | SCORE |
|---|---|---|---|
| 1 | 1 | 01 | 80 |
| 2 | 1 | 02 | 90 |
| 3 | 1 | 03 | 99 |
| 4 | 2 | 01 | 70 |
| 5 | 2 | 02 | 60 |
| 6 | 2 | 03 | 80 |
| 7 | 3 | 01 | 80 |
| 8 | 3 | 02 | 80 |
| 9 | 3 | 03 | 80 |
| 10 | 4 | 01 | 50 |
| 11 | 4 | 02 | 30 |
| 12 | 4 | 03 | 20 |
| 13 | 5 | 01 | 76 |
| 14 | 5 | 02 | 87 |
| 15 | 6 | 01 | 31 |
| 16 | 6 | 03 | 34 |
| 17 | 7 | 02 | 89 |
| 18 | 7 | 03 | 98 |
student表
| 序號 | S_id | Sname | Sage | Ssex |
|---|---|---|---|---|
| 1 | 1 | 趙雷 | 1990-01-01 | 男 |
| 2 | 2 | 錢電 | 1990-12-21 | 男 |
| 3 | 3 | 孫風 | 1990-05-20 | 男 |
| 4 | 4 | 李雲 | 1990-08-06 | 男 |
| 5 | 5 | 周梅 | 1991-12-01 | 女 |
| 6 | 6 | _蘭 | 1992-03-01 | 女 |
| 7 | 7 | 鄭竹 | 1989-07-01 | 女 |
| 8 | 8 | 王菊 | 1990-01-20 | 女 |
merge函數鏈接兩個表,all族參數代表是inner join/left join/right join,by族參數代表是on,通過什麼來鏈接。

全鏈接(左右都要)
all_join <- merge(sc,student,all = T,by.x = 'S_id')

inner join
inner_join <- merge(sc,student,all = F,by.y = 'S_id')
left join
left_join <- merge(sc,student,all.x = T,by.x = 'S_id',by.y = 'S_id')
right join
right_join <- merge(sc,student,all.y = T,by.y = 'S_id')
缺失值、異常值和重複值處理
1. 缺失值
1.1檢視是否有缺失值
summary(listing) # 使用summary函數,會返回每一列的缺失值數量
1.2刪除缺失值行
listings <- na.omit(listing) # 刪除listing裏面含有缺失值的所有行
1.3替換缺失值
price_mean <- mean(listing$price,na.rm = TRUE)
	1.3.1使用均值代替缺失值
listing$price_new <- ifelse(is.na(listing$price)== TRUE,price_mean,listing$price)# 新建一列變數price_new,如果是缺失值就用均值替代
summary(listing)
	1.3.2.使用前一個數據代替缺失值

	1.3.3.使用後一個數據代替缺失值
2. 異常值
2.1 基於統計分佈檢驗和去除異常值(x的值如果在μ±3s範圍外的數據均爲異常值)
x_3s <- sqrt(var(listing$price_new))*3
x <- mean(listing$price_new)
x_up <- x+x_3s
x_down <- x-x_3s
listing2 <- listing[which(listing$price_new>x_down & listing$price_new < x_up),]

2.2 基於箱線圖去除異常值(x的值從上下四分位數開始,超出1.5倍內距的值,均爲異常值)
box_result <- boxplot.stats(listing$price_new)
price_min <- box_result$stats[1]
price_max <- box_result$stats[5]
listing3 <- listing[which(listing$price_new>=price_min & listing$price_new<=price_max),]

3 刪除重複數據duplicated(需要不重複的列名)
listing4 <- listing[!duplicated(listing$room_type),]
時間序列數據處理
1. 日期時間格式轉換
Sys.Date()   # 輸出當前日期 "2020-07-30",返回的是日期格式值
Sys.time()   # 輸出當前日期和時間 "2020-07-30 16:05:26 CST",返回的是日期格式值
date()      # 顯示當前周幾、月份、日、時間、年份,但是不是日期格式的數據,是字串
is.Date(date())     # 可以看出,date()返回的是字串,不是日期格式的數據

time1 <- as.POSIXlt('2020-07-30 15:33:00') #將標準日期格式的字串轉變爲標準時間格式數據
time2 <- as.POSIXct('2020-07-30 15:33:00')  # 以秒儲存時間
unclass(time2)
time3 <- as.Date('2020-07-30 15:33:00')    # 只有年月日
unclass(time3) # 返回從1970-01-01到time3的天數,1970-01-01作爲0。(可以用作計算兩個日期之間相差多少天)

2.輸出具體日期年、月、周、季度
weekdays(time1) # 輸出星期幾
months(time1) # 輸出幾月
quarters(time1) # 輸出第幾季度

library(lubridate)  #lubridate日期函數包,傳入的值可以不是日期格式,但是形式要是日期形式,自帶包的必須傳日期格式的數據
year(time1)   # 自帶包裡沒有year函數,只有在lubridate包裏面纔有
weekdays(time1) # 輸出星期幾
months(time1) # 輸出幾月
quarters(time1) # 輸出第幾季度
day(time1) #輸出當月的第幾天

3. format函數提取關鍵資訊
a <- Sys.time()
format(a,'%y-%b')   # %d月份中的天數、%m月份(以數位形式)、%b月份(小寫數位)、%B月份完整的月份(中文)、%y年份(只顯示後兩位)、%Y年份(全年份)
第三章 表、圖
表
1. 頻數分佈表
table(listings$room_type)
prop.table(table(listings$room_type))

2. 列聯表
table(listings$neighbourhood,listings$room_type)
prop.table(table(listings$neighbourhood,listings$room_type),1)*100
prop.table(table(listings$neighbourhood,listings$room_type),2)*100
圖
1. 所有的圖都有以下參數
主標題main = NULL, 副標題sub = NULL, X軸標題xlab = NULL, Y軸標題ylab = NULL,

2. 柱狀圖
barplot(table(listings$room_type),horiz = T)  # horiz 預設FALSE,表示柱子垂直,TRUE表示柱子水平
barplot(table(listings$neighbourhood,listings$room_type))
barplot(table(listings$room_type,listings$neighbourhood),horiz = T)

3. 餅圖
pie(table(listings$room_type))
pie(table(listings$neighbourhood,listings$room_type))

4. 直方圖與核密度曲線
hist(listings$price,freq = F)
lines(density(listings$price),col='red') #核密度曲線

5.箱線圖 ---1.5倍內矩外的點就叫做離羣點,可以剔除,在圖中就是原點的形式
boxplot(listings$price)
boxplot(listings$price~listings$room_type)
boxplot(listings$price~listings$neighbourhood)

boxplot.stats(listings$price)  # 返回list,list$stats返回數據的四分位點及修正後的極值,list$n返回觀測值個數,list$conf返回中位數的置信區間,list$out返回箱線圖超過極值的離羣點
boxplot.matrix(listings$price)
6. 散點圖
listings$new_price<-listings$price^2/2300
plot(listings$price,listings$new_price)

7.圖形美化
c<-c(2,3,4,5,6,7)
d<-c(2,3,4,5,6,7)
a<-c(1,2,3,4,5,6)

opar<-par(no.readonly = TRUE)   # 生成一個可以修改的當前圖形參數列表
par(mfrow=c(1,2))     # 生成1行2列的畫布
par(pin=c(2,3))         # 圖形的寬,高
par(lwd=2,cex=1.5)   # 圖形中先的寬度2,點的大小1.5
par(cex.axis=0.75,font.axis=3)  # 字型大小0.75,字型型別3號
plot(a,c,type='b',pch=19,lty =2,col='red')  #a,c點點圖,有點有趨勢線,點型別19,線型別2(虛線),線顏色紅色
plot(a,d,type='b',pch=23,lty=6,col='blue',bg='green')    # a,d點圖,有點有趨勢線,點型別23,線型別6,線顏色藍色,背景顏色綠色
par(opar) # 結束該圖表參數列表
https://www.jianshu.com/p/f4fd994b50e0
使用ggplot2包實現畫圖
library(ggplot2)
listings$newtype<-as.factor(listings$room_type)
1. 散點圖
ggplot(listings,aes(x=price,y=new_price))+geom_point(pch=17,size=2,col='red')+geom_smooth(method = 'lm',linetype=2,fullrange=F)+labs(title = '散點圖',x='price',y='newprice')
ggplot(listings,aes(x=price,y=new_price))+geom_point()+geom_hline(yintercept = 1000) # 水平線
ggplot(listings,aes(x=price,y=new_price))+geom_point()+geom_vline(xintercept = 1000) # 垂直線
ggplot(listings,aes(x=price,y=new_price))+geom_point()+geom_line() # 連線各點
2. 柱狀圖
ggplot(listings,aes(x=neighbourhood))+geom_bar()

3.箱線圖
ggplot(listings,aes(y=price))+geom_boxplot()   # 垂直的箱線圖
ggplot(listings,aes(x=price))+geom_boxplot()   # 水平的箱線圖
ggplot(listings,aes(x=newtype,y=price))+geom_boxplot()  # price針對roomtype分組的箱線圖

4. 直方圖和核密度曲線
ggplot(listings,aes(x=price))+geom_histogram() #直方圖頻數分佈
ggplot(listings,aes(x=price))+geom_histogram(aes(y=..density..))+geom_density() # 直方圖頻率分佈及核密度曲線

5.折線圖
ggplot(listings,aes(x=price,y=new_price))+geom_point()+geom_line() # 連線各點
第四章 統計數值描述分析
自帶包
summary(listings)  # 數值型數據會把最大值,最小值,均值中位數和四分位數給出,分型別變數會給出數量
summary(listing)   # NA's就是缺失值數
Hmisc包的describe() 沒有數量的限制,對因子型變數有統計各水平的頻次和頻率。
library(Hmisc)
describe(listings)
pastecs包的stat.desc函數 數量在3-5000條-------不推薦使用
library(pastecs)
listings_4999<-listings[1:4999,]
stat.desc(listings_4999$price,norm = T)
psych包中describe()-------------推薦使用
(mad: 絕對中位差;trimmed:切尾均值,切尾比例爲0.1)
library(psych)
describe(listings)
describe(listings$price)
第五章 參數估計
點估計—總體均值和總體方差的點估計
summary(listings)
mean(listings$price,na.rm = TRUE) # 一個總體的均值點估計
var(listings$price,na.rm = T) # 一個總體的方差點估計
區間估計—總體均值的
1.計算區間估計上下限
t.test(listings$price,conf.level = 0.99) # 置信水平conf.level預設爲0.95
2.繪製箱線圖和直方圖,觀察分佈情況,是否符合正態分佈
p<-par(no.readonly = TRUE)
par(mfrow=c(1,2))
hist(listings$price,freq = F)
lines(density(listings$price),col='red')
boxplot(listings$price)
par(p)
3.繪製QQ圖檢驗是否服從正態分佈
qqnorm(listings$price);qqline(listings$price)
區間估計—總體方差的
R沒有自帶的計算方差的包,這裏編寫chisq.var.test函數來計算

chisq.var.test<-function(x,var,alpha=0.05,alternative='two.sided'){
  options(digits = 4)
  result<-list()
  n<-length(x)
  v<-var(x)
  result$var<-v
  chi2<-(n-1)*v/var
  result$chi2<-chi2
  p<-pchisq(chi2,n-1)
  if(alternative =='less'|alternative=='greater'){result$p.value<-p}else if(alternative=='two.sided'){if(p>0.5)p<-1-p
  p<-2*p
  result$p.value<-p}else return('your input is wrong')
  result$conf.int<-c((n-1)*v/qchisq(alpha/2,df=n-1,lower.tail = F),(n-1)*v/qchisq(alpha/2,df=n-1,lower.tail = T))
  result
}
chisq.var.test(listings$price,var(listings$price),0.05)
第六章 假設檢驗
總體均值的假設檢驗
單樣本T檢驗
1. 雙尾:
t.test(listings$price,mu=400) # conf.level(置信水平)預設0.95

2.單尾:
商業數據分析上看,一般單尾的p值是雙尾p值的一半,所以,一般雙尾的結果拒絕,那麼單尾的結果也會拒絕,所以一般商業數據分析的時候都不做單尾,只做雙尾檢驗。
t.test(listings$price,mu=400,alternative = 'greater')  # alternative參數代表備擇下設,如果是greater則是右尾,less則是左尾,two.sided(預設)即雙尾
兩樣本T檢驗
listings$newtype<-ifelse(listings$room_type=='Entire home/apt','Entire home/apt','other')
1.方差齊性檢驗--兩個總體方差是否相同
var.test(listings$price~listings$newtype)   # 方差齊性檢驗結果,原假設:兩樣本方差相同,備擇假設:兩樣本方差不同。
2.兩樣本T檢驗--原假設:兩樣本均值相同,備擇假設:兩樣本均值不同
	2.1兩樣本方差不同
	t.test(listings$price~listings$newtype,var.equal=F)   # var.equal預設爲FALSE,所以如果是方差非齊性的可以直接省略
	2.2兩樣本方差相同
	t.test(listings$price~listings$newtype,var.equal=T)
總體成數的假設檢驗
單樣本
(研究Entire home/apt佔比的單樣本總體成數檢驗)
listings$newtype <- as.factor(listings$newtype)
a <- summary(listings$newtype)
prop.table(table(listings$newtype))
b <- length(listings$newtype)
prop.test(a[1],b,p = 0.5,alternative = 'two.sided')  # 預設P=0.5,a[1]是成功的次數,b是總的次數,得到結果可以看出,總體成數明顯不等於0.5,拒絕原假設,區間估計範圍是0.6021214 0.6169395
兩樣本
(研究東城區和西城區的Entire home/apt方形佔比是否相同)
table(listings$neighbourhood,listings$newtype)  # 得到,東城區Entire home/apt房型1641個,總共2363套房子,西城區691套Entire home/apt,總共1094套房子
x <- c(1641,691)
n <- c(2363,1094)
prop.test(x,n,alternative = 'two.sided')
總體方差的假設檢驗
單樣本(R沒有自帶包的假設檢驗,需要自帶函數)
univariate.var.test = function(x,var,mu=Inf,alternative="two.sided"){
  n=length(x)
  df=n-1   #均值未知時的自由度
  var.est=var(x) #均值未知時的方差估計值
  if(mu<Inf){df=n;var.est=sum((x-mu)^2)/n}# 總體均值已知的情況
  chi2=df*var.est/var.est
  options(digits = 3)
  return(data.frame(Pop.var=var,Samp.var=var.est,df=df,Chi2.stat=chi2,P=2*min(pchisq(chi2,df),pchisq(chi2,df,lower.tail=F))))
  if(alternative=="greater")result$P=pchisq(chi2,df,lower.tail = F)
  else if(alternative=="less")result$P=pchisq(chi2,df)
  result
}
e <- univariate.var.test(listings$price,var(listings$price))
e
兩樣本
var.test(listings$price~listings$newtype)
第七章 卡方檢驗
自帶包卡方檢驗
chisq.test(listings$newtype,listings$room_type)
原假設:兩個分組型變數之間沒有關係,備擇假設:兩個分組型變數有明顯的關係
如果p值遠小於0.05那麼就說明拒絕原假設,說明兩個分組型變數間相關性很大
prettyR包中的xtab()進行卡方檢驗
library(prettyR)
xtab(~newtype+room_type,data=listings)
第八章 方差分析
單因素方差分析
1.將分組型變數轉變成因子數據
is.factor(listingsnew_roomtype <- as.factor(listingsnew_roomtype)
2.按因子分水平檢視各水平數據情況
tapply(listingsnew_roomtype,summary) # 按因子分水平檢視各水平數據情況,發現各水平均值都不同
3.進行單因素方差分析
anova(lm(listingsnew_roomtype)) # 結果P值如果小於0.05則說明該因子對price有顯著的影響
4.多重比較(LSD檢驗)—基於agricolae包
library(agricolae)
model <-aov(price~new_roomtype,data=listings)
model
out <- LSD.test(model,‘new_roomtype’,p.adj = ‘none’)
out
多因素方差分析
(一般在探索數據分析中,會將每個變數的互動項都進行分析下,如果沒有通過檢驗,則去除掉互動項再進行無互動項的方差分析)
本例中用room_type和neighbourhood兩個變數組進行雙因素方差分析
listings$neighbourhood_new<-as.factor(listings$neighbourhood) # 將行政區變數轉變成因子變數
無互動項的多因素方差分析
anova(lm(listings$price~listings$new_roomtype+listings$neighbourhood_new))
有互動項的多因素方差分析
anova(lm(listings$price~listings$new_roomtype+listings$neighbourhood_new+listings$new_roomtype*listings$neighbourhood_new))
雙因素方差分析的LSD多重比較
library(agricolae)
model <-aov(price~new_roomtype+neighbourhood_new,data=listings)
model
out <- LSD.test(model,c('new_roomtype','neighbourhood_new'),p.adj = 'none')
out
第九章 相關和迴歸
相關性分析
1.散點圖
plot(listings$price,listings$new_price) +
library(ggplot2)
ggplot(listings, aes(x = price, y = new_price)) + geom_point() + geom_smooth(method = "lm") + labs(x = "橫座標標題", y = "縱座標標題")
ggplot(listings, aes(x = price, y = sqrt(new_price))) + geom_point() + geom_smooth(method = "lm") + labs(x = "橫座標標題", y = "縱座標標題")
2.計算相關係數(pearson相關係數來看線性相關程度,spearman相關係數來看非線性相關程度)
cor(listings$price,listings$new_price)
cor(listings$price,listings$new_price,method = 'spearman')
3. 相關性的顯著性檢驗
cor.test(listings$price,listings$new_price) # 預設method是pearson相關係數
cor.test(listings$price,listings$new_price,method = 'spearman')
迴歸分析
簡單線性迴歸(一元線性迴歸)
1. 先做了相關分析;
2. 計算迴歸參數及迴歸方程:

listings<-na.omit(listing)
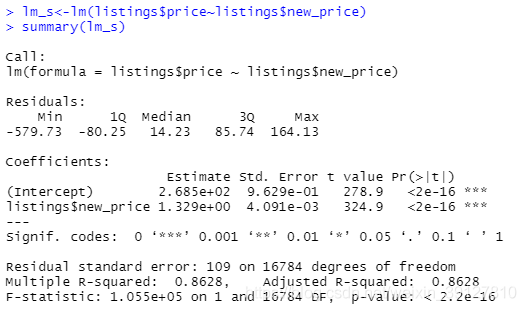
lm_s<-lm(listings$price~listings$new_price)
summary(lm_s)

3. 點預測及計算殘差
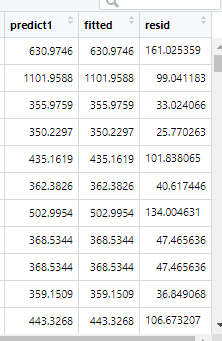
listings$predict1<-predict(lm_s)
listings$fitted<-fitted(lm_s)
listings$resid<-resid(lm_s)

predict和fitted都是點估計的預測方法,計算結果相同
殘差項用於後面對殘差進行分析

4. 區間預測
預測區間:result.pred <- predict(result,interval="prediction",level=0.95)
置信區間:result.pred <- predict(result,interval="confidence",level=0.95)
結果:

從結果可以看出,總體迴歸方程的R方是0.86,解釋性較好,F檢驗拒絕原假設,各係數的T檢驗也拒絕了原假設,說明兩個變數之間存在很強的相關性,並且迴歸方程擬合較好。
迴歸方程爲 price=1.329new_price+0.02685
