教你使用Prometheus-Operator進行K8s叢集監控
本文分享自華為雲社群《Promethues-operator入門使用指導》,作者:可以交個朋友。
一、 背景
在非operator設定的普羅中我們監控k8s叢集都是通過設定configmap進行服務發現和指標拉取。切換到prometheus-operator難免會有些使用問題。不少使用者已經習慣底層設定自動發現的方式。當過渡到servicemonitor或者podmonitor或多或少不習慣。所以下面就為大家介紹一下Prometheus-Operator,以及servicemonitor的使用方法
二、 Prometheus-Operator介紹
Prometheus Operator 為 Kubernetes 提供了對 Prometheus 相關監控元件的本地部署和管理方案,該專案的目的是為了簡化和自動化基於 Prometheus 的監控棧設定,主要包括以下幾個功能:
-
kubernetes自定義資源:使用kubernetes CRD 來部署和管理Prometheus,Alertmanager和相關元件
-
簡化的部署設定:直接通過kubernetes資源清單設定Prometheus,比如版本,持久化,副本,保留策略等等設定
-
Prometheus監控目標設定:基於熟知的kubernetes標籤查詢自動生成監控目標設定,無需學習prometheus特地的設定
2.1 架構
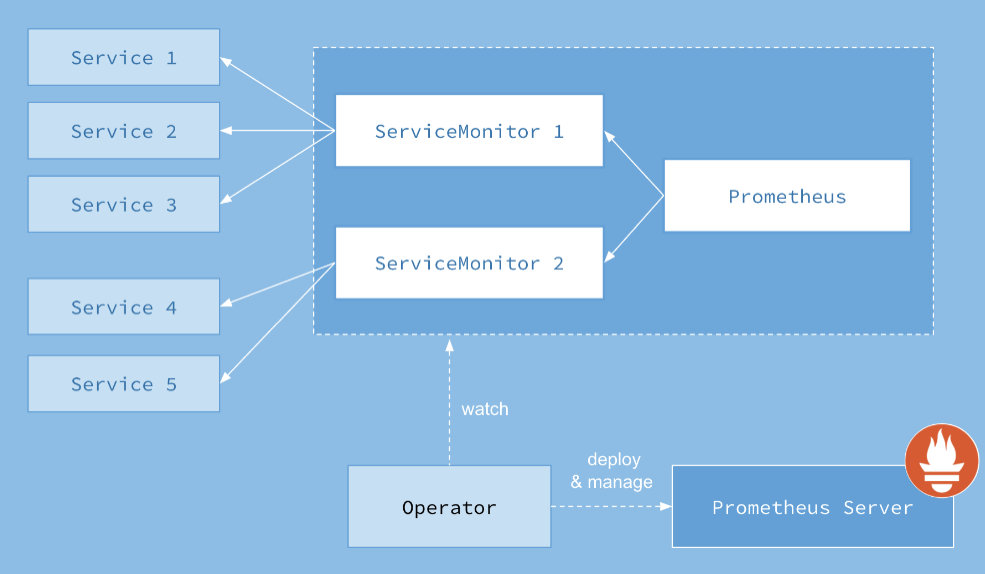
下圖是 Prometheus-Operator 官方提供的架構圖,各元件以不同的方式執行在 Kubernetes 叢集中,其中 Operator 是最核心的部分,作為一個控制器,它會去建立 Prometheus、ServiceMonitor、AlertManager以及 PrometheusRule 等 CRD 資源物件,然後會一直 Watch 並維持這些資源物件的狀態。
#注意:kube-state-metrics和prometheus-adapter的映象為谷歌官方庫的映象,國內可能存在拉取不到的問題,如果由於映象拉取不到導致pod pending,請將其替換成可獲取到的映象地址。
3.2 解除安裝
注意:此步驟為解除安裝步驟,如果想繼續保留Prometheus-Operator,請不要執行此步驟kubectl delete --ignore-not-found=true -f manifests/ -f manifests/setup
四、使用servicemonitor監控應用暴露的指標
建立deployment物件和service資源,該服務8080埠會暴露自身指標。
apiVersion: apps/v1
kind: Deployment
metadata:
  labels:
    app: sample-metrics-app
  name: sample-metrics-app
spec:
  replicas: 2
  selector:
    matchLabels:
      app: sample-metrics-app
  template:
    metadata:
      labels:
        app: sample-metrics-app
    spec:
      tolerations:
      - key: beta.kubernetes.io/arch
        value: arm
        effect: NoSchedule
      - key: beta.kubernetes.io/arch
        value: arm64
        effect: NoSchedule
      - key: node.alpha.kubernetes.io/unreachable
        operator: Exists
        effect: NoExecute
        tolerationSeconds: 0
      - key: node.alpha.kubernetes.io/notReady
        operator: Exists
        effect: NoExecute
        tolerationSeconds: 0
      containers:
      - image: luxas/autoscale-demo:v0.1.2
        name: sample-metrics-app
        ports:
        - name: web
          containerPort: 8080
        readinessProbe:
          httpGet:
            path: /
            port: 8080
          initialDelaySeconds: 3
          periodSeconds: 5
        livenessProbe:
          httpGet:
            path: /
            port: 8080
          initialDelaySeconds: 3
          periodSeconds: 5
---
apiVersion: v1
kind: Service
metadata:
  name: sample-metrics-app
  labels:
    app: sample-metrics-app
spec:
  ports:
  - name: web
    port: 80
    targetPort: 8080
  selector:
    app: sample-metrics-app
建立servicemonitor物件採集應用指標
apiVersion: monitoring.coreos.com/v1
kind: ServiceMonitor
metadata:
  name: sample-metrics-app
  labels:
    service-monitor: sample-metrics-app
spec:
  selector:
    matchLabels:
      app: sample-metrics-app  # 匹配標籤為app:sample-metrics-app的service
  endpoints:
  - port: web  #Promethues採集指標的埠為service中portName表示的埠
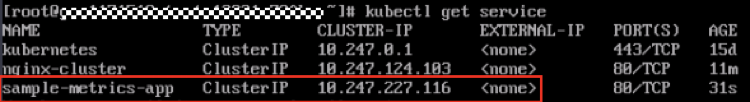
檢視新建的service,在叢集內節點上通過service IP存取應用kubectl get service
通過存取service IP的metrics介面可以檢視到應用暴露的指標curl 10.247.227.116/metrics
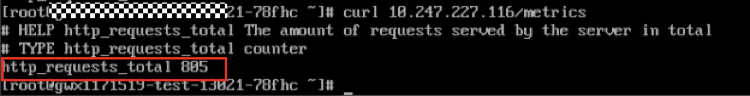
可以看到,應用暴露的指標是 「http_requests_total」 ,且監控採集到的數量是805
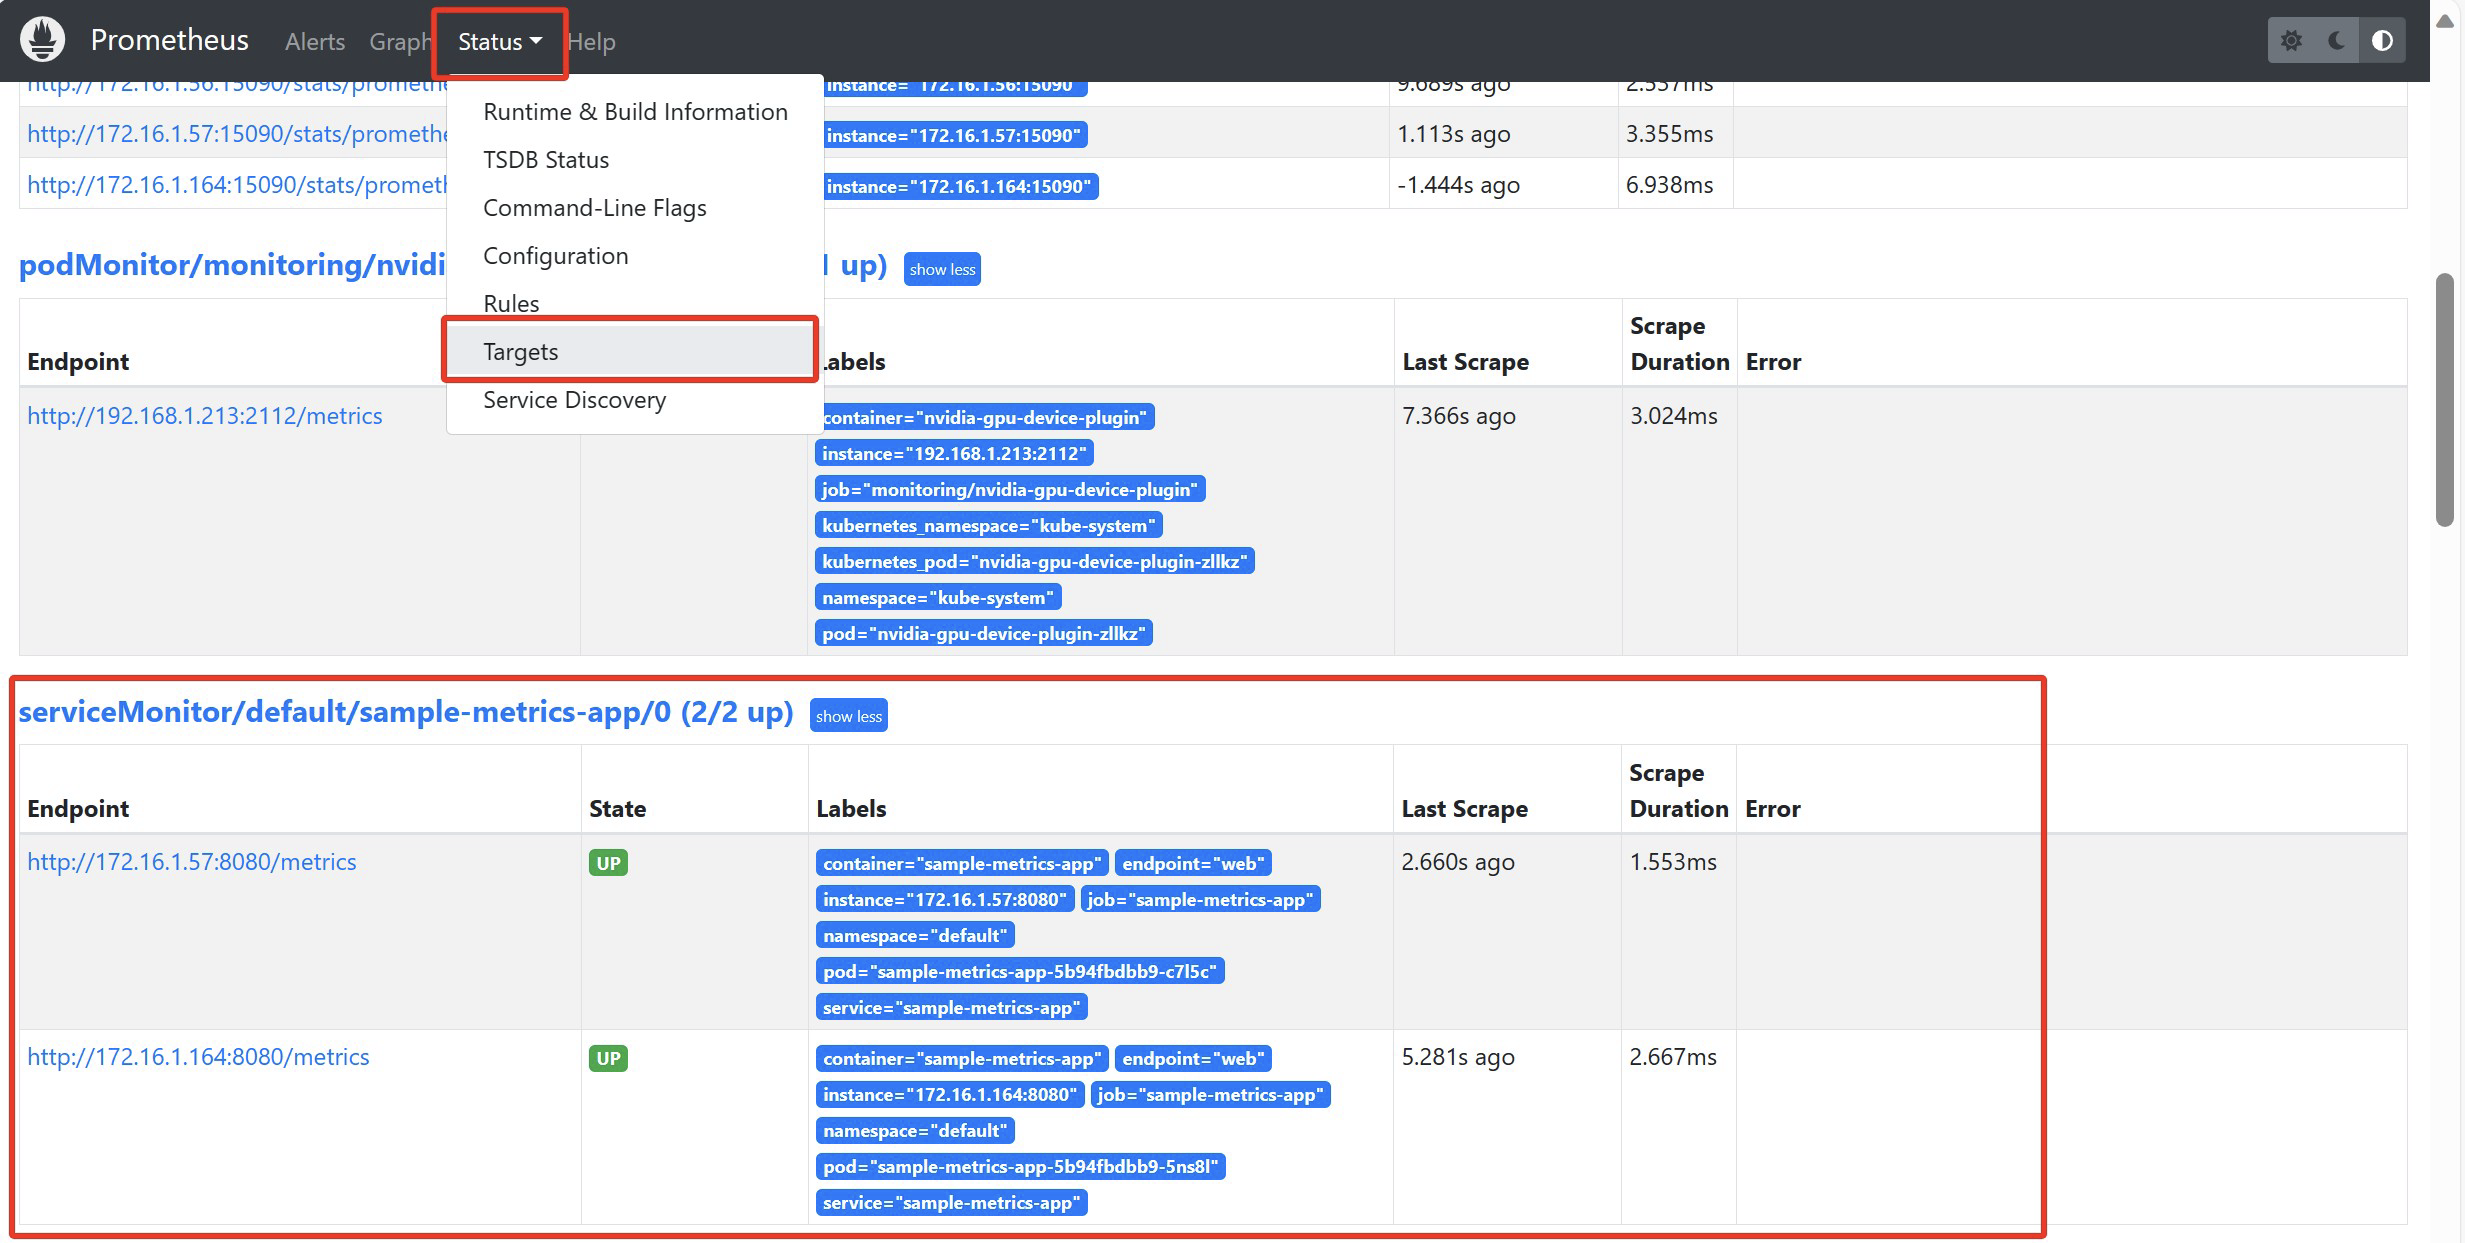
瀏覽器存取Prometheus UI介面檢視指標通過IP和埠存取prometheus-server,檢視servermonitor及指標監控情況