實現環形進度條效果【一】
2023-11-26 18:00:58
好基友扔過來一張效果圖,簡單分析下,一起看看如何實現它吧。

- 一個半環形用於表示 0 - 100%。
- 半環形開頭有一個圓點作為修飾。
- 半環形兩端需要呈現為圓角。
通過 div 實現
先畫一個長方形。
<div class="graph"></div>
.graph {
  width: 200px;
  height: 100px;
  border: 20px solid rgb (58, 215, 217);
}

接下來把長方形轉換為半環形。
.graph {
   width: 200px;
   height: 100px;
   border: 20px solid rgb (58, 215, 217);
+  border-radius: 0 0 200px 200px;
+  border-top: none;
}

給環形開頭新增圓點修飾,實際等於新增到長方形的左上角。
<div class="graph">
+  <div class="dot"></div>
</div>
.graph {
+ position: relative;
  width: 200px;
  height: 100px;
  border: 20px solid rgb (58, 215, 217);
  border-radius: 0 0 200px 200px;
  border-top: none;
}

+.dot {
+  position: absolute;
+  top: 5px;
+  left: -15px;
+  z-index: 9999;
+  width: 12px;
+  height: 12px;
+  border-radius: 50%;
+  background-color: #fff;
+  transform-origin: center top;
+}
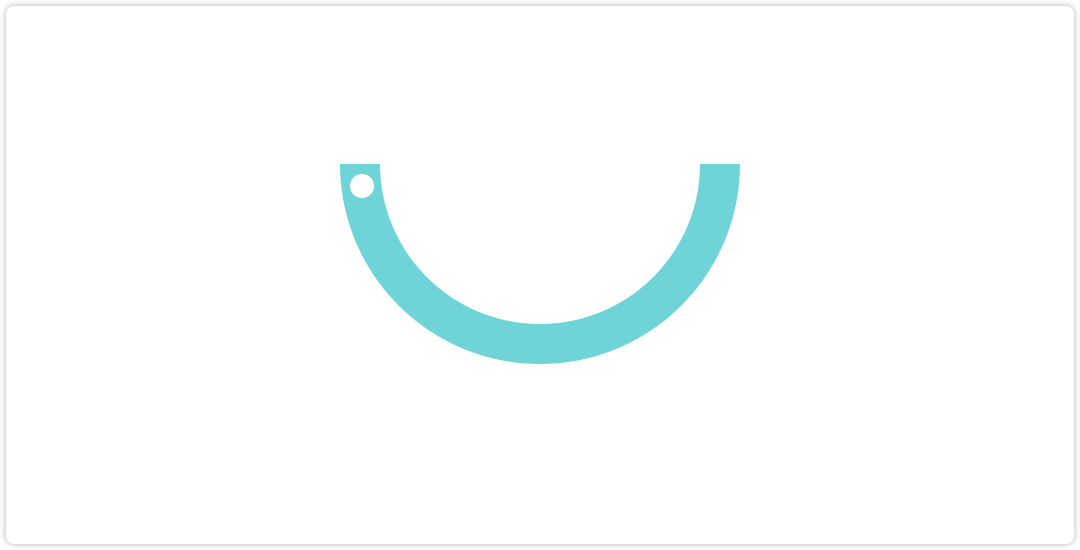
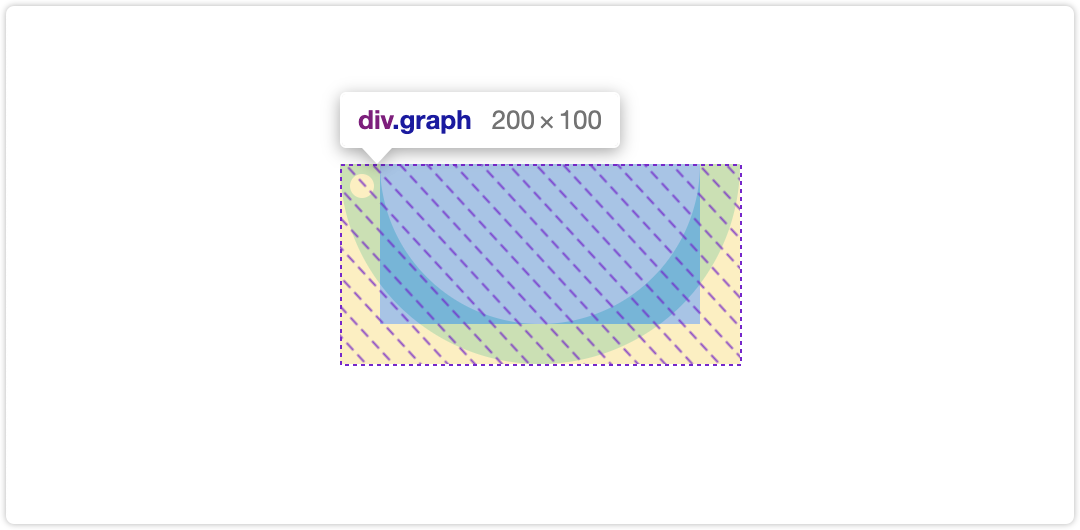
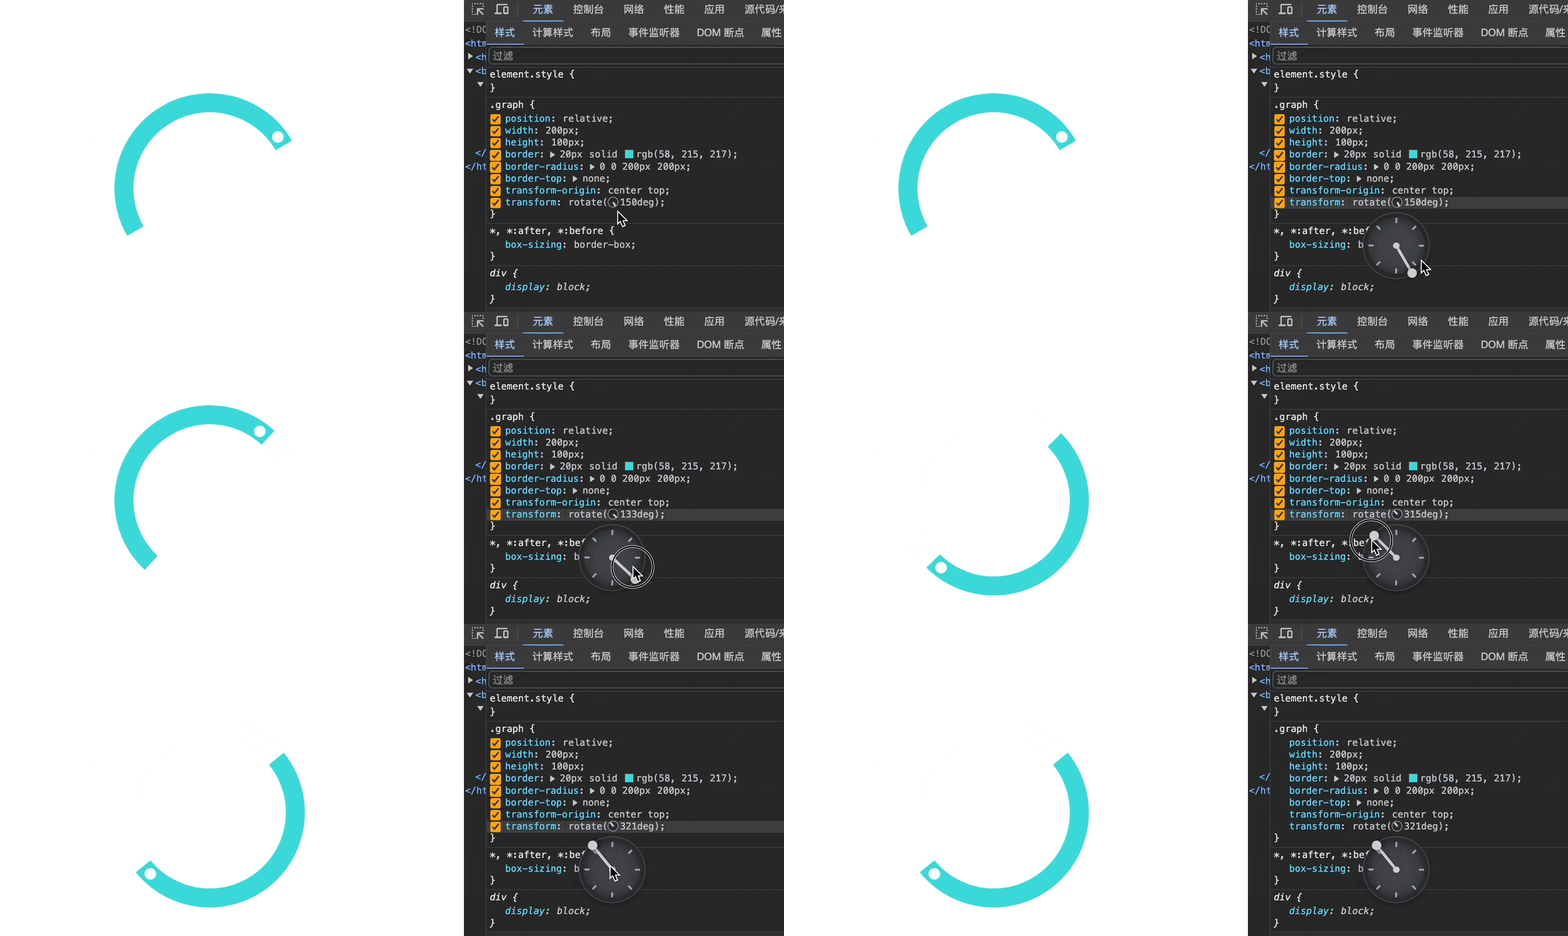
環形有了,如何實現進度條效果呢?讓半環形旋轉,並隱藏超出部分。可以給元素新增 transform 使其旋轉。
.graph {
  position: relative;
  width: 200px;
  height: 100px;
  border: 20px solid rgb (58, 215, 217);
  border-radius: 0 0 200px 200px;
  border-top: none;
+ transform: rotate (150deg);
}
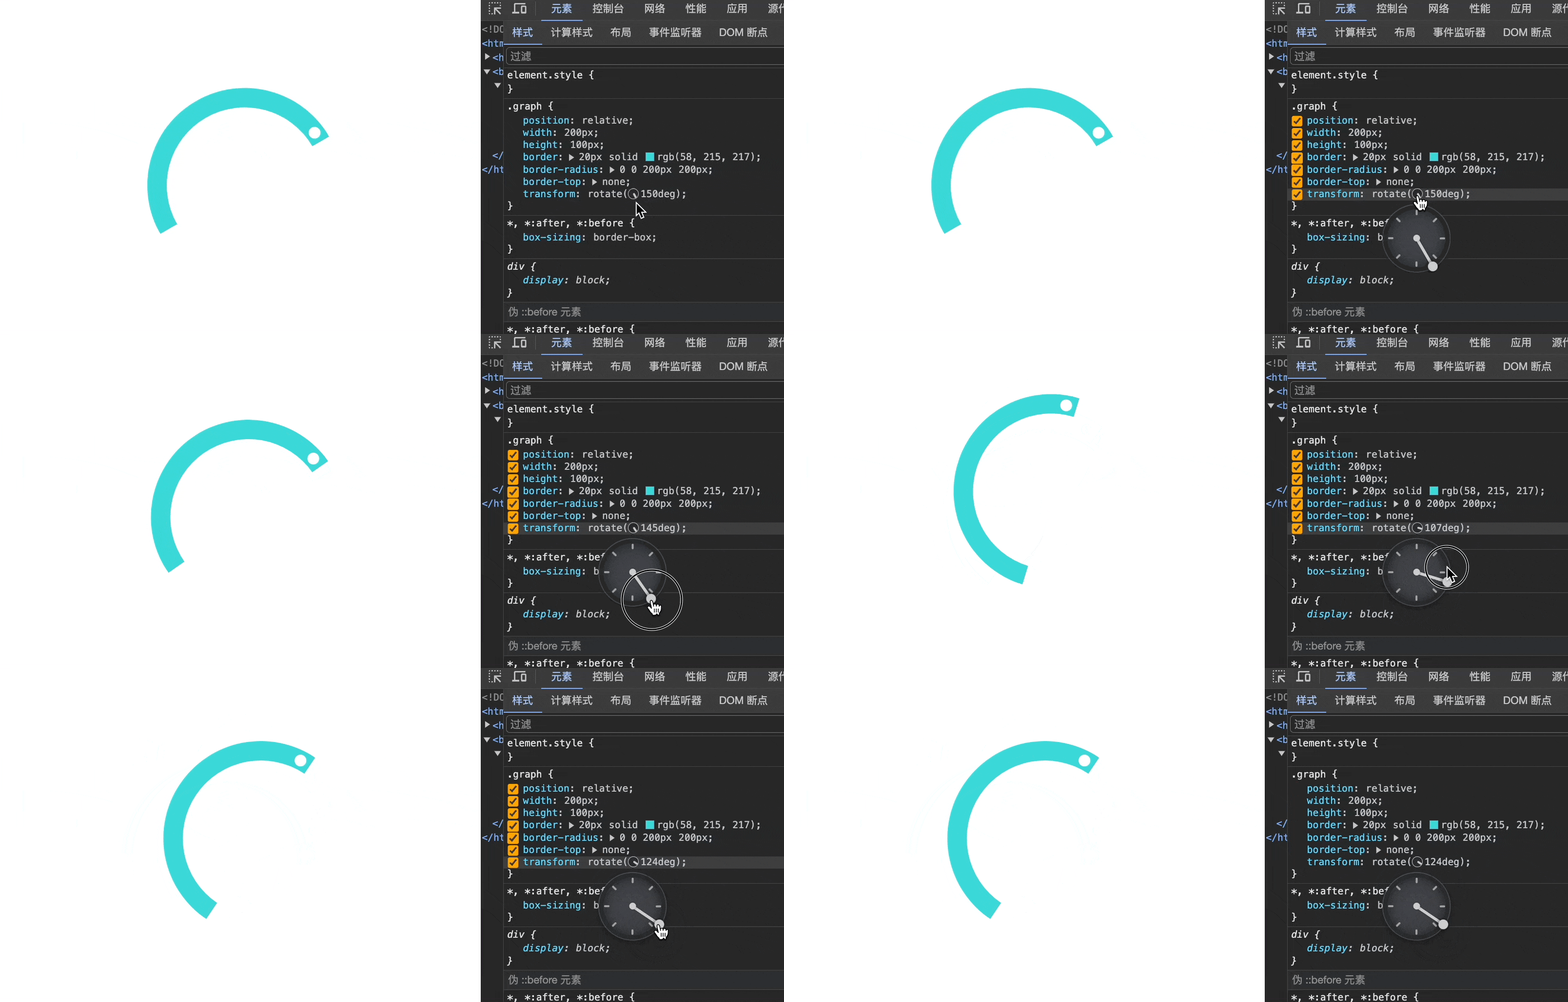
半環形並沒有根據中心點旋轉,通過 transform-origin: center top 設定原點為中間頂部,即環形的中心。
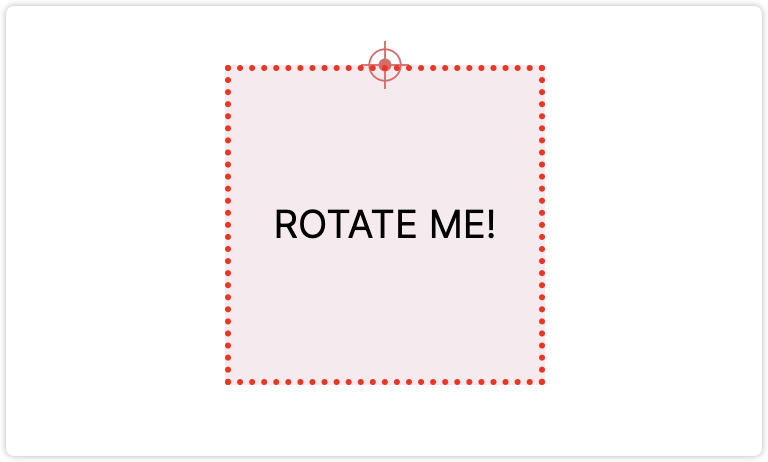
.graph {
  position: relative;
  width: 200px;
  height: 100px;
  border: 20px solid rgb (58, 215, 217);
  border-radius: 0 0 200px 200px;
  border-top: none;
+ transform-origin: center top;
  transform: rotate (150deg);
}
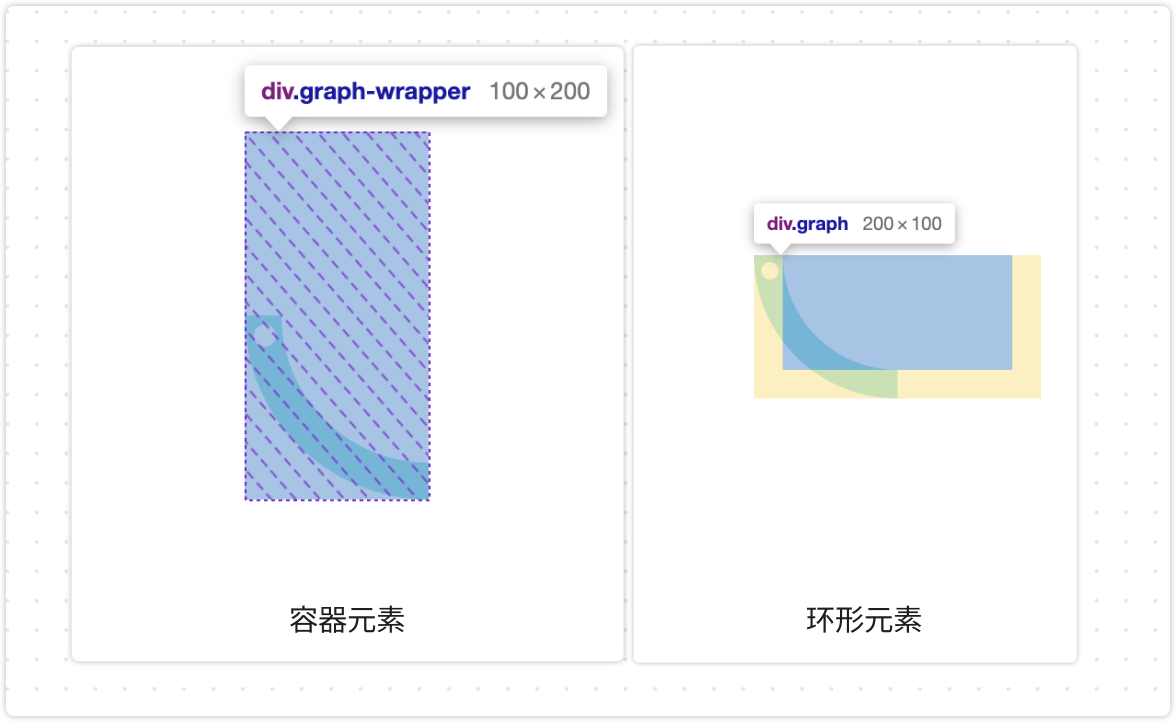
給環形新增一個父元素,並設定超出部分隱藏。
<div class="graph-wrapper">
  <div class="graph">
    <div class="dot"></div>
  </div>
</div>
.graph-wrapper {
  width: 200px;
  height: 100px;
  overflow: hidden;
  transform: rotate (90deg);
}
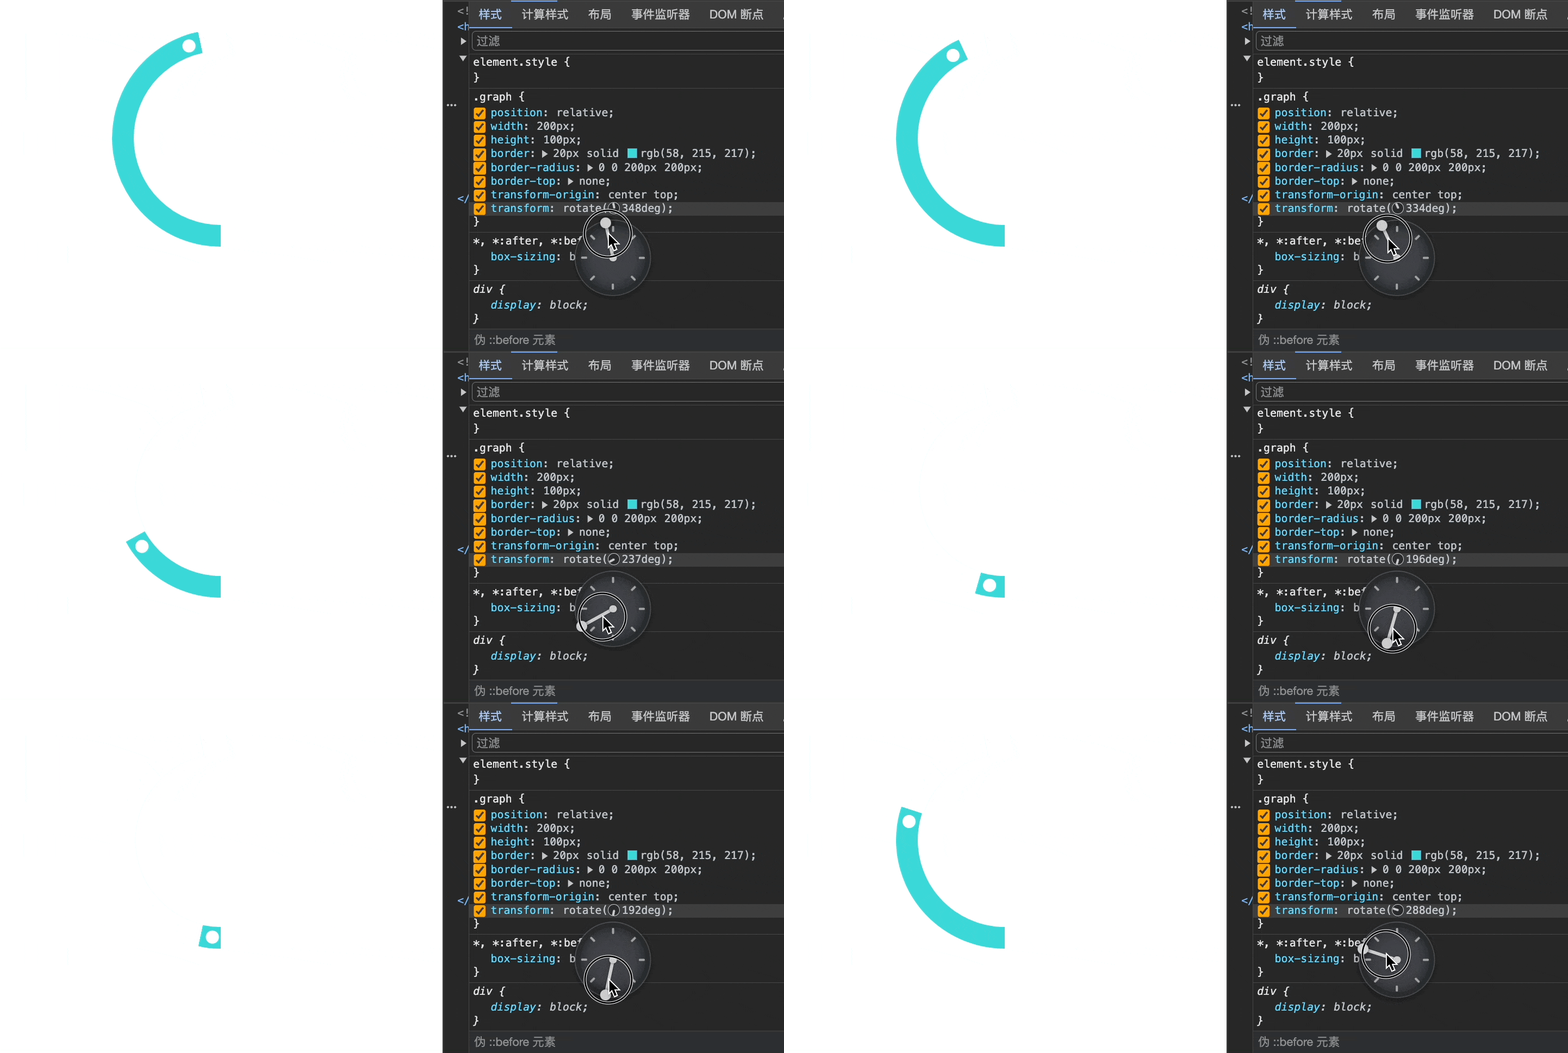
動態設定環形元素的 rotate 角度實就可以實現進度條效果了。0 - 100% 對應 180 - 360deg。
可以通過 JavaScript 設定半環形的進度。
function calculateValue(range, percentage) {
  const  [start, end] = range
  const result = start + (end - start) * percentage / 100;
  return result;
}

function renderGraph(percentage) {
  const deg = calculateValue ([180, 360], percentage);
  const el = document.querySelector ('.graph')
  el.style.transform = `rotate (${deg}deg)`
}

renderGraph (30) // 30%
總結
我們先使用 div 畫了一個長方形,新增 border 與 border-radius 屬性使其轉換為半環形,又通過 transform 屬性使半環形可以旋轉。接下來給半環形套了一層元素,超出部分隱藏,以實現進度條效果。
在博文開頭處,我們對效果圖進行了分析。其中,第 3 點 「半環形兩端需要呈現為圓角」 還沒有被支援。限於篇幅,將在接下來的博文中實現,最終效果如下圖。
