【PySide6】QChart筆記(三)—— QPieSeries的使用
2023-11-15 06:00:52
一、QPieSeries簡介
1. 官方描述
https://doc.qt.io/qtforpython-6/PySide6/QtCharts/QPieSeries.html
一個餅圖序列(QPieSeries)由一組 QPieSlice 類物件組成。slice的值可以是任意數值,當它被加入series後,QPieSeries 會計算出它佔所有切片值總和的百分比,以便確定該切片在餅圖中的實際大小。
餅圖在圖表中的大小【譯註:包括 QPieSeries 的屬性餅圖大小size、空洞大小holeSize】和位置【譯註:屬性horizontalPosition】都由一個 [0.0, 1.0] 範圍內的浮點值來控制。該值控制餅圖屬性的實際大小與餅圖所在QChart矩形區域大小相關。
預設情況下,餅圖有一個完整的圓周。
一個不完整的餅圖可以通過設定QPieSeries的起始角度【譯註:指屬性startAngle,設定方法為setPieStartAngle()】和生長角度【譯註:原文"angle span",但官方檔案沒有相關屬性和方法,僅有一個endAngle符合該情景,其設定方法為setPieEndAngle()】來實現。
一個完整的餅圖是360°,它的0°在12點鐘的方向【譯註:也就是正上方】。
1.1 屬性
| 屬性 | 描述 | 備註 |
|---|---|---|
| count | 切片數量 | |
| sum | 所有切片數值總和 | |
| startAngle | 餅圖開始的角度。預設值為0 | 數值沒有限制,甚至可以在 [-360, 360] 之外 |
| endAngle | 餅圖結束的角度。預設值為360 | 數值沒有限制,甚至可以在 [-360, 360] 之外。 若startAngle > endAngle,那麼餅圖將逆時針生長; 若startAngle與endAngle的差值大於360,那麼餅圖會出現重疊現象 |
| size | 餅圖大小。預設值為0.7 | 取值範圍 [0, 1] 。是相對於餅圖所在QChart的矩形區域而言的。 若取值為0,那麼餅圖不會顯示; 若取值為1,那麼餅圖佔滿QChart的矩形區域,也就是餅圖的邊界與QChart的矩形內接 |
| holeSize | 餅圖中心空洞的大小。預設值為0 | 取值範圍 [0, 1] 。是相對於餅圖所在QChart的矩形區域而言的。 若取值為0,那麼沒有空洞; 若取值為1,那麼空洞佔滿餅圖,也就沒有顯示餅圖; 若holeSize > size,那麼餅圖不會顯示(相當於餅圖被一個背景色的圓形完全遮擋) |
| horizontalPosition | 餅圖的水平位置。預設值為0.5 | 取值範圍 [0, 1] 。是餅圖的圓心相對於餅圖所在QChart的左右邊界範圍而言的。 若取值為0,那麼圓心在QChart的左邊界上; 若取值為1,那麼圓心在QChart的右邊界上 |
| verticalPosition | 餅圖的垂直位置。預設值為0.5 | 取值範圍 [0, 1] 。是餅圖的圓心相對於餅圖所在QChart的上下邊界範圍而言的。 若取值為0,那麼圓心在QChart的上邊界上; 若取值為1,那麼圓心在QChart的下邊界上 |
1.2 訊號
| 訊號 | 描述 |
|---|---|
| hovered(slice, state) | 滑鼠懸停到切片,或離開切片時觸發。滑鼠懸停到切片時,status為True,離開時為False |
2. 官方用例
https://doc.qt.io/qtforpython-6/examples/example_charts_piechart.html
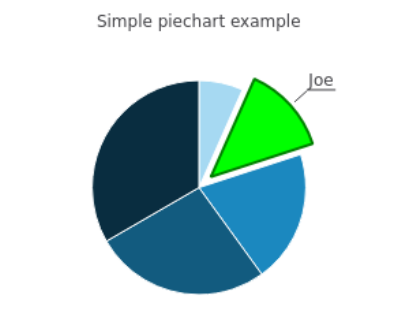
該用例繪製了含有5個切片的餅圖。

2.1 建立餅圖
# Copyright (C) 2022 The Qt Company Ltd.
# SPDX-License-Identifier: LicenseRef-Qt-Commercial OR BSD-3-Clause

"""PySide6 port of the Pie Chart Example from Qt v5.x"""

import sys
from PySide6.QtCore import Qt
from PySide6.QtGui import QPainter, QPen
from PySide6.QtWidgets import QMainWindow, QApplication
from PySide6.QtCharts import QChart, QChartView, QPieSeries


class TestChart(QMainWindow):

    def __init__(self):
        super().__init__()

        # 建立餅圖序列QPieSeries
        self.series = QPieSeries()

        # 向QPieSeries中新增切片 (3種append方法之一:直接傳入標籤和數值)
        self.series.append('Jane', 1)
        self.series.append('Joe', 2)
        self.series.append('Andy', 3)
        self.series.append('Barbara', 4)
        self.series.append('Axel', 5)

        # 設定第二個切片QPieSlice的格式
        self.slice = self.series.slices()[1]
        # 使其分離餅圖中心 (該方法的形參exploded預設為True)
        self.slice.setExploded()
        # 使標籤可見 (該方法的形參visible預設為True)
        self.slice.setLabelVisible()
        # 設定該切片的輪廓顏色
        self.slice.setPen(QPen(Qt.darkGreen, 2))
        # 設定該切片的內部填充顏色
        self.slice.setBrush(Qt.green)

        self.chart = QChart()
        self.chart.addSeries(self.series)
        self.chart.setTitle('Simple piechart example')
        self.chart.legend().hide()

        self._chart_view = QChartView(self.chart)
        self._chart_view.setRenderHint(QPainter.Antialiasing)

        self.setCentralWidget(self._chart_view)


if __name__ == "__main__":
    app = QApplication(sys.argv)

    window = TestChart()
    window.show()
    window.resize(440, 300)

    sys.exit(app.exec())
二、實踐
1. 用例說明
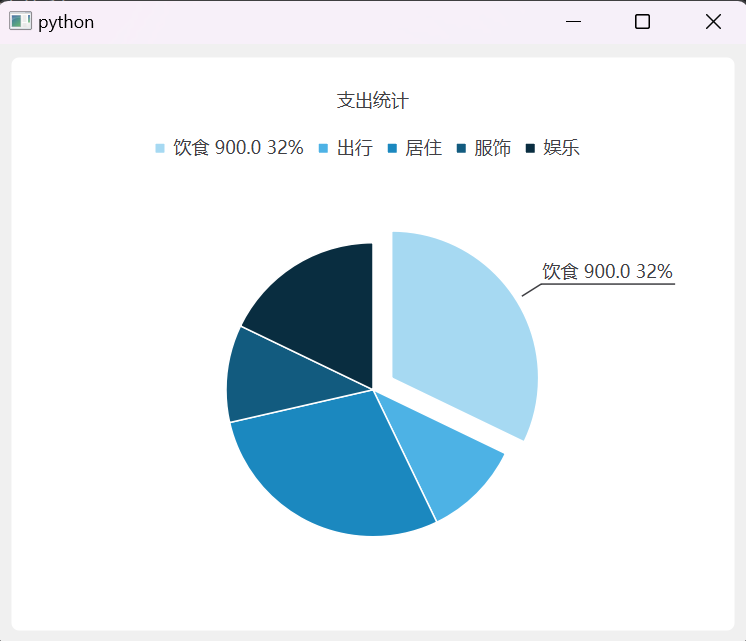
用支出型別及其數值,繪製餅圖。

2. 程式碼實現
from PySide6.QtCharts import QChart, QChartView, QPieSeries, QPieSlice
from PySide6.QtGui import QPainter
from PySide6.QtWidgets import QApplication, QMainWindow


# 滑鼠懸停在切片slice上時觸發
def onHovered(the_slice: QPieSlice, state: bool):
    the_slice.setExploded(state)
    the_slice.setLabelVisible(state)
    pure_label = the_slice.label().split(' ')[0]
    if state:
        the_slice.setLabel(f'{pure_label} {the_slice.value()} {the_slice.percentage():.0%}')
    else:
        the_slice.setLabel(pure_label)


app = QApplication([])
window = QMainWindow()
chart = QChart()
chart.setTitle('支出統計')
chart.setAnimationOptions(QChart.AnimationOption.SeriesAnimations)

# 準備資料
axisY_value1 = [10 - 2 * i for i in range(5)]
axisY_value2 = [5 + i * (-1) ** i for i in range(5)]

# 建立餅圖切片slice
slice_eating = QPieSlice('飲食', 900)
slice_go_out = QPieSlice('出行', 300)
slice_shelter = QPieSlice('居住', 800)
slice_clothing = QPieSlice('服飾', 300)
slice_entertainment = QPieSlice('娛樂', 500)
slice_list = [slice_eating, slice_go_out, slice_shelter, slice_clothing, slice_entertainment]

# 建立餅圖序列series
pie_series = QPieSeries()
# 繫結訊號與槽
pie_series.hovered.connect(onHovered)

# 將slice加入series
pie_series.append(slice_list)

# 將series加入chart
chart.addSeries(pie_series)

# 顯示圖表
chartView = QChartView(chart)
chartView.setRenderHint(QPainter.Antialiasing)
window.setCentralWidget(chartView)
window.show()

# 更新資料
pie_series.clear()
new_value = [(i + 2) * 10 for i in range(5)]
slice_new_list = [QPieSlice(f'飲食{i + 1}', new_value[i]) for i in range(5)]
pie_series.append(slice_new_list)

window.resize(500, 400)
app.exec()
三、問題與總結
比較簡單,暫時未遇到問題
本文來自部落格園,作者:林風冰翼,轉載請註明原文連結:https://www.cnblogs.com/LinfengBingyi/p/17832817.html