機器學習從入門到放棄:硬train一發手寫數位識別
一、前言
前面我們瞭解了關於機器學習使用到的數學基礎和內部原理,這一次就來動手使用 pytorch 來實現一個簡單的神經網路工程,用來識別手寫數位的專案。自己動手後會發現,框架裡已經幫你實現了大部分的數學底層邏輯,例如資料集的預處理,梯度下降等等,所以只要你有足夠棒的idea,你大部分都能相對輕鬆去實現你的想法。
二、實踐準備
資料處理往往是放在所有工作的首位,比如這裡使用到的 MNIST 資料集,MNIST 是由Yann LeCun等人提供的免費的影象識別的資料集,其中包含60000個訓練樣本和10000個測試樣本,其中圖的尺寸已經進行標準化的處理,都是黑白影象,大小為28*28。
在 pytorch 框架中自帶資料集由兩個上層的API提供,分別是 torchvision 和 torchtext,也就是視覺和文字。其中,torchvision提供了對照片資料處理相關的API和資料,資料所在位置:torchvision.datasets,比如torchvision.datasets.MNIST(手寫數位相片資料);torchtext提供了對文字資料處理相關的API和資料,資料所在位置:torchtext.datasets,比如torchtext.datasets.IMDB(電影評論文字資料)。
我們直接對 torchvision.datasets.MNIST 進行範例化,就可得到Dataset的範例:
train_loader = torch.utils.data.DataLoader(
    torchvision.datasets.MNIST('./data', train=True, download=True,
                               transform=torchvision.transforms.Compose([
                                   torchvision.transforms.ToTensor(),
                                   torchvision.transforms.Normalize(
                                       (0.1307,), (0.3081,)
                                   )
                               ])),
    batch_size=batch_size, shuffle=True
)
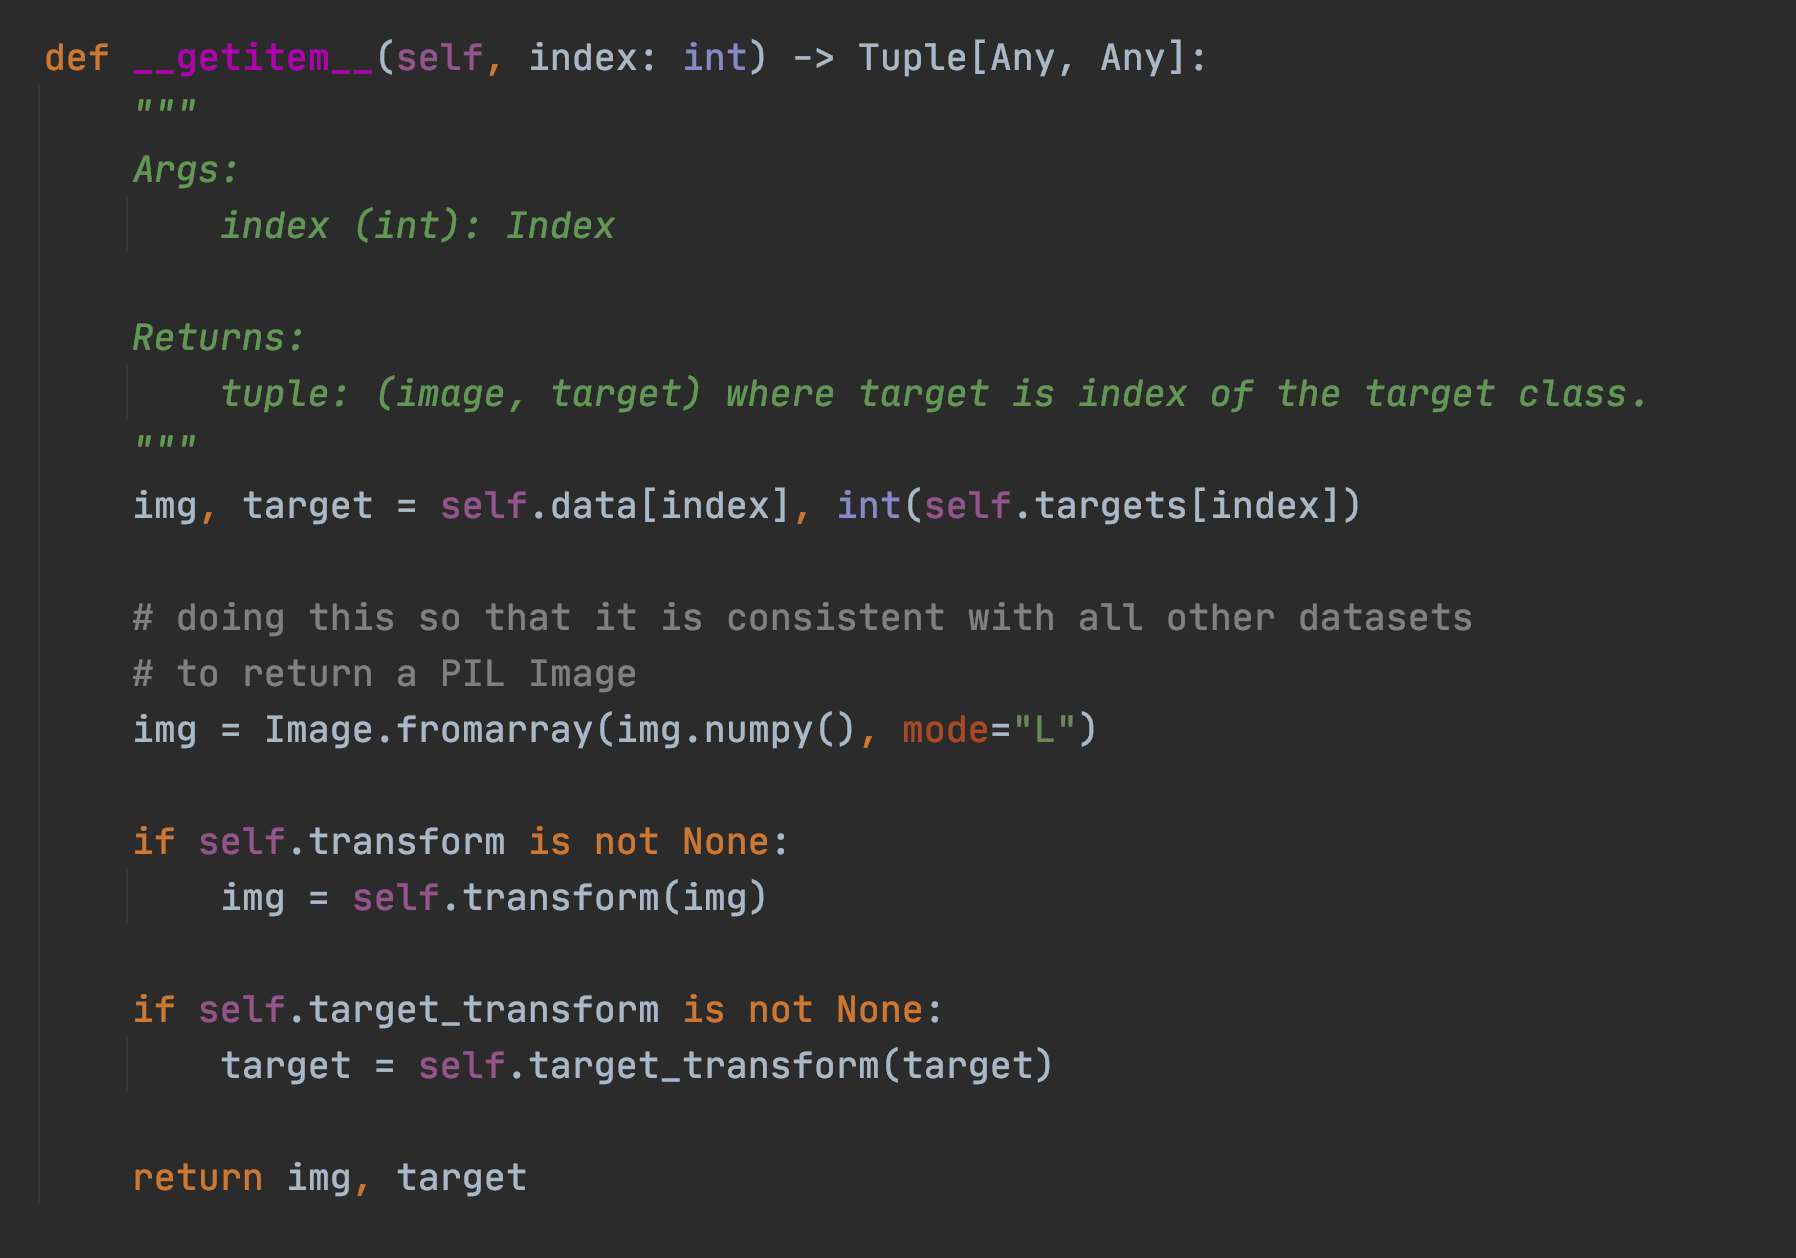
在框架中提供的 DataLoader 方法中,只要實現了三個函數方法,分別是: init, len, and getitem,就可以定義資料如何載入到 torch 中。我們看看內建的 MNIST 中是怎麼做的:

這裡將 MNIST 資料來源從遠端下載,並且指定轉化函數 transform,這裡的 tranform 一般指的是對圖片 resize 重新指定大小,然後變成框架中可以識別的張量等等。並且指定輸入和輸出的資料,在這裡就是輸入的是圖片 data,輸出的是這個圖片的分類特質 target,比如 0-9 的分類標識。

本質上 dataloader 是一個迭代器,可以在每次迴圈中返回處理過的批資料,而 getitem 方法保證了在原始圖片能被處理過後進行返回,比如上面的將圖片進行轉換成矩陣陣列,然後通過 transform 進行轉變預處理,再返回輸入和輸出,這裡指的是 img 和 target。

len 函數相對就比較簡單了,返回data的陣列長度。
在 dataset 資料集中還提供了 transforms 功能, 我們可以使用 transform=torchvision.transforms.Compose 方法來定義使用何種 transforms 方法,這裡框架會自動排序,而不用刻意擔心執行的順序。比如這裡使用的是:
torchvision.transforms.ToTensor    // 可以把影象轉變成 tensor 型別
torchvision.transforms.Normalize   // 歸一化處理
對於 toTensor 方法,我們可以看看當一個 batch 的圖片從 DataLoader 類處理過後,吐出來是怎樣的資料結構:
# 展示一個 batch 的圖片
x, y = next(iter(train_loader))
print(x.shape, y.shape, x.min(), x.max())
# torch.Size([512, 1, 28, 28]) torch.Size([512]) tensor(-0.4242) tensor(2.8215)
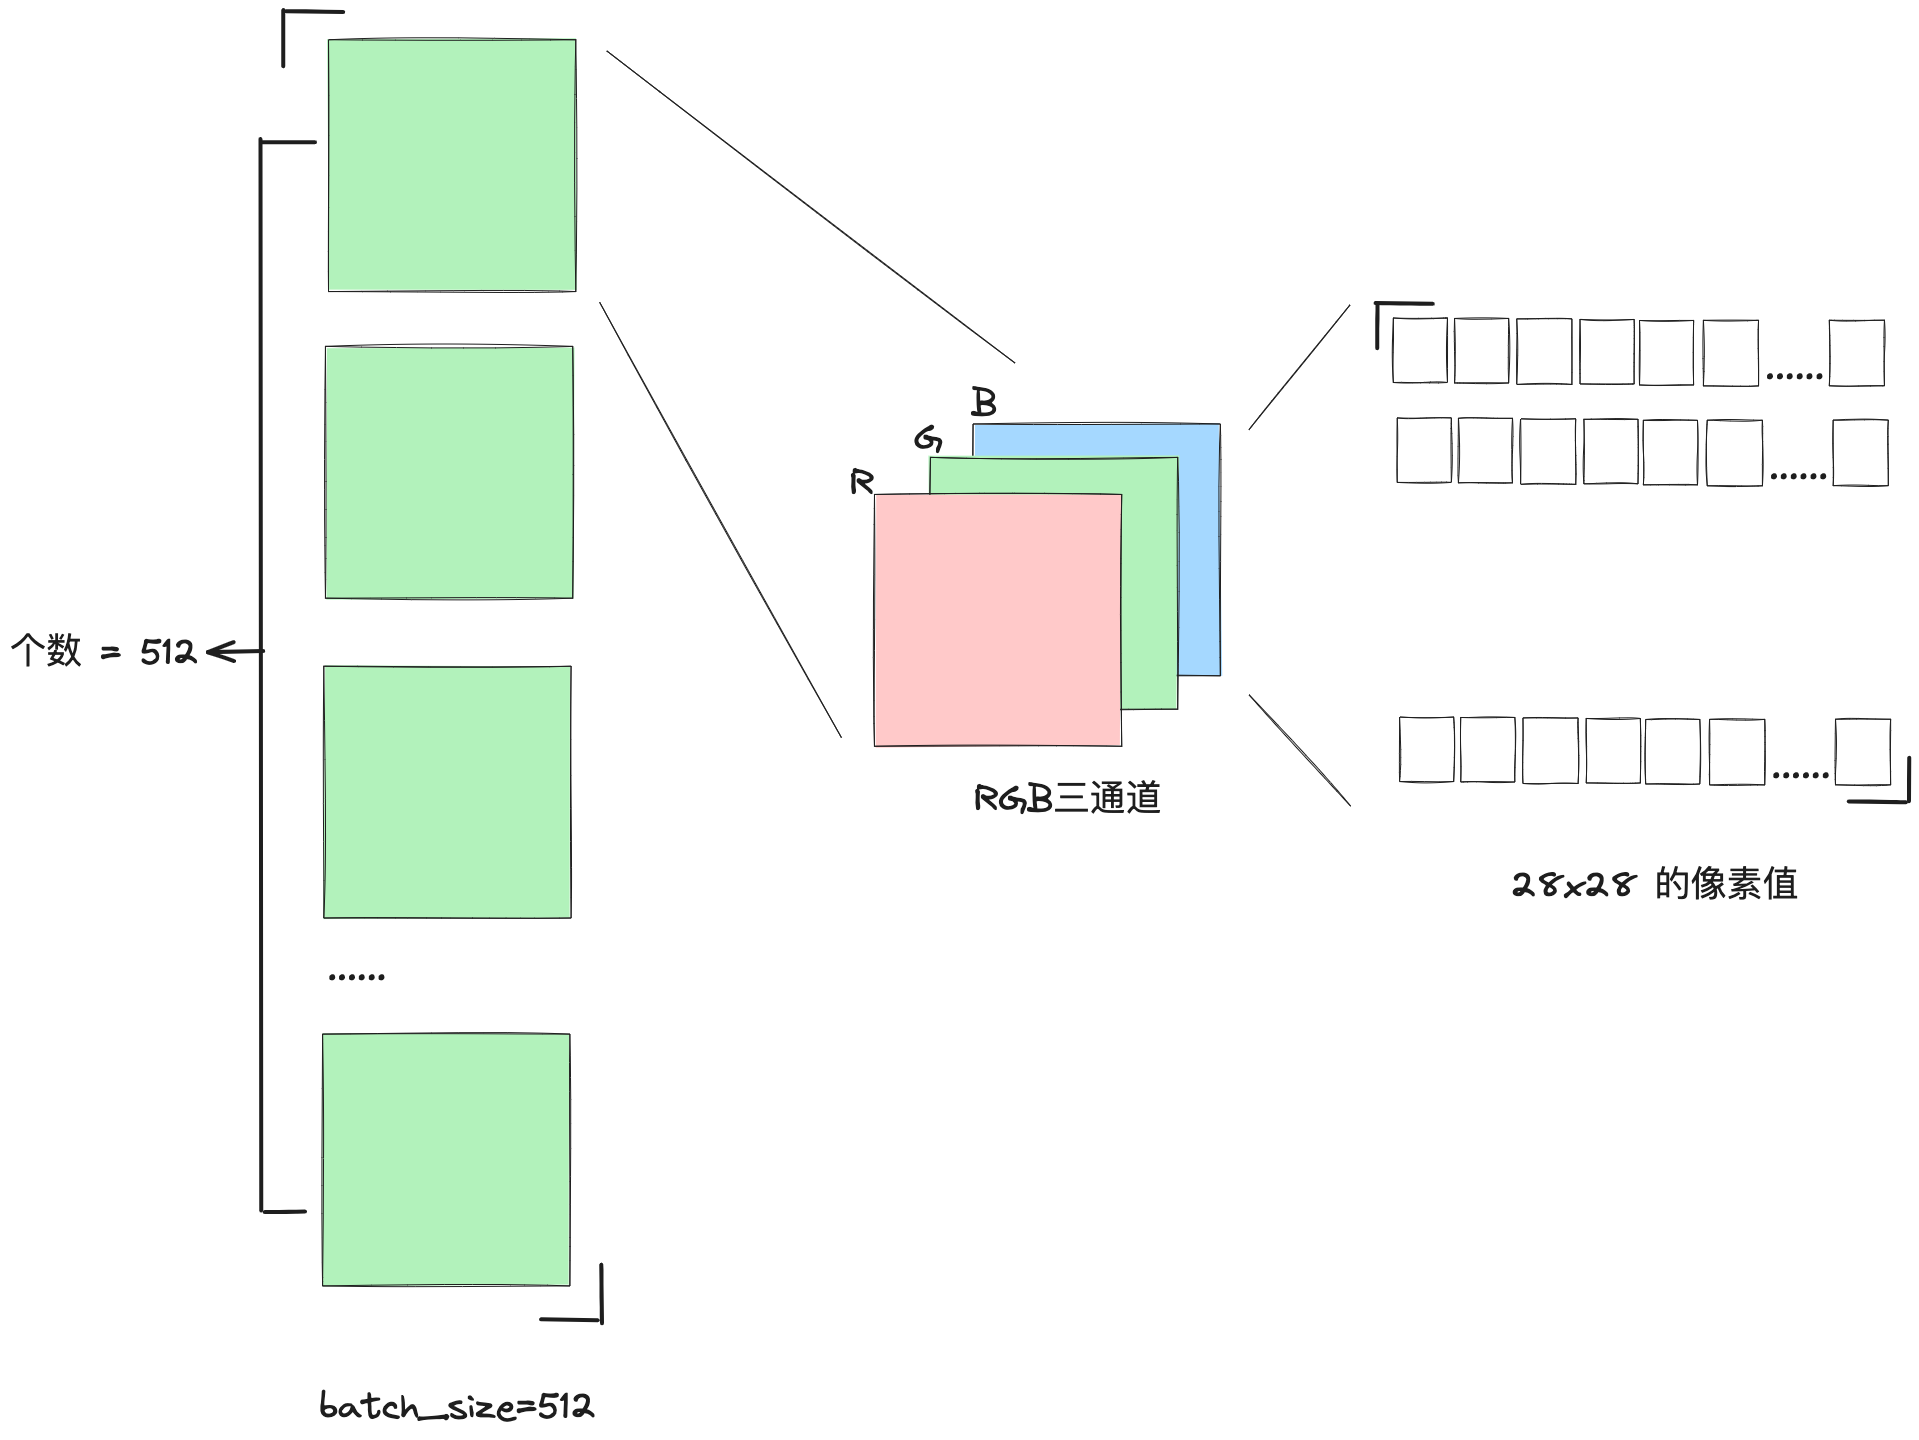
# 512張圖,1通道,28*28畫素,label大小512
plot_image(x, y, 'image sample')
剛開始看到 torch.Size 的值 [512, 1, 28, 28] 的時候,會覺得這也太抽象了~~ 為了嘗試理解圖片處理過後的張量形式,我花了一張圖:

關於歸一化處理的可以參考吳老師的這個視訊,瞭解過後你就會立即明白為什麼預處理需要加上歸一化了:https://www.bilibili.com/video/BV1pm4y1T7wx/?p=26&spm_id_from=333.880.my_history.page.click&vd_source=122a8013b3ca1b80a99d763a78a2bc50
這裡此處的 0.1307 和 0.3081 分別是資料集的均值和方差。在計算得到資料集的均值和方差後,我們可以使用標準化公式將資料標準化為標準正態分佈N(0, 1)。標準化的公式如下:
Z = (X - μ) / σ
其中,Z是標準化後的資料,X是原始資料,μ是原始資料的均值,σ是原始資料的標準差。
這個公式的作用是將原始資料集的均值變為0,標準差變為1。在這個過程中,每個原始資料值都會減去均值,然後再除以標準差。這樣做的結果是,新的資料集(即標準化後的資料)的均值為0,標準差為1,也就是說,資料符合標準正態分佈N(0, 1)。
在處理MNIST資料集時,我們已經得到了均值mean=0.1307和標準差std=0.3081,所以我們可以使用上述公式對資料集進行標準化。在上面程式碼中,我們使用torchvision.transforms模組中的Normalize函數來實現這個功能。
除此之外,transforms 還可以做很多影象上的變換,這裡總結一共有四大類,方便以後索引:
1. 裁剪(Crop)
中心裁剪:transforms.CenterCrop
隨機裁剪:transforms.RandomCrop
隨機長寬比裁剪:transforms.RandomResizedCrop
上下左右中心裁剪:transforms.FiveCrop
上下左右中心裁剪後翻轉,transforms.TenCrop
2. 翻轉和旋轉(Flip and Rotation)
依概率p水平翻轉:transforms.RandomHorizontalFlip(p=0.5)
依概率p垂直翻轉:transforms.RandomVerticalFlip(p=0.5)
隨機旋轉:transforms.RandomRotation
3. 影象變換(resize)transforms.Resize
標準化:transforms.Normalize
轉為tensor,並歸一化至[0-1]:transforms.ToTensor
填充:transforms.Pad
修改亮度、對比度和飽和度:transforms.ColorJitter
轉灰度圖:transforms.Grayscale
線性變換:transforms.LinearTransformation()
仿射變換:transforms.RandomAffine
依概率p轉為灰度圖:transforms.RandomGrayscale
將資料轉換為PILImage:transforms.ToPILImage
將lambda應用作為變換:transforms.Lambda
4. 對transforms操作,使資料增強更靈活
從給定的一系列transforms中選一個進行操作:transforms.RandomChoice(transforms),
給一個transform加上概率,依概率進行操作 :transforms.RandomApply(transforms, p=0.5)
將transforms中的操作隨機打亂:transforms.RandomOrder
三、搭建網路和計算
因為剛開始我們只是為了熟悉一下怎麼使用 pytorch 來搭建一個簡單的神經網路,所以這裡我選擇使用最簡單的全連線,使用三層的網路來進行手寫數位的識別。
# step 2 : 網路
class Net(nn.Module):
    def __init__(self):
        super(Net, self).__init__()

        # xw+b
        # 28*28 輸入, 256 第一層的輸出
        self.func1 = nn.Linear(28 * 28, 256)
        # 64 第二層輸出
        self.func2 = nn.Linear(256, 64)
        # 10 分類輸出 0~9
        self.func3 = nn.Linear(64, 10)

    def forward(self, x):
        x = F.relu(self.func1(x))
        x = F.relu(self.func2(x))
        x = self.func3(x)
        return x


net = Net()
# [w1, b1, w2, b2, w3, b3] 三個方程中需要優化的物件引數, lr - learning rate
optimazer = optim.SGD(net.parameters(), lr=0.005, momentum=0.9)
train_loss = []
nn.Linear 可以幫助我們建立一個線性迴歸方程,並且可以指定它輸入和輸出的變數個數。並且每一層全連線的線性函數都接著一個 relu 層,因為我們今天做的是分類的任務,所以使用 relu 會更好的提取到非線性的特徵,最後能快速收斂到 0-9 這十個數位分類上去。

梯度下降的優化器則是使用的 SGD 演演算法,只需要宣告學習率和動量值就可以了,接下來我們只需要硬train一發,計算過程如下:
# step 3 : 計算
for epoch in range(3):
    for batch_idx, (x, y) in enumerate(train_loader):
        # x: [b,  1, 28, 28], y: [512]
        # [b,  1, 28, 28] => [b, 784]
        x = x.view(-1, 28 * 28)
        # => [b, 0]
        out = net(x)
        # y_onehot 圖片label的向量
        y_onehot = one_hot(y)

        # loss函數方差
        # loss = mse(out, y_onehot)
        loss = F.mse_loss(out, y_onehot)

        # 清零梯度
        optimazer.zero_grad()
        # 計算梯度
        loss.backward()
        # 更新梯度
        optimazer.step()

        train_loss.append(loss.item())

        if batch_idx % 10 == 0:
            print(epoch, batch_idx, loss.item())
在這個過程我們也可以關注 train_loss 的值,也就是每個 batch 訓練後 loss 方程的 minima 的值,我們使用影象進行展示:

可以看到輸出中最後的 loss 損失已經降低到 0.041778046637773514 了,那麼接下來我們使用測試資料,對我們的這個模型預測進行評測,看看在測試資料上,我們的準確值能達到多少?
四、測試
和訓練的時候一樣,咱們可以先把測試的資料先載入進來:
test_loader = torch.utils.data.DataLoader(
    torchvision.datasets.MNIST('./data', train=True, download=True,
                               transform=torchvision.transforms.Compose([
                                   torchvision.transforms.ToTensor(),
                                   torchvision.transforms.Normalize(
                                       (0.1307,), (0.3081,)
                                   )
                               ])),
    batch_size=batch_size, shuffle=False
)
接著迴圈測試資料,並且使用我們之前宣告的網路 net 來進行預測,獲取到其中預測可能性最大的當做輸出的 label
# step 4 : 準確度測試
total_correct = 0
for x, y in test_loader:
    x = x.view(x.size(0), 28 * 28)
    out = net(x)
    # argmax返回這個維度中間值最大的那個索引,dim=1 表示從索引等於1中返回此列的最大值
    # out:[b, 10] => pred: [b]
    pred = out.argmax(dim=1)
    # 計算統計 pred 預測值和真實 label 相等的總數
    correct = pred.eq(y).sum().float().item()
    total_correct += correct

total_num = len(test_loader.dataset)
acc = total_correct / total_num
print('test acc: ', acc)
測試結果的準確性是:
test acc: 0.8378666666666666
讓人振奮的是,我們僅僅使用了三層的線性折積就能達到 83% 的準確性!!不過我們還需要看看,究竟是哪些圖片是這個網路結構所不能識別的,所以可以用圖的方式看看和預測值有啥不一樣~
# 隨機取一個 batch 資料,來進行預測
x, y = next(iter(test_loader))
out = net(x.view(x.size(0), 28 * 28))
pred = out.argmax(dim=1)
predict_plot_image(x, pred, 'test predict')

可以觀察到從20個圖片預測中,這裡就有兩個是預測錯誤的,對於非常規的寫法,比較潦草的手寫,此網路結構下的分類還是會出現錯誤的。我們可以考慮使用更高階的網路結構來處理識別,比如 CNN 、GNN 等等。
五、 程式碼
完整程式碼如下:
import torch
from torch import nn
from torch.nn import functional as F
from torch import optim
import torchvision
from matplotlib import pyplot as plt
from utils import plot_curve, plot_image, one_hot, predict_plot_image

# step 1 : load dataset
batch_size = 512
# https://blog.csdn.net/weixin_44211968/article/details/123739994
# DataLoader 和 dataset 資料集的應用
train_loader = torch.utils.data.DataLoader(
    torchvision.datasets.MNIST('./data', train=True, download=True,
                               transform=torchvision.transforms.Compose([
                                   torchvision.transforms.ToTensor(),
                                   torchvision.transforms.Normalize(
                                       (0.1307,), (0.3081,)
                                   )
                               ])),
    batch_size=batch_size, shuffle=True
)

test_loader = torch.utils.data.DataLoader(
    torchvision.datasets.MNIST('./data', train=True, download=True,
                               transform=torchvision.transforms.Compose([
                                   torchvision.transforms.ToTensor(),
                                   torchvision.transforms.Normalize(
                                       (0.1307,), (0.3081,)
                                   )
                               ])),
    batch_size=batch_size, shuffle=False
)

# 展示一個 batch 的圖片
x, y = next(iter(train_loader))
print(x.shape, y.shape, x.min(), x.max())
# torch.Size([512, 1, 28, 28]) torch.Size([512]) tensor(-0.4242) tensor(2.8215)
# 512張圖,1通道,28*28畫素,label大小512
plot_image(x, y, 'image sample')


# step 2 : 網路
class Net(nn.Module):
    def __init__(self):
        super(Net, self).__init__()

        # xw+b
        # 28*28 輸入, 256 第一層的輸出
        self.func1 = nn.Linear(28 * 28, 256)
        # 64 第二層輸出
        self.func2 = nn.Linear(256, 64)
        # 10 分類輸出 0~9
        self.func3 = nn.Linear(64, 10)

    def forward(self, x):
        x = F.relu(self.func1(x))
        x = F.relu(self.func2(x))
        x = self.func3(x)
        return x


net = Net()
# [w1, b1, w2, b2, w3, b3] 三個方程中需要優化的物件引數, lr - learning rate
optimazer = optim.SGD(net.parameters(), lr=0.005, momentum=0.9)
train_loss = []


# step 3 : 計算
for epoch in range(3):
    for batch_idx, (x, y) in enumerate(train_loader):
        # x: [b,  1, 28, 28], y: [512]
        # [b,  1, 28, 28] => [b, 784]
        x = x.view(-1, 28 * 28)
        # => [b, 0]
        out = net(x)
        # y_onehot 圖片label的向量
        y_onehot = one_hot(y)

        # loss函數方差
        # loss = mse(out, y_onehot)
        loss = F.mse_loss(out, y_onehot)

        # 清零梯度
        optimazer.zero_grad()
        # 計算梯度
        loss.backward()
        # 更新梯度
        optimazer.step()

        train_loss.append(loss.item())

        if batch_idx % 10 == 0:
            print(epoch, batch_idx, loss.item())

plot_curve(train_loss)


# step 4 : 準確度測試
total_correct = 0
for x, y in test_loader:
    x = x.view(x.size(0), 28 * 28)
    out = net(x)
    # argmax返回這個維度中間值最大的那個索引,dim=1 表示從索引等於1中返回此列的最大值
    # out:[b, 10] => pred: [b]
    pred = out.argmax(dim=1)
    # 計算統計 pred 預測值和真實 label 相等的總數
    correct = pred.eq(y).sum().float().item()
    total_correct += correct

total_num = len(test_loader.dataset)
acc = total_correct / total_num
print('test acc: ', acc)

# 隨機取一個 batch 資料,來進行預測
x, y = next(iter(test_loader))
out = net(x.view(x.size(0), 28 * 28))
pred = out.argmax(dim=1)
predict_plot_image(x, pred, 'test predict')
工具類方法 utils.py
import torch
from matplotlib import pyplot as plt


def plot_curve(data):
    fig = plt.figure()
    plt.plot(range(len(data)), data, color='blue')
    plt.legend(['value'], loc='upper right')
    plt.xlabel('step')
    plt.ylabel('value')
    plt.show()


# 識別圖片
def plot_image(img, lable, name):
    fig = plt.figure()
    for i in range(6):
        plt.subplot(2, 3, i + 1)
        plt.tight_layout()
        plt.imshow(img[i][0] * 0.3081 + 0.1307, cmap='gray', interpolation='none')
        plt.title("{}: {}".format(name, lable[i].item()))
        plt.xticks([])
        plt.yticks([])
    plt.show()


def predict_plot_image(img, lable, name):
    fig = plt.figure()
    for i in range(20):
        plt.subplot(4, 5, i + 1)
        plt.tight_layout()
        plt.imshow(img[i][0] * 0.3081 + 0.1307, cmap='gray', interpolation='none')
        plt.title("{}: {}".format(name, lable[i].item()))
        plt.xticks([])
        plt.yticks([])
    plt.show()

def one_hot(label, depth=10):
    out = torch.zeros(label.size(0), depth)
    idx = torch.LongTensor(label).view(-1, 1)
    out.scatter_(dim=1, index=idx, value=1)
    return out