百萬級視覺化開發進階筆記——element ui和echarts的引入
2021-05-17 13:00:02
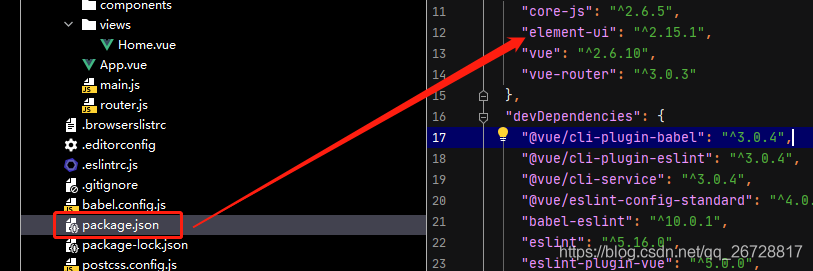
安裝element
element 官網:
https://element.eleme.cn/#/zh-CN/component/installation

npm i element-ui -S


修改main.js
import Vue from 'vue'
import ElementUI from 'element-ui'
import 'element-ui/lib/theme-chalk/index.css'
import App from './App.vue'
import router from './router'

Vue.config.productionTip = false
Vue.use(ElementUI)
new Vue({
  router,
  render: h => h(App)
}).$mount('#app')
home.vue
<template>
  <div class="home">
    <el-button>預設按鈕</el-button>
    <el-button type="primary">主要按鈕</el-button>
    <el-button type="success">成功按鈕</el-button>
    <el-button type="info">資訊按鈕</el-button>
    <el-button type="warning">警告按鈕</el-button>
    <el-button type="danger">危險按鈕</el-button>
  </div>
</template>

<script>
// @ is an alias to /src

export default {
  name: 'home'
}
</script>
執行一下

完全沒有問題,很簡單,部分安裝看官網
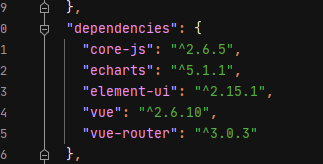
echarts安裝
https://echarts.apache.org/zh/tutorial.html#5%20%E5%88%86%E9%92%9F%E4%B8%8A%E6%89%8B%20ECharts


解決方法:
npm config rm proxy
npm config rm https-proxy


ok