微信小程式中如何引入echart圖表
2021-03-11 10:00:28

前不久,ECharts 團隊與微信小程式團隊合作公佈了 ECharts 微信小程式支援 Canvas 2D 的更新。
使用 Canvas 2D 可以使微信小程式環境中的 Canvas 與 W3C 標準 Canvas 介面更為接近,因而可以解決之前介面實現不一致引起的 bug。並且,Canvas 2D 的同層渲染可以解決圖表與其他原生元件覆蓋層級的問題。
簡單介紹下echarts:
商業級資料圖表,它是一個純JavaScript的圖示庫,相容絕大部分的瀏覽器,底層依賴輕量級的canvas類庫ZRender,提供直觀,生動,可互動,可高度個性化客製化的資料視覺化圖表。創新的拖拽重計算、資料檢視、值域漫遊等特性大大增強了使用者體驗,賦予了使用者對資料進行挖掘、整合的能力。
正文:
準備:小程式開發環境,下載ECharts元件,gitHub地址:https://github.com/ecomfe/echarts-for-weixin
操作過程:
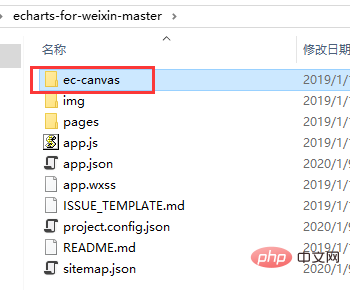
1、把ec-canvas拷貝到專案中(可以不是根目錄,但是後續參照的時候,注意更改檔案地址)

2、對應頁面json檔案引入元件
{
"usingComponents": {
    "ec-canvas": "../../ec-canvas/ec-canvas"
  }
}
(免費視訊教學:)
3、對應頁面js檔案
import * as echarts from '../../ec-canvas/echarts';
function initChart(canvas, width, height) {
  const chart = echarts.init(canvas, null, {
    width: width,
    height: height
  });
  canvas.setChart(chart);
  var option = {
    title: {
      text: '測試下面legend的紅色區域不應被裁剪',
      left: 'center'
    },
    color: ["#37A2DA", "#67E0E3", "#9FE6B8"],
    legend: {
      data: ['A', 'B', 'C'],
      top: 50,
      left: 'center',
      backgroundColor: 'red',
      z: 100
    },
    grid: {
      containLabel: true
    },
    tooltip: {
      show: true,
      trigger: 'axis'
    },
    xAxis: {
      type: 'category',
      boundaryGap: false,
      data: ['週一', '週二', '週三', '週四', '週五', '週六', '週日'],
      // show: false
    },
    yAxis: {
      x: 'center',
      type: 'value',
      splitLine: {
        lineStyle: {
          type: 'dashed'
        }
      }
      // show: false
    },
    series: [{
      name: 'A',
      type: 'line',
      smooth: true,
      data: [18, 36, 65, 30, 78, 40, 33]
    }, {
      name: 'B',
      type: 'line',
      smooth: true,
      data: [12, 50, 51, 35, 70, 30, 20]
    }, {
      name: 'C',
      type: 'line',
      smooth: true,
      data: [10, 30, 31, 50, 40, 20, 10]
}]
  };
  chart.setOption(option);
  return chart;
}
Page({
  data: {
    ec: {
      onInit: initChart
    }
  },
  onReady() {
  }
});
4、wxml檔案
<!--index.wxml-->
<view class="container">
  <ec-canvas id="mychart-dom-line" canvas-id="mychart-line" ec="{{ ec }}">
  </ec-canvas>
  </view>
5、頁面樣式
/**app.wxss**/
.container {
  position: absolute;
  top: 0;
  bottom: 0;
  left: 0;
  right: 0;
  display: flex;
  flex-direction: column;
  align-items: center;
  justify-content: space-between;
  box-sizing: border-box;
}
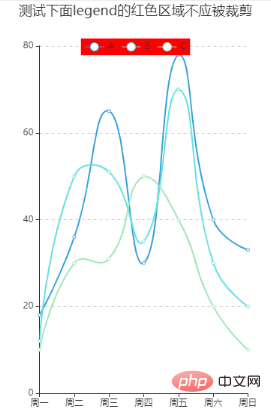
6、效果圖

相關推薦:
以上就是微信小程式中如何引入echart圖表的詳細內容,更多請關注TW511.COM其它相關文章!