Java如何在框架中顯示餅圖?
2019-10-16 22:27:04
在Java的GUI程式設計中,如何在框架中顯示餅圖?
以下範例顯示如何通過根據切片使Slices類和建立弧來顯示餅圖。
package com.yiibai;
import java.awt.Color;
import java.awt.Graphics;
import java.awt.Graphics2D;
import java.awt.Rectangle;
import javax.swing.JComponent;
import javax.swing.JFrame;
class Slice {
double value;
Color color;
public Slice(double value, Color color) {
this.value = value;
this.color = color;
}
}
class MyComponent2 extends JComponent {
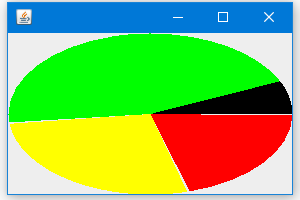
Slice[] slices = { new Slice(5, Color.black), new Slice(33, Color.green), new Slice(20, Color.yellow),
new Slice(15, Color.red) };
MyComponent2() {
}
public void paint(Graphics g) {
drawPie((Graphics2D) g, getBounds(), slices);
}
void drawPie(Graphics2D g, Rectangle area, Slice[] slices) {
double total = 0.0D;
for (int i = 0; i < slices.length; i++) {
total += slices[i].value;
}
double curValue = 0.0D;
int startAngle = 0;
for (int i = 0; i < slices.length; i++) {
startAngle = (int) (curValue * 360 / total);
int arcAngle = (int) (slices[i].value * 360 / total);
g.setColor(slices[i].color);
g.fillArc(area.x, area.y, area.width, area.height, startAngle, arcAngle);
curValue += slices[i].value;
}
}
}
public class DisplayPieChart {
public static void main(String[] argv) {
JFrame frame = new JFrame();
frame.getContentPane().add(new MyComponent2());
frame.setSize(300, 200);
frame.setVisible(true);
}
}
上述程式碼範例將產生以下結果。
範例-2
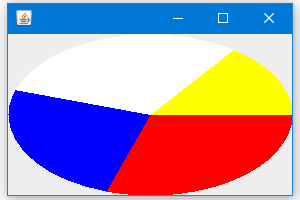
以下是在框架中顯示餅圖的另一個範例。
package com.yiibai;

import java.awt.Color;
import java.awt.Graphics;
import java.awt.Graphics2D;
import java.awt.Rectangle;
import javax.swing.JComponent;
import javax.swing.JFrame;

class Part2 {
    double value;
    Color color;

    public Part2(double value, Color color) {
        this.value = value;
        this.color = color;
    }
}

class MyComponent3 extends JComponent {
    Part2[] slices = { new Part2(15, Color.yellow), new Part2(30, Color.white), new Part2(25, Color.blue),
            new Part2(30, Color.red) };

    MyComponent3() {
    }

    public void paint(Graphics g) {
        drawPie((Graphics2D) g, getBounds(), slices);
    }

    void drawPie(Graphics2D g, Rectangle area, Part2[] slices) {
        double total = 0.0D;
        for (int i = 0; i < slices.length; i++) {
            total += slices[i].value;
        }
        double curValue = 0.0D;
        int startAngle = 0;
        for (int i = 0; i < slices.length; i++) {
            startAngle = (int) (curValue * 360 / total);
            int arcAngle = (int) (slices[i].value * 360 / total);

            g.setColor(slices[i].color);
            g.fillArc(area.x, area.y, area.width, area.height, startAngle, arcAngle);
            curValue += slices[i].value;
        }
    }
}

public class DisplayPieChart2 {
    public static void main(String[] argv) {
        JFrame frame = new JFrame();
        frame.getContentPane().add(new MyComponent3());
        frame.setSize(300, 200);
        frame.setVisible(true);
    }
}
上述程式碼範例將產生以下結果。