R語言基礎圖形繪製——箱線圖
2020-08-12 12:27:56
簡介
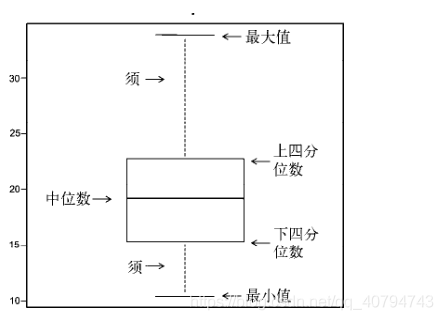
箱線圖主要是通過四分位數描述數據分佈,通過最大值,上四分位數,中位數,下四分位數,最小值五處位置描述數據分佈情況。箱線圖能夠顯示出可能爲離羣點(範圍±1.5*IQR以外的值,IQR表示四分位距,即上四分位數與下四分位數的差值)的觀測。
從箱線圖中,可以大致推斷出數據的集中或離散趨勢。
下圖清楚展示了箱線圖的組成部分。
1. 基礎函數—boxplot()
boxplot() 是一個泛型函數,目前支援兩種參數型別:公式和數據。
用法
## S3 method for class 'formula'
boxplot(formula, data = NULL, ..., subset, na.action = NULL,
        xlab = mklab(y_var = horizontal),
        ylab = mklab(y_var =!horizontal),
        add = FALSE, ann = !add, horizontal = FALSE,
        drop = FALSE, sep = ".", lex.order = FALSE)

## Default S3 method:
boxplot(x, ..., range = 1.5, width = NULL, varwidth = FALSE,
        notch = FALSE, outline = TRUE, names, plot = TRUE,
        border = par("fg"), col = NULL, log = "",
        pars = list(boxwex = 0.8, staplewex = 0.5, outwex = 0.5),
         ann = !add, horizontal = FALSE, add = FALSE, at = NULL)
- x 參數爲一個數值向量或者列表,若爲列表則對列表中每一個子物件依次作出箱線圖。
- formula 爲一個公式,比如 y ~ x。
- data 參數爲一個數據框或者列表。
- na.action 參數是對NA值的操作,預設爲忽略。
- ann 參數爲邏輯值,是否繪製座標軸。
- range 是一個延伸倍數,決定了箱線圖的须延伸到什麼位置。
- width 設定箱子的寬度。
- varwidth 爲邏輯值,若爲 TRUE,那麼箱子的寬度與樣本量的平方根成比例。
- notch 決定了是否在箱子上畫凹槽,可以用於比較兩組數據的中位數是否有差異。
- horizontal 是否水平放置箱線圖。
- add 參數設定是否將箱線圖新增到現有圖形上。
- at 參數,當add爲TRUE時,設定箱線圖位置。
範例
數據形式傳入參數
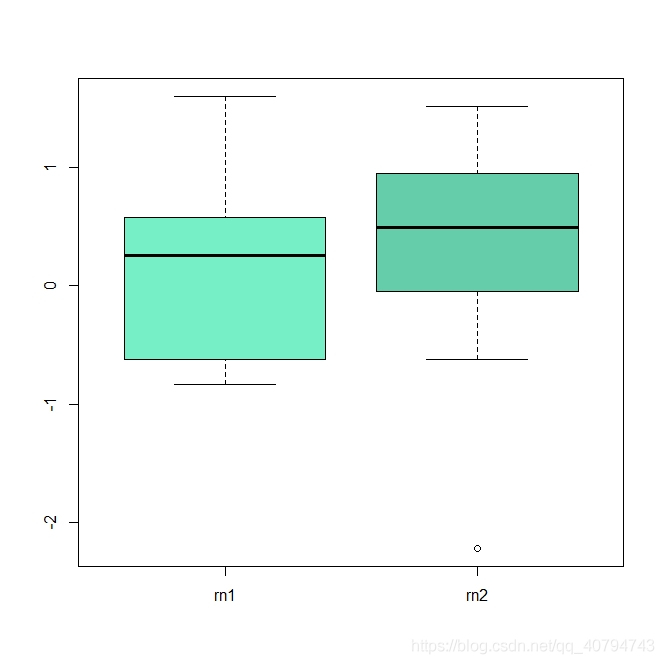
set.seed(1)
boxplot(rnorm(10),rnorm(10),names = c("rn1","rn2"),col = colors()[10:11])
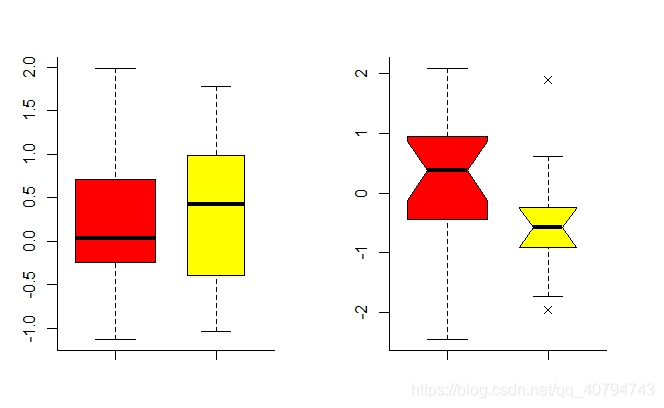
這兩個圖不多贅述了,分別使用了varwidth 參數和notch 參數。
set.seed(2)
op <- par(no.readonly=TRUE)
par(bty = "l",mar = rep(3,4),mfrow = c(1,2))
boxplot(rnorm(10),rnorm(5), col = rgb(1,seq(0,1,length.out = 2),0),
          pch = 4,lwd = 1.5,varwidth = T)
boxplot(rnorm(20),rnorm(10), col = rgb(1,seq(0,1,length.out = 2),0),
        pch = 4,lwd = 1.5,varwidth = T,notch = T)
par(op)
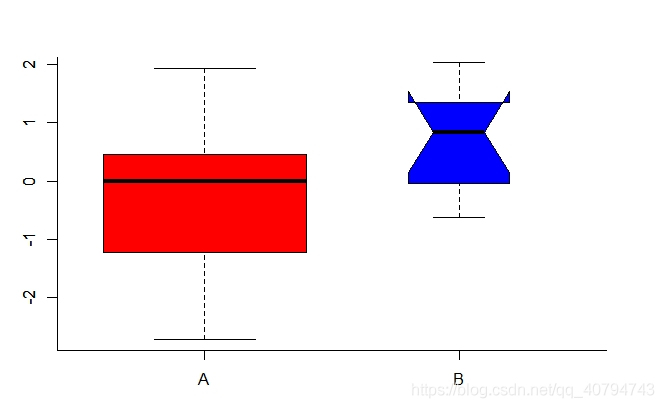
一個常規箱線圖,一個帶凹槽?簡單兩句命令即可實現。
op <- par(no.readonly=TRUE)
par(bty = "l")
boxplot(rnorm(10),NULL, names = c("A","B"),col = "red",pch = 4,lwd = 1.5,at = c(1,2))
boxplot(rnorm(10),col = "blue",lwd = 1.5,notch = T,add = T,at = 2)
par(op)
這裏使用datasets基礎包中的InsectSprays數據集(不同殺蟲劑處理的農業試驗單位昆蟲數量)演示。
# 簡單檢視數據集
head(InsectSprays)
#    count spray
# 1    10     A
# 2     7     A
# 3    20     A
# 4    14     A
# 5    14     A
# 6    12     A
dim(InsectSprays)
# [1] 72  2
summary(InsectSprays)
#   count       spray
# Min.   : 0.00   A:12
# 1st Qu.: 3.00   B:12
# Median : 7.00   C:12
# Mean   : 9.50   D:12
# 3rd Qu.:14.25   E:12
# Max.   :26.00   F:12
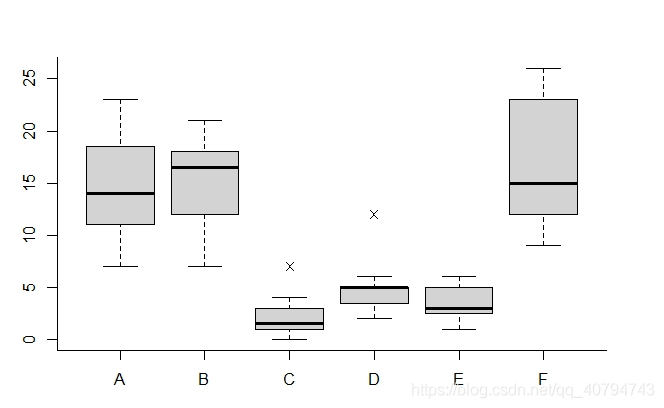
公式傳入數據,經典座標軸繪製箱線圖,並將離羣點樣式更改爲「4」。
op <- par(no.readonly=TRUE)
par(bty = "l",mar = rep(3,4))
boxplot(count ~ spray, data = InsectSprays,
        col = "lightgray", pch = 4)
par(op)
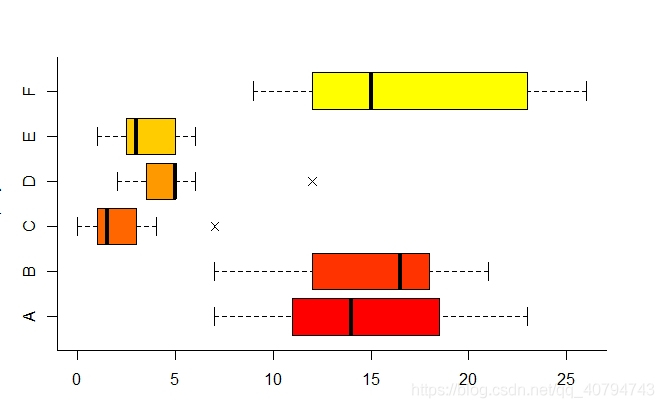
箱線圖水平放置並上色。
op <- par(no.readonly=TRUE)
par(bty = "l",mar = rep(3,4))
boxplot(count ~ spray, data = InsectSprays,
        horizontal = T, col = rgb(1,seq(0,1,length.out = 6),0), pch = 4,
        lwd = 1.5)
par(op)
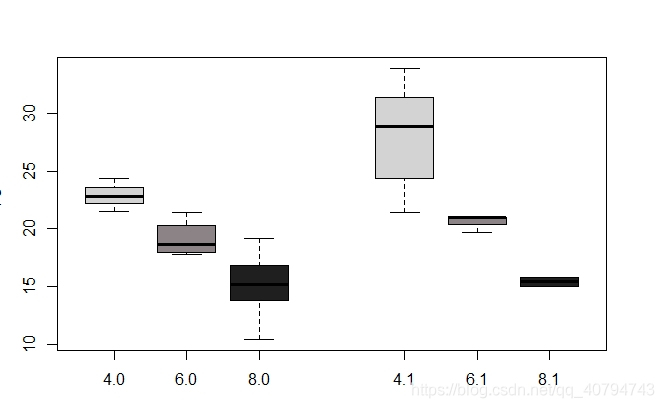
以衆所周知的mtcars數據集作爲分組箱線圖範例。使用at參數區分兩組數據。
library(magrittr)
library(tidyverse)
set.seed(3)
op <- par(no.readonly=TRUE)
par(mar = rep(3,4))
col <- sample(colors(),3)
mtcars %>% {boxplot(mpg ~ cyl + am,.,at = c(1:3,5:7),col = col)}
par(op)
基礎函數繪製箱線圖到此爲止,基本上能滿足大家的需求。不過不得不吐槽,基礎函數還是不及ggplot。好了,接下來使用ggplot函數繪製箱線圖。
2. ggplot()函數
直接上圖吧,相關繪圖函數大家通過範例去學習。
library(ggplot2)
library(patchwork)
library(RColorBrewer)
InsectSprays %>% {
  p <- ggplot(.,mapping = aes(spray,count))
  p1 <- p + geom_boxplot(outlier.shape = 21,outlier.colour = "red",outlier.fill = "blue",
                         col = "black",fill = brewer.pal(6,"Set1"))
  p2 <- p + stat_boxplot(geom = "errorbar",width=0.3)+
            geom_boxplot(outlier.shape = 21,outlier.colour = "red",outlier.fill = "blue",
                         col = "black",fill = brewer.pal(6,"Set1"))
  p1+p2
}
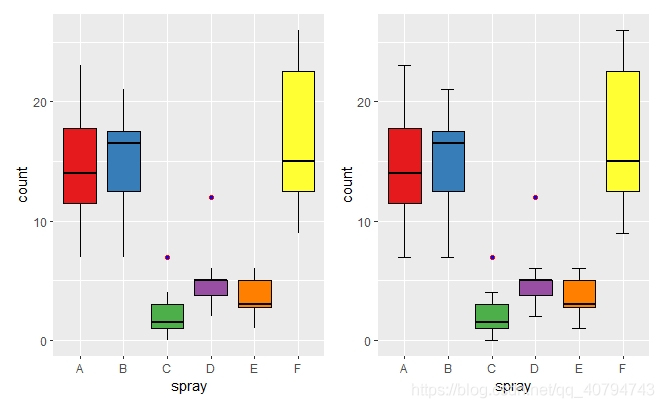
效果還不錯吧。對比一下,實現你的不同繪圖需求。
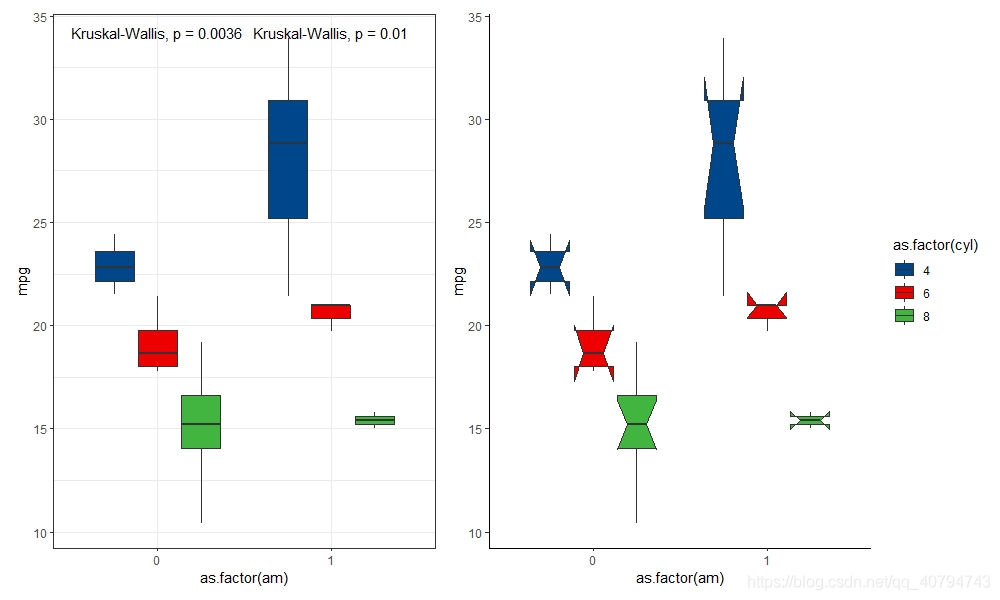
接下來,利用ggplot實現分組箱線圖,並通過ggpubr包的相關函數爲組內新增顯著性標記。當然,也可以自定義分組。
library(ggplot2)
library(patchwork)
library(RColorBrewer)
library(ggsci)
library(ggpubr)
mtcars %>% {
  p <- ggplot(.,mapping = aes(as.factor(am),mpg,fill = as.factor(cyl)))
  p1 <- p + geom_boxplot()+
            stat_compare_means()+
            scale_fill_lancet()+
            theme_bw()+
            theme(legend.position = "none")
  p2 <- p + geom_boxplot(notch = T)+
            scale_fill_lancet()+
            theme_classic()
  p1 + p2
}
介紹了這麼多,相信大家肯定有所收穫噢。支援一下作者吧! 歡迎大家留言討論。
##侵權請聯繫作者刪除!