【matplotlib基礎】--圖例
2023-09-07 15:01:08
Matplotlib 中的圖例是幫助觀察者理解影象資料的重要工具。
圖例通常包含在影象中,用於解釋不同的顏色、形狀、標籤和其他元素。
1. 主要引數
當不設定圖例的引數時,預設的圖例是這樣的。
import numpy as np
import matplotlib.pyplot as plt

x = np.linspace(0, 10, 100)
y1 = np.sin(x)
y2 = np.cos(x)

fig = plt.figure()
ax = fig.add_axes([0.1, 0.1, 0.8, 0.8])
ax.plot(x, y1, label="sin")
ax.plot(x, y2, label="cos")
ax.legend()
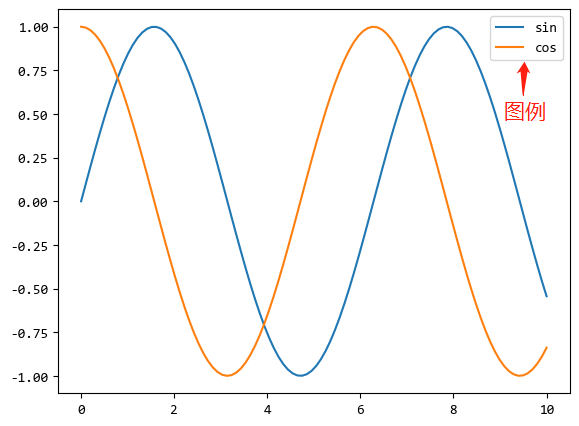
圖例就是右上角的那個部分。
圖例的主要引數,其實也就是上例 ax.lengend() 函數的主要引數:
- 圖例位置相關:
loc(位置字串) - 邊框相關:facecolor(背景色),edgecolor(邊框顏色),shadow(是否設定陰影)framemon(是否有邊框和背景)
- 圖例的列數:預設是1列多行的格式,ncol(列的個數)
2. 設定範例
通過範例來演示常用的設定。
2.1. 圖例位置
fig, ax = plt.subplots(3, 3)
fig.set_size_inches(10, 10)

locations = [
    ["lower left", "lower center", "lower right"],
    ["center left", "center", "center right"],
    ["upper left", "upper center", "upper right"],
]
for i in range(3):
    for j in range(3):
        ax[i, j].plot(x, y1, label="sin")
        ax[i, j].plot(x, y2, label="cos")
        ax[i, j].legend(loc=locations[i][j])
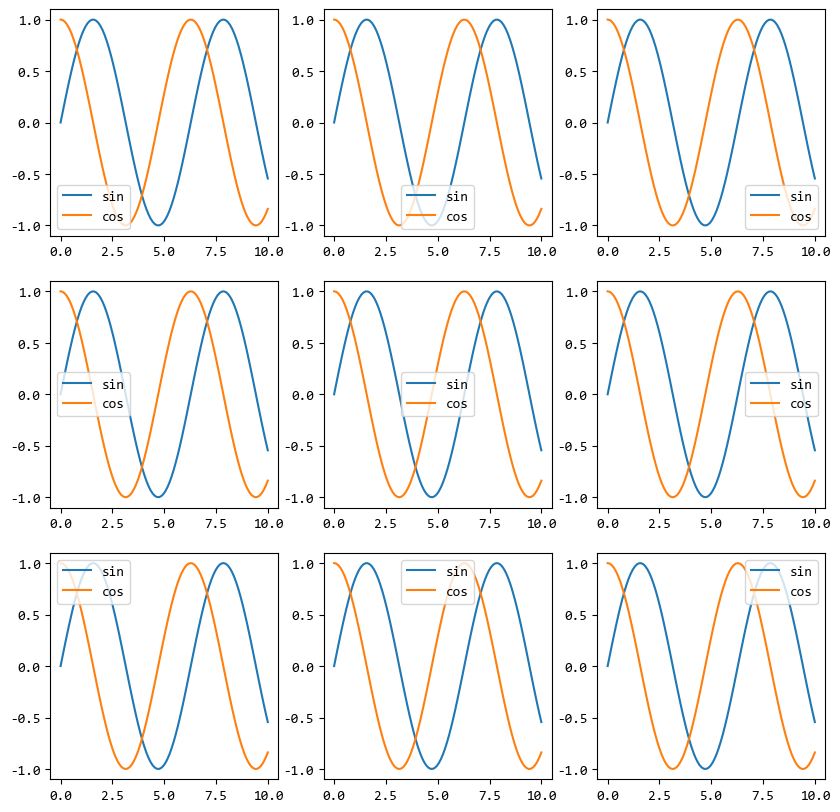
上面的範例顯示了不同位置的圖例。
2.2. 圖例邊框
邊框可以設定邊框的背景色,邊框顏色和是否有陰影。
fig = plt.figure()
ax = fig.add_axes([0.1, 0.1, 0.8, 0.8])
ax.plot(x, y1, label="sin")
ax.plot(x, y2, label="cos")
ax.legend(facecolor="lightblue", edgecolor="red", shadow=True)
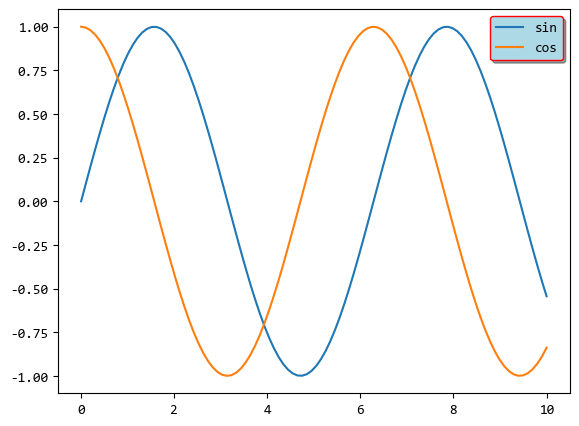
上例中,背景色 lightblue,邊框 red,陰影設定為 True。
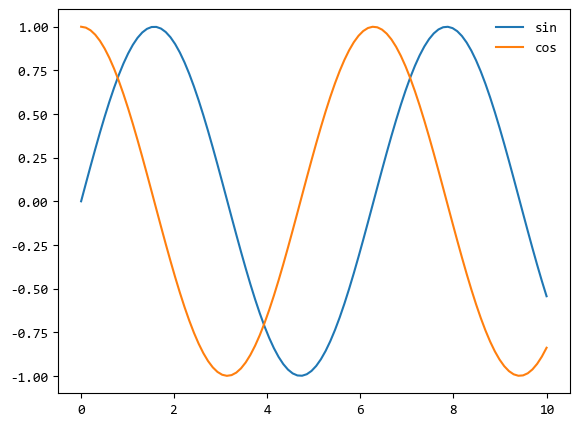
設定無邊框比較簡單,frameon=False 即可。
fig = plt.figure()
ax = fig.add_axes([0.1, 0.1, 0.8, 0.8])
ax.plot(x, y1, label="sin")
ax.plot(x, y2, label="cos")
ax.legend(frameon=False)
2.3. 圖例分列
圖例預設都是一列多行的格式,比如上面的的各個範例,圖例都是依次豎著排列下來的。
可以通過 ncol 屬性,讓圖例橫著排列。
fig = plt.figure()
ax = fig.add_axes([0.1, 0.1, 0.8, 0.8])
ax.plot(x, y1, label="sin")
ax.plot(x, y2, label="cos")
ax.legend(frameon=False, loc="upper center", ncol=2)
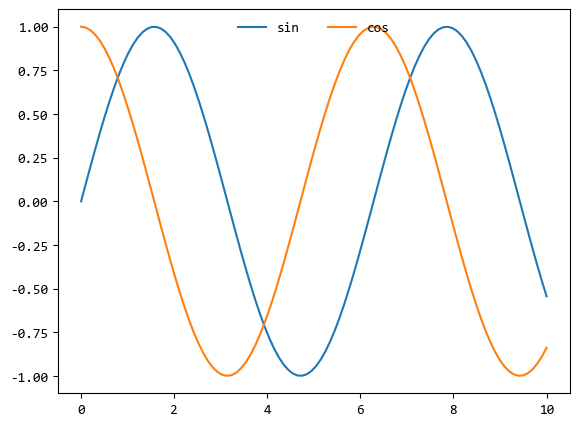
上面的範例,圖例(legend)設定為兩列,位於上方中間位置。
2.4. 多個圖例
一般的圖形都只有一個圖例,比如上面的都是這樣的,sin和cos都在一個圖例中。
如果圖例太多,或者多個圖例之間關係不大,也可以建立多個圖例。
from matplotlib.legend import Legend

x = np.linspace(0, 10, 100)
y1 = np.sin(x)
y2 = np.cos(x)
y3 = np.sin(x + 1)
y4 = np.cos(x + 1)

fig = plt.figure()
ax = fig.add_axes([0.1, 0.1, 0.8, 0.8])
legends = []
legends += ax.plot(x, y1, label="sin1")
legends += ax.plot(x, y2, label="cos1")
legends += ax.plot(x, y3, label="sin2")
legends += ax.plot(x, y4, label="cos2")
ax.legend(legends[:2], ["sin1", "cos1"], loc="upper right")

leg = Legend(ax, legends[2:], ["sin2", "cos2"], loc="lower left")
ax.add_artist(leg)
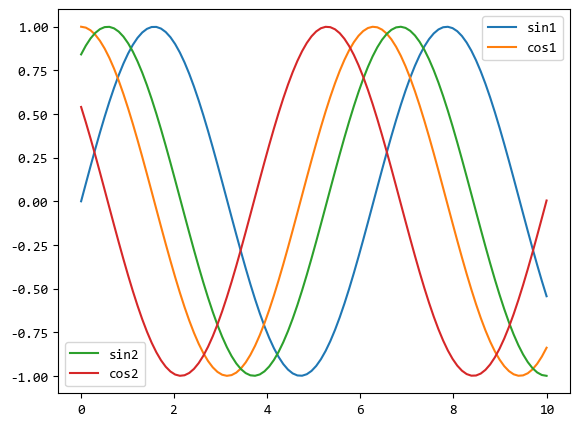
上面的範例中的4個曲線,分成了2個圖例來說明。
一個圖例在右上角,一個圖例在左下角。
2.5. 圖例中不同大小的點
最後,介紹一種更復雜的圖例顯示方式。
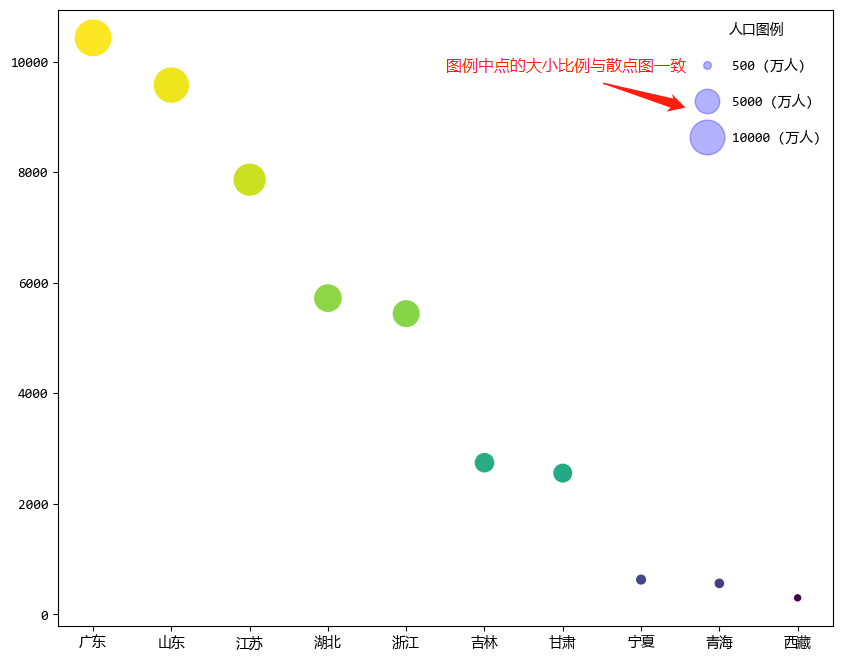
首先生成主要幾個省市的人口散點圖(資料是網路上搜尋的),
生成圖例的時候,給3個主要的節點500萬人,5000萬人,1億人設定的點的大小比例與圖中的各個散點資料保持一致。
x = ["廣東", "山東", "江蘇",
     "湖北", "浙江", "吉林",
     "甘肅", "寧夏", "青海", "西藏"]
y = np.array([10432, 9578, 7866,
              5723, 5442, 2745,
              2557, 630, 562, 300])

fig = plt.figure(figsize=[10, 8])
plt.scatter(x, y, c=np.log10(y), s=y/16)

#建立圖例
for population in [500, 5000, 10000]:
    plt.scatter([],[], c='b',
                s=population/16,
                alpha=0.3,
                label=str(population)+" (萬人)")

plt.legend(scatterpoints=1,
           labelspacing=1.5,
           title="人口圖例",
           frameon=False)
3. 總結
圖例可以設定成各式各樣,本篇介紹的圖例設定方式並不是僅僅為了美觀,
更重要的是利用這些設定方式幫助使用者能夠達成以下目的:
- 幫助觀察者快速瞭解影象資料:圖例提供了關於影象資料的簡潔、易於理解的解釋,使得觀察者能夠快速瞭解影象的主題和內容。
- 幫助觀察者更好地理解影象細節:在一些複雜的影象中,觀察者可能需要花費很多時間才能理解其中的細節。圖例可以提供關於影象細節的額外資訊,使得觀察者能夠更好地理解影象。
- 幫助觀察者發現影象中的異常或者重要資訊:圖例可以用於指出影象中的異常或者重要資訊,幫助觀察者更好地理解和分析影象。