【matplotlib基礎】--刻度
2023-09-05 12:02:09
Matplotlib中刻度是用於在繪圖中表示資料大小的工具。
刻度是座標軸上的數位或標籤,用於指示資料的大小或值,
通常以整數或小數表示,具體取決於座標軸的型別和限制。
1. 主次刻度
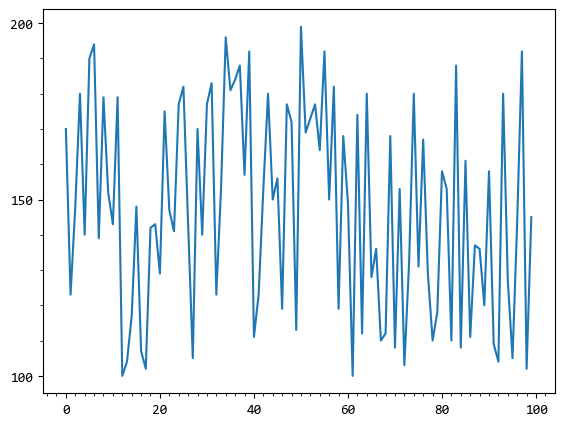
預設的繪製時,座標軸只有預設的主要刻度,如下所示:
from matplotlib.ticker import MultipleLocator

x = np.array(range(0, 100))
y = np.random.randint(100, 200, 100)

fig = plt.figure()
ax = fig.add_axes([0.1, 0.1, 0.8, 0.8])
#X軸的主要和次要刻度
ax.xaxis.set_major_locator(MultipleLocator(20))
ax.xaxis.set_minor_locator(MultipleLocator(2))

#Y軸的主要和次要刻度
ax.yaxis.set_major_locator(MultipleLocator(50))
ax.yaxis.set_minor_locator(MultipleLocator(10))

ax.plot(x, y)
上面的範例中,
設定了X軸的主要刻度間隔20,次要刻度間隔2,也就是每2個主要刻度之間有10個次要刻度。
設定了Y軸的主要刻度間隔50,次要刻度間隔10,也就是每2個主要刻度之間有5個次要刻度。
次要刻度就是上面圖中主要刻度之間稍短點的線。
2. 刻度樣式
刻度的樣式非常靈活,常見的有以下幾種設定。
2.1. 隱藏刻度
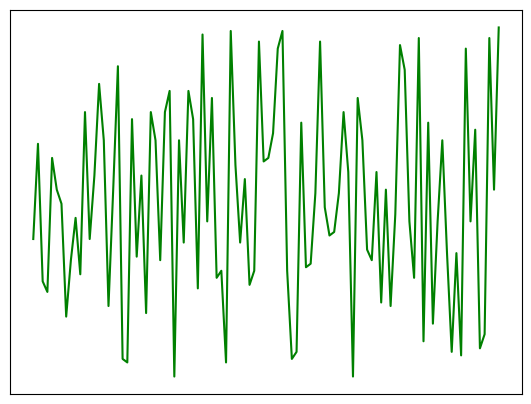
隱藏刻度,只保留圖形,這在做某些示意圖的時候可能會用到。
x = np.array(range(0, 100))
y = np.random.randint(100, 200, 100)

fig = plt.figure()
ax = fig.add_axes([0.1, 0.1, 0.8, 0.8])

#隱藏刻度
ax.xaxis.set_major_locator(plt.NullLocator())
ax.yaxis.set_major_locator(plt.NullLocator())

ax.plot(x, y, color='g')
2.2. 密度
密度是指刻度的間隔,如果圖比較小,可以設定間隔大一些,反之則設定小一些。
from matplotlib.ticker import MultipleLocator

x = np.array(range(0, 100))
y = np.random.randint(100, 200, 100)

rows, cols = 2, 2
grid = plt.GridSpec(rows, cols)

ax = plt.subplot(grid[0, 0])
ax.plot(x, y)
ax.xaxis.set_major_locator(MultipleLocator(20))
ax.yaxis.set_major_locator(MultipleLocator(50))


ax = plt.subplot(grid[1, :])
ax.plot(x, y)
ax.xaxis.set_major_locator(MultipleLocator(10))
ax.yaxis.set_major_locator(MultipleLocator(20))
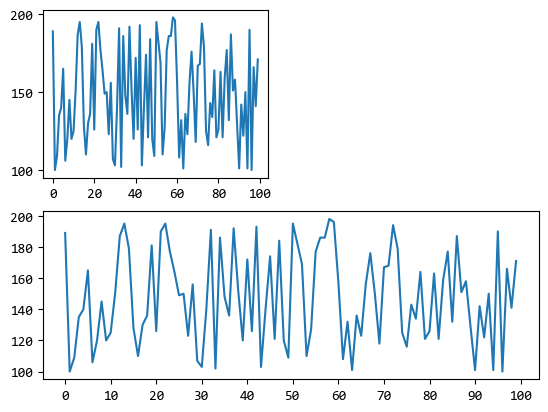
上例中,根據圖形的大小,我們設定了刻度的不同密度。
2.3. 顏色,大小,旋轉
為了突出某些刻度值,有時候會需要修改那些刻度值的顏色和大小。
x = np.array(range(0, 100))
y = np.random.randint(100, 200, 100)

fig = plt.figure()
ax = fig.add_axes([0.1, 0.1, 0.8, 0.8])
ax.xaxis.set_major_locator(MultipleLocator(10))

obj = ax.get_xticklabels()[2]
obj.set_size(20)
obj.set_color("red")

ax.plot(x, y, color='g')
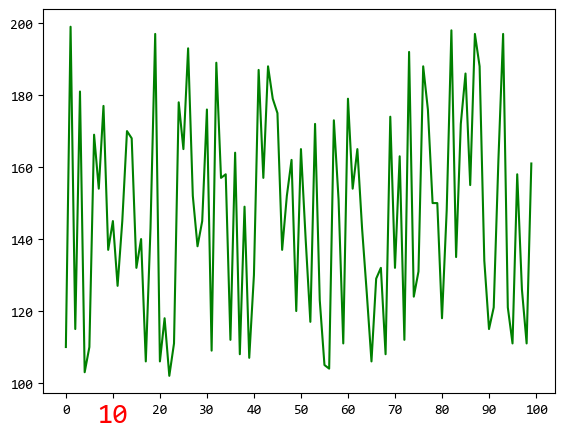
上面範例中,X軸刻度10被放大並且改成了紅色。
刻度的旋轉一般用在刻度內容比較長的情況,比如下面的範例:
x = np.array(
    [
        "2022-01-01",
        "2022-02-01",
        "2022-03-01",
        "2022-04-01",
        "2022-05-01",
        "2022-06-01",
        "2022-07-01",
        "2022-08-01",
        "2022-09-01",
        "2022-10-01",
    ]
)
y = np.random.randint(100, 200, 10)

fig = plt.figure()
ax = fig.add_axes([0.1, 0.1, 0.8, 0.8])

ax.plot(x, y, color="g")
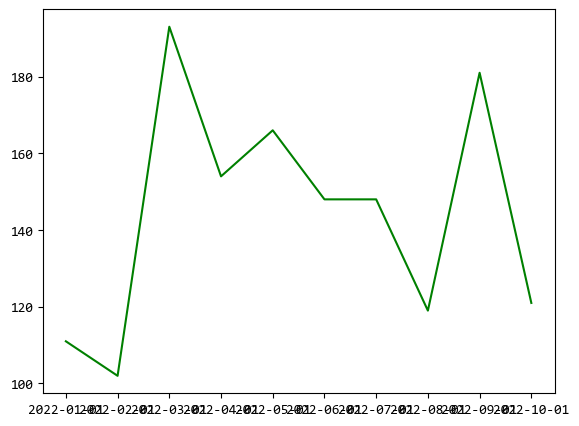
由於X軸的刻度是日期,因為太長,所以會擠在一起,顯示不清。
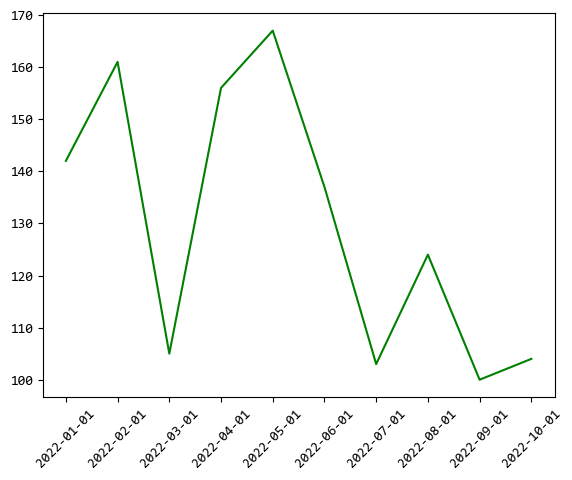
這時可以調整X軸刻度的角度,避免重合在一起。
x = np.array(
    [
        "2022-01-01",
        "2022-02-01",
        "2022-03-01",
        "2022-04-01",
        "2022-05-01",
        "2022-06-01",
        "2022-07-01",
        "2022-08-01",
        "2022-09-01",
        "2022-10-01",
    ]
)
y = np.random.randint(100, 200, 10)

fig = plt.figure()
ax = fig.add_axes([0.1, 0.1, 0.8, 0.8])
plt.xticks(rotation=45) # 旋轉45度

ax.plot(x, y, color="g")
2.4. latex格式
Matplotlib的刻度還支援latex格式,可以顯示一些特殊的字元,比如圓周率π。
直接顯示時:
x = np.array([0, np.pi / 6, np.pi / 4, np.pi/3, np.pi / 2])
x = np.round(x, 2)
y = np.sin(x)

fig = plt.figure()
ax = fig.add_axes([0.1, 0.1, 0.8, 0.8])
plt.xticks(labels=x, ticks=x)
ax.plot(x, y)
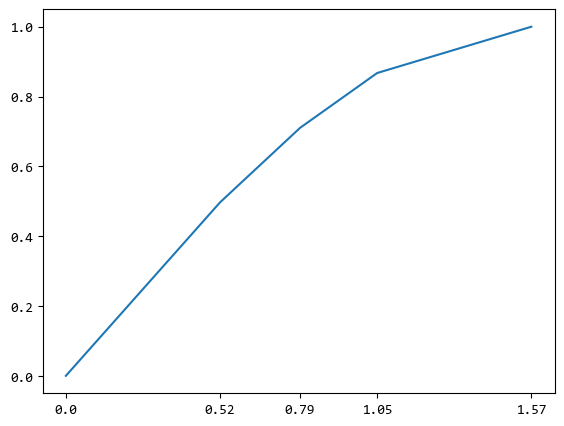
X軸的刻度顯示實際的值。
調整為 latex 格式來顯示:(調整 plt.xticks() 這個函數)
plt.xticks(labels=[
    "0", "$\pi/6$", "$\pi/4$", "$\pi/3$", "$\pi/2$"
], ticks=x)
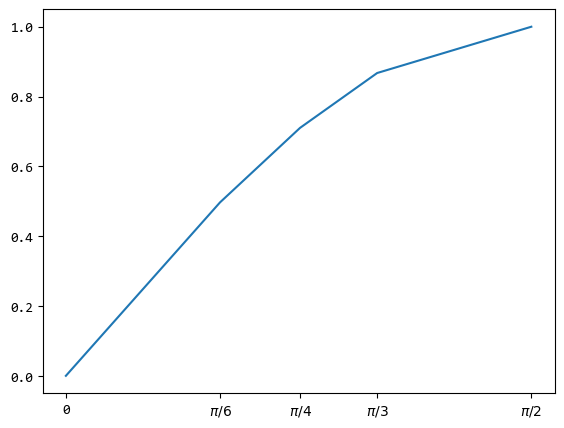
X軸的刻度中顯示圓周率π,更易於閱讀和理解。
3. 總結回顧
與之前介紹的畫布,子圖和座標軸相比,刻度是設定最多也是最複雜的一個容器。
刻度的主要作用是幫助資料視覺化更加清晰和易於理解,基於此,本篇主要介紹了:
- 主次刻度
- 刻度樣式,包括是否顯示刻度,刻度的密度,顏色,大小,角度以及
latex公式的支援。