【matplotlib基礎】--座標軸
2023-09-03 12:00:57
Matplotlib的座標軸是用於在繪圖中表示資料的位置的工具。
座標軸是影象中的水平和垂直線,它們通常表示為 x 軸和 y 軸。
座標軸的作用是幫助觀察者瞭解影象中資料的位置和大小,通常標有數位或標籤,以指示特定的值在影象中的位置。
1. 座標軸範圍
Matplotlib繪製圖形時,會自動根據X,Y軸的數值,自動確定其範圍,確保能夠涵蓋所有的數值。
比如:
_, ax = plt.subplots(2, 1)

#X軸範圍0~8,Y軸範圍1~100
x = np.array(range(0, 8))
y = np.random.randint(1, 100, 8)
ax[0].plot(x, y)

#X軸範圍10~18,Y軸範圍100~200
x = np.array(range(10, 18))
y = np.random.randint(100, 200, 8)
ax[1].plot(x, y)
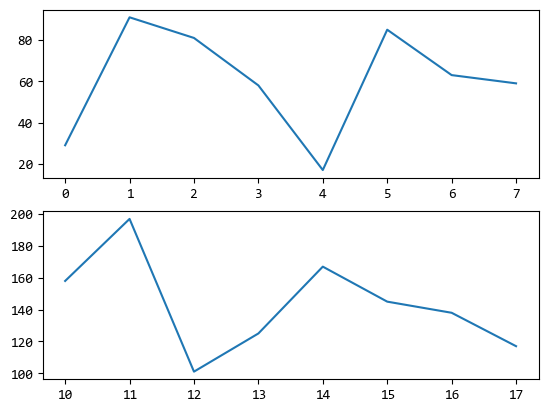
可以看出,圖形中X軸,Y軸的範圍是根據 x, y列表中數值的最大最小值來生成的。
有時候,為了看圖的區域性位置,可以主動設定X軸,Y軸的範圍,而不是依靠自動生成。
比如:
_, ax = plt.subplots(2, 1)
x = np.array(range(0, 8))
y = np.random.randint(1, 100, 8)
ax[0].set_xlim(3, 6) #X軸範圍3~6
ax[0].plot(x, y)

x = np.array(range(10, 18))
y = np.random.randint(100, 200, 8)
ax[1].set_ylim(120, 150) #Y軸範圍120~150
ax[1].plot(x, y)
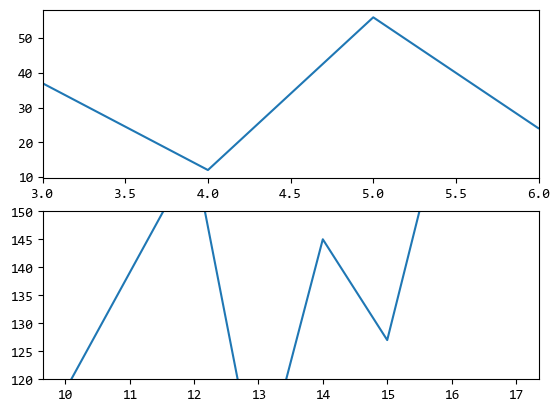
上面的範例設定的第一個圖的X軸範圍,第二個圖的Y軸範圍。
2. 雙座標軸
如果要把Y軸不同範圍的兩個曲線放在一起比較趨勢的話,就要用到雙座標軸。
比如:
fig = plt.figure()
ax = fig.add_axes([0.1, 0.1, 0.8, 0.8])
x = np.array(range(0, 8))

y1 = np.random.randint(1, 100, 8)
ax.plot(x, y1, c='r')

y2 = np.random.randint(100, 200, 8)
ax.plot(x, y2, c='g')
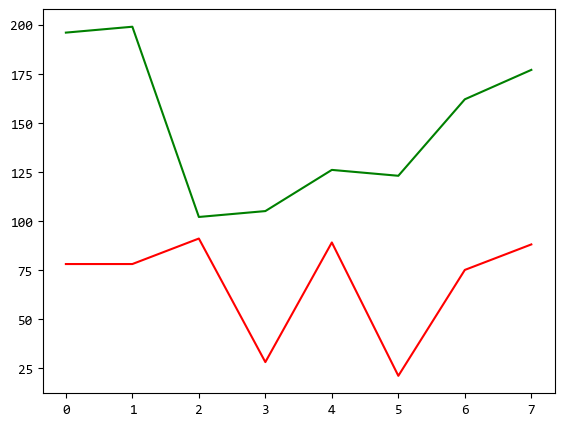
上圖中紅色的線範圍在1~100之間,綠色的線範圍在100~200之間。
雖然放在一個圖中比較,看著卻像是在兩個子圖。
這時,我們可以用兩個不同範圍的Y軸,從而能夠讓兩條曲線更好的比較。
比如:
fig = plt.figure()
ax = fig.add_axes([0.1, 0.1, 0.8, 0.8])
ax_twinx = ax.twinx()
x = np.array(range(0, 8))

y1 = np.random.randint(1, 100, 8)
ax.plot(x, y1, c='r')

y2 = np.random.randint(100, 200, 8)
ax_twinx.plot(x, y2, c='g')
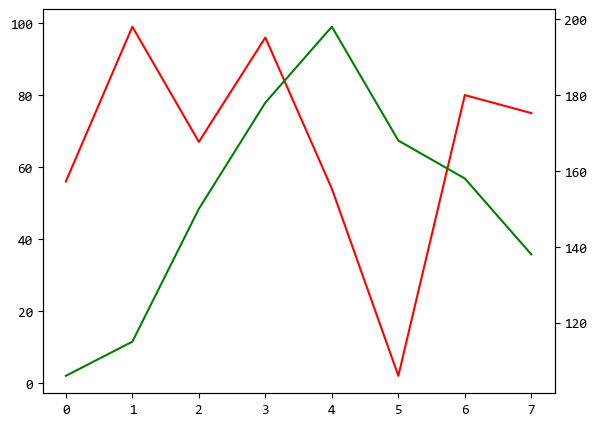
左邊是紅線對應的Y軸,右邊是綠線對應的Y軸。
3. 反座標軸
最後,關於座標軸的設定,還有一個比較常用的設定是反轉座標軸。
座標軸的預設順序是從小到大的,但是,對於一些特殊的圖表型別(如散點圖、條形圖、直方圖等),可以通過反轉座標軸來更好地展示資料點的分佈情況。
3.1. 反轉X軸
fig = plt.figure()

x = np.array(range(0, 8))
y = np.random.randint(1, 100, 8)

ax1 = fig.add_subplot(211)
ax1.plot(x, y)

#反轉X軸
ax2 = fig.add_subplot(212)
ax2.invert_xaxis()
ax2.plot(x, y)
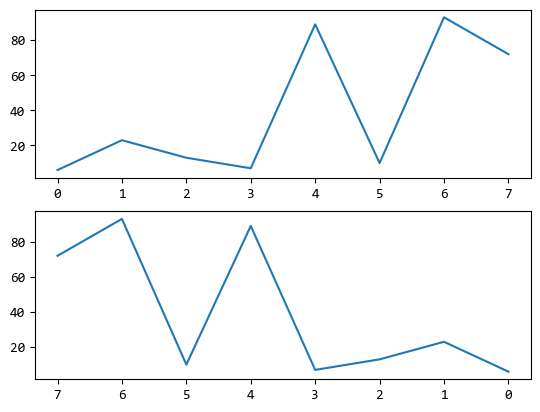
上例兩個子圖的X軸順序是相反的。
3.2. 反轉Y軸
fig = plt.figure()

x = np.array(range(0, 8))
y = np.random.randint(1, 100, 8)

ax1 = fig.add_subplot(211)
ax1.plot(x, y)

#反轉Y軸
ax2 = fig.add_subplot(212)
ax2.invert_yaxis()
ax2.plot(x, y)
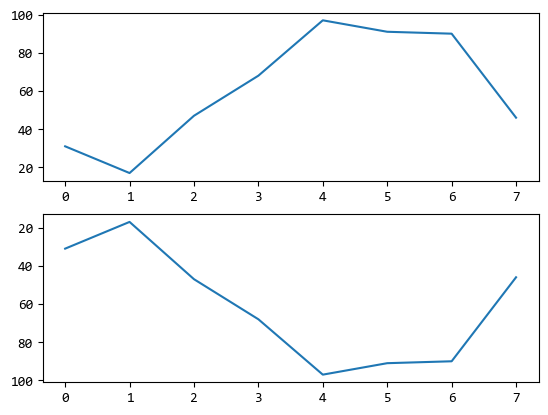
上例兩個子圖的Y軸順序是相反的。
4. 總結回顧
這裡介紹的主要是座標軸在展示分析結果的不同場景中的常用設定方法,
其他關於座標軸字型,顏色等等可以查閱官方檔案。