[資料分析與視覺化] 基於matplotlib和plottable庫繪製精美表格
plottable是一個Python庫,用於在matplotlib中繪製精美客製化的圖形表格。plottable的官方倉庫地址為:plottable。本文主要參考其官方檔案,plottable的官方檔案地址為:plottable-doc。plottable安裝命令如下:
pip install plottable
本文所有程式碼見:Python-Study-Notes
# jupyter notebook環境去除warning
import warnings
warnings.filterwarnings("ignore")
import plottable
# 列印plottable版本
print('plottable version:', plottable.__version__)
# 列印matplotlib版本
import matplotlib as plt
print('matplotlib version:', plt.__version__)
plottable version: 0.1.5
matplotlib version: 3.5.3
1 使用說明
1.1 基礎使用
下面的程式碼展示了一個簡單的圖形表格繪製範例,plottable提供了Table類以建立和展示圖形表格。
import matplotlib.pyplot as plt
import numpy as np
import pandas as pd

from plottable import Table

# 生成一個包含亂資料的表格
d = pd.DataFrame(np.random.random((5, 5)), columns=["A", "B", "C", "D", "E"]).round(2)
fig, ax = plt.subplots(figsize=(6, 5))
# 基於pandas表格資料建立和展示圖形表格
tab = Table(d)

# 儲存圖片
plt.savefig("table.jpg", dpi=300,bbox_inches='tight')
plt.show()
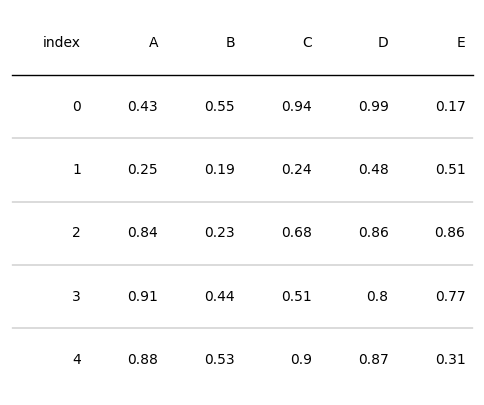
對於plottable的Table類,其構造引數介紹如下:
- df: pd.DataFrame, 要顯示為表格的DataFrame物件
- ax: mpl.axes.Axes, 繪製表格的座標軸物件,預設為None
- index_col: str, DataFrame中的索引列名。預設為None
- columns: List[str], 哪些列用於繪圖。為None表示使用所有列
- column_definitions: List[ColumnDefinition], 需要設定樣式列的style定義類,預設為None
- textprops: Dict[str, Any], 文字屬性的字典,預設為空字典
- cell_kw: Dict[str, Any], 單元格屬性的字典,預設為空字典
- col_label_cell_kw: Dict[str, Any], 列標籤單元格屬性的字典,預設為空字典
- col_label_divider: bool, 是否在列標籤下方繪製分隔線,預設為True。
- footer_divider: bool, 是否在表格下方繪製分隔線,預設為False。
- row_dividers: bool, 是否顯示行分隔線,預設為True
- row_divider_kw: Dict[str, Any], 行分隔線屬性的字典,預設為空字典
- col_label_divider_kw: Dict[str, Any], 列標籤分隔線屬性的字典,預設為空字典
- footer_divider_kw: Dict[str, Any], 頁尾分隔線屬性的字典,預設為空字典
- column_border_kw: Dict[str, Any], 列邊框屬性的字典,預設為空字典
- even_row_color: str | Tuple, 偶數行單元格的填充顏色,預設為None
- odd_row_color: str | Tuple, 奇數行單元格的填充顏色,預設為None
在這些引數之中,控制表格繪圖效果的引數有以下幾類:
- column_definitions:列的樣式自定義
- textprops:文字的樣樣式自定義
- cell_kw:表格單元格的樣式自定義
- 其他設定引數的樣式
在這些引數中,最重要的引數是column_definitions,因為column_definitions可以控制幾乎所有的繪圖效果。接下來本文主要對column_definitions的使用進行具體介紹。
1.2 列的樣式自定義
plottable提供了ColumnDefinition類(別名ColDef)來自定義圖形表格的單個列的樣式。ColumnDefinition類的構造引數如下:
- name: str,要設定繪圖效果的列名
- title: str = None,用於覆蓋列名的繪圖示題
- width: float = 1,列的寬度,預設情況下各列的寬度為軸的寬度/列的總數
- textprops: Dict[str, Any] = field(default_factory=dict),提供給每個文字單元格的文字屬性
- formatter: Callable = None,用於格式化文字外觀的可呼叫函數
- cmap: Callable = None,根據單元格的值返回顏色的可呼叫函數
- text_cmap: Callable = None,根據單元格的值返回顏色的可呼叫函數
- group: str = None,設定每個組都會在列標籤上方顯示的分組列標籤
- plot_fn: Callable = None,一個可呼叫函數,將單元格的值作為輸入,並在每個單元格上建立一個子圖並繪製在其上
要向其傳遞其他引數 - plot_kw: Dict[str, Any] = field(default_factory=dict),提供給plot_fn的附加關鍵字引數
- border: str | List = None,繪製垂直邊界線,可以是"left" / "l"、"right" / "r"或"both"
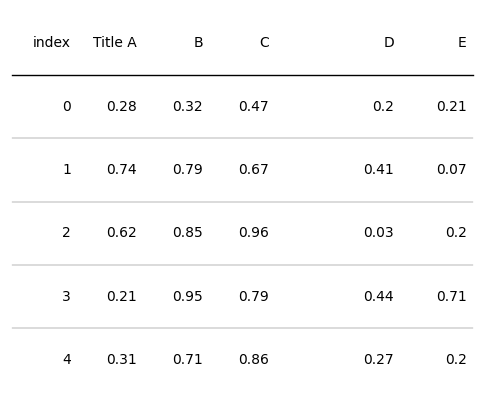
通過ColumnDefinition類來設定Table類的column_definitions引數,可以實現不同表格列樣式的效果。如果是同時多個列的繪圖效果,則需要使用[ColumnDefinition,ColumnDefinition]列表的形式。一些使用範例如下
設定列標題和列寬
import matplotlib.pyplot as plt
import numpy as np
import pandas as pd
from plottable import ColumnDefinition, ColDef, Table

d = pd.DataFrame(np.random.random((5, 5)), columns=["A", "B", "C", "D", "E"]).round(2)
fig, ax = plt.subplots(figsize=(6, 5))
# name表示設定哪個列的樣式
tab = Table(d, column_definitions=[ColumnDefinition(name="A", title="Title A"),
                                   ColumnDefinition(name="D", width=2)])

plt.show()
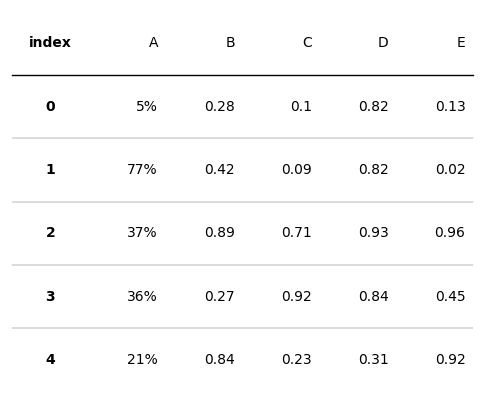
設定列的文字屬性和文字格式
from plottable.formatters import decimal_to_percent

d = pd.DataFrame(np.random.random((5, 5)), columns=["A", "B", "C", "D", "E"]).round(2)
fig, ax = plt.subplots(figsize=(6, 5))
# index列的文字居中,加粗
# 列A的文字數值改為百分制
tab = Table(d, column_definitions=[ColumnDefinition(name="index", textprops={"ha": "center", "weight": "bold"}),
                                   ColumnDefinition(name="A", formatter=decimal_to_percent)])

plt.show()
設定列單元格背景色和字型顏色
from plottable.cmap import normed_cmap
import matplotlib.cm

d = pd.DataFrame(np.random.random((5, 5)), columns=["A", "B", "C", "D", "E"]).round(2)
fig, ax = plt.subplots(figsize=(6, 5))
# cmap設定單元格背景色
tab = Table(d, column_definitions=[ColumnDefinition(name="A", cmap=matplotlib.cm.tab20, text_cmap=matplotlib.cm.Reds),
                                   ColumnDefinition(name="B", cmap=matplotlib.cm.tab20b),
                                   ColumnDefinition(name="C", text_cmap=matplotlib.cm.tab20c)])

plt.show()

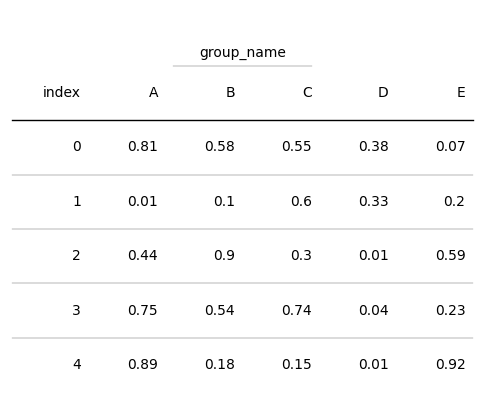
設定列的分組名
from plottable.cmap import normed_cmap
import matplotlib.cm

d = pd.DataFrame(np.random.random((5, 5)), columns=["A", "B", "C", "D", "E"]).round(2)
fig, ax = plt.subplots(figsize=(6, 5))
# 將列B和列C視為同一組,該組命名為group_name
tab = Table(d, column_definitions=[ColumnDefinition(name="B", group="group_name"),
                                   ColumnDefinition(name="C", group="group_name")])

plt.show()
設定列邊框
from plottable.cmap import normed_cmap
import matplotlib.cm

d = pd.DataFrame(np.random.random((5, 5)), columns=["A", "B", "C", "D", "E"]).round(2)
fig, ax = plt.subplots(figsize=(6, 5))
# 將列B和列C視為同一組,該組命名為group_name
tab = Table(d, column_definitions=[ColumnDefinition(name="A", border="l"),
                                   ColumnDefinition(name="C",  border="both")])

plt.show()

呼叫函數的使用
ColumnDefinition類的plot_fn和plot_kw引數提供了自定義函數實現表格效果繪製的功能。其中plot_fn表示待呼叫的函數,plot_kw表示待呼叫函數的輸入引數。此外在plotable.plots預置了一些效果函數,我們可以參考這些效果函數定義自己的繪圖函數。預置效果函數如下:
from pathlib import Path
import matplotlib
import matplotlib.pyplot as plt
import numpy as np
import pandas as pd
from matplotlib.colors import LinearSegmentedColormap
from plottable import ColumnDefinition, Table
# 呼叫預置繪圖函數
from plottable.plots import image,monochrome_image,circled_image,bar,percentile_bars,percentile_stars,progress_donut

cmap = matplotlib.cm.tab20
# 柱狀圖繪製
fig, ax = plt.subplots(figsize=(1, 1))
# 0.7表示數值,lw邊框線寬
b = bar(ax, 0.7, plot_bg_bar=True, cmap=cmap, annotate=True, lw=2, height=0.35)
plt.show()

# 星星百分比圖
fig, ax = plt.subplots(figsize=(2, 1))
stars = percentile_stars(ax, 85, background_color="#f0f0f0")

# 圓環圖
fig, ax = plt.subplots(figsize=(1, 1))
donut = progress_donut(ax, 73, textprops={"fontsize": 14})
plt.show()

對於待呼叫的函數,可以通過help函數檢視這些函數的引數含義。
help(progress_donut)
Help on function progress_donut in module plottable.plots:

progress_donut(ax: matplotlib.axes._axes.Axes, val: float, radius: float = 0.45, color: str = None, background_color: str = None, width: float = 0.05, is_pct: bool = False, textprops: Dict[str, Any] = {}, formatter: Callable = None, **kwargs) -> List[matplotlib.patches.Wedge]
    Plots a Progress Donut on the axes.

    Args:
        ax (matplotlib.axes.Axes): Axes
        val (float): value
        radius (float, optional):
            radius of the progress donut. Defaults to 0.45.
        color (str, optional):
            color of the progress donut. Defaults to None.
        background_color (str, optional):
            background_color of the progress donut where the value is not reached. Defaults to None.
        width (float, optional):
            width of the donut wedge. Defaults to 0.05.
        is_pct (bool, optional):
            whether the value is given not as a decimal, but as a value between 0 and 100.
            Defaults to False.
        textprops (Dict[str, Any], optional):
            textprops passed to ax.text. Defaults to {}.
        formatter (Callable, optional):
            a string formatter.
            Can either be a string format, ie "{:2f}" for 2 decimal places.
            Or a Callable that is applied to the value. Defaults to None.

    Returns:
        List[matplotlib.patches.Wedge]
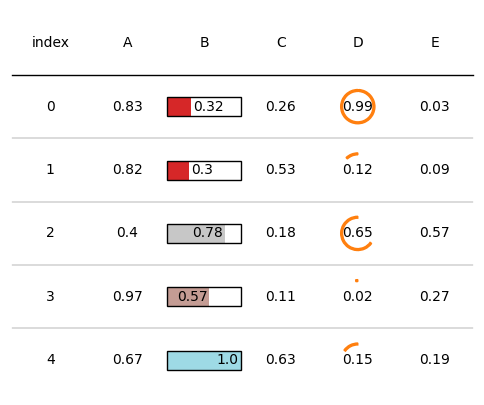
通過plot_fn和plot_kw引數設定自定義繪圖函數和函數輸入引數,可以展示不同的繪圖效果,如下所示:
from plottable.cmap import normed_cmap
import matplotlib.cm

d = pd.DataFrame(np.random.random((5, 5)), columns=["A", "B", "C", "D", "E"]).round(2)
fig, ax = plt.subplots(figsize=(6, 5))
# plot_fn和plot_kw
tab = Table(d, textprops={"ha": "center"},
            column_definitions=[ColumnDefinition(name="B", plot_fn=bar,plot_kw={'plot_bg_bar':True,'cmap':cmap,
                                'annotate':True, 'height':0.5}),
                                ColumnDefinition(name="D", plot_fn=progress_donut,plot_kw={'is_pct':True,})])

plt.show()
自定義文字格式
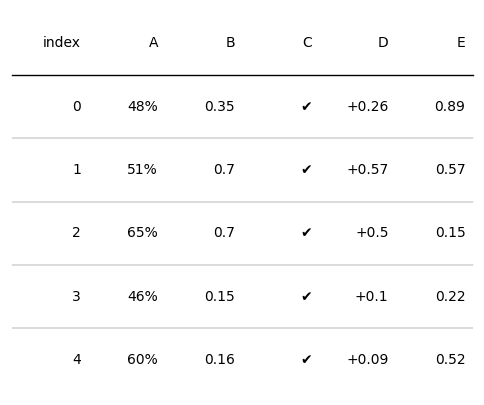
plottable提供了以下三個自定義函數來表示不同的文字格式:
- decimal_to_percent:將數值資料變為百分比
- tickcross:將數值格式化為✔或✖
- signed_integer:新增正負符號
我們可以通過ColumnDefinition的formatter來設定文字格式,如下所示:
import matplotlib
import matplotlib.pyplot as plt
import numpy as np
import pandas as pd
from plottable import ColumnDefinition, Table
from plottable.formatters import decimal_to_percent,tickcross,signed_integer

d = pd.DataFrame(np.random.random((5, 5)), columns=["A", "B", "C", "D", "E"]).round(2)
fig, ax = plt.subplots(figsize=(6, 5))
tab = Table(d, column_definitions=[ColumnDefinition(name="A", formatter=decimal_to_percent),
                                   ColumnDefinition(name="C", formatter=tickcross),
                                   ColumnDefinition(name="D", formatter=signed_integer)])

plt.show()
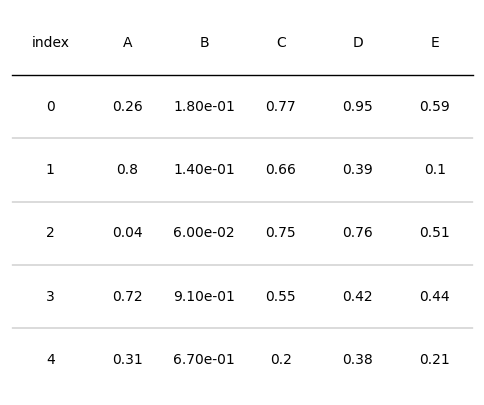
此外,也可以自定義函數來設定文字格式,如下所示:
def setformat(x):
    # 使用format格式函數
    return "{:.2e}".format(x)

d = pd.DataFrame(np.random.random((5, 5)), columns=["A", "B", "C", "D", "E"]).round(2)
fig, ax = plt.subplots(figsize=(6, 5))
tab = Table(d, textprops={"ha": "center"},column_definitions=[ColumnDefinition(name="B", formatter=setformat),
                                   ColumnDefinition(name="D", formatter=lambda x: round(x, 2))])

plt.show()
1.3 行列自定義
存取行列單元格
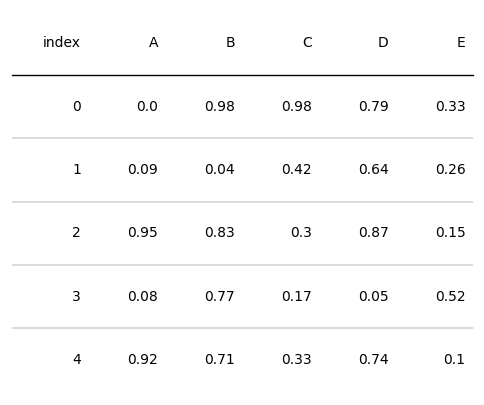
plottable提供了直接存取Table範例的某一行、某一列的方法,如下所示:
from plottable.cmap import normed_cmap
import matplotlib.cm

d = pd.DataFrame(np.random.random((5, 5)), columns=["A", "B", "C", "D", "E"]).round(2)
fig, ax = plt.subplots(figsize=(6, 5))
# 範例化Table物件
tab = Table(d)
# 根據列名,提取整列
tab.columns['A']
Column(cells=[TextCell(xy=(1, 0), content=0.0, row_idx=0, col_idx=1), TextCell(xy=(1, 1), content=0.09, row_idx=1, col_idx=1), TextCell(xy=(1, 2), content=0.95, row_idx=2, col_idx=1), TextCell(xy=(1, 3), content=0.08, row_idx=3, col_idx=1), TextCell(xy=(1, 4), content=0.92, row_idx=4, col_idx=1)], index=1)
# 讀取某列第1行的內容
tab.columns['B'].cells[1].content
0.04
# 根據行索引,提取整行
tab.rows[1]
Row(cells=[TextCell(xy=(0, 1), content=1, row_idx=1, col_idx=0), TextCell(xy=(1, 1), content=0.09, row_idx=1, col_idx=1), TextCell(xy=(2, 1), content=0.04, row_idx=1, col_idx=2), TextCell(xy=(3, 1), content=0.42, row_idx=1, col_idx=3), TextCell(xy=(4, 1), content=0.64, row_idx=1, col_idx=4), TextCell(xy=(5, 1), content=0.26, row_idx=1, col_idx=5)], index=1)
# 提取表頭列名
tab.col_label_row
Row(cells=[TextCell(xy=(0, -1), content=index, row_idx=-1, col_idx=0), TextCell(xy=(1, -1), content=A, row_idx=-1, col_idx=1), TextCell(xy=(2, -1), content=B, row_idx=-1, col_idx=2), TextCell(xy=(3, -1), content=C, row_idx=-1, col_idx=3), TextCell(xy=(4, -1), content=D, row_idx=-1, col_idx=4), TextCell(xy=(5, -1), content=E, row_idx=-1, col_idx=5)], index=-1)
設定單元格樣式
在上面的例子可以看到plottable直接存取表格行列物件,因此我們可以通過設定這些物件的繪圖屬性來直接更改其繪圖效果或文字效果,所支援更改的屬性如下:
- 單元格屬性
- set_alpha:設定單元格的透明度。
- set_color:設定單元格的顏色。
- set_edgecolor:設定單元格邊緣的顏色。
- set_facecolor:設定單元格內部的顏色。
- set_fill:設定單元格是否填充。
- set_hatch:設定單元格的填充圖案。
- set_linestyle:設定單元格邊緣線的樣式。
- set_linewidth:設定單元格邊緣線的寬度。
- 字型屬性
- set_fontcolor:設定字型的顏色。
- set_fontfamily:設定字型的家族。
- set_fontsize:設定字型的大小。
- set_ha:設定文字的水平對齊方式。
- set_ma:設定文字的垂直對齊方式。
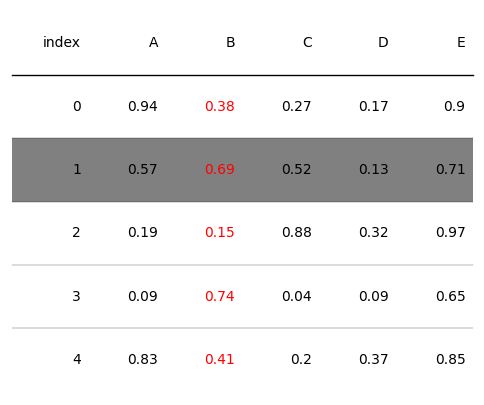
範例程式碼如下:
from plottable.cmap import normed_cmap
import matplotlib.cm

d = pd.DataFrame(np.random.random((5, 5)), columns=["A", "B", "C", "D", "E"]).round(2)
fig, ax = plt.subplots(figsize=(6, 5))
# 範例化Table物件
tab = Table(d)
# 設定行號為1的行的背景顏色
tab.rows[1].set_facecolor("grey")
# 設定B列的字型顏色
tab.columns['B'].set_fontcolor("red")
Column(cells=[TextCell(xy=(2, 0), content=0.38, row_idx=0, col_idx=2), TextCell(xy=(2, 1), content=0.69, row_idx=1, col_idx=2), TextCell(xy=(2, 2), content=0.15, row_idx=2, col_idx=2), TextCell(xy=(2, 3), content=0.74, row_idx=3, col_idx=2), TextCell(xy=(2, 4), content=0.41, row_idx=4, col_idx=2)], index=2)
2 繪圖範例
2.1 多行樣式設定
import matplotlib.pyplot as plt
import numpy as np
import pandas as pd

from plottable import Table

d = pd.DataFrame(np.random.random((5, 5)), columns=["A", "B", "C", "D", "E"]).round(2)

fig, ax = plt.subplots(figsize=(6, 3))

# row_dividers顯示行的分割線
# odd_row_color奇數行顏色
# even_row_color偶數行顏色
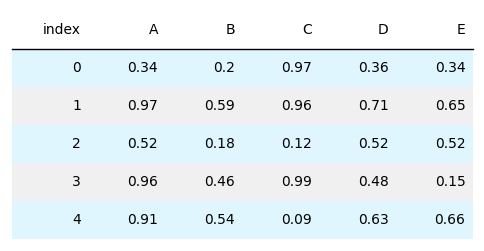
tab = Table(d, row_dividers=False, odd_row_color="#f0f0f0", even_row_color="#e0f6ff")

plt.show()

fig.savefig("table.jpg",dpi=300,bbox_inches='tight')
2.2 自定義單元格效果
import matplotlib.pyplot as plt
import numpy as np
import pandas as pd
from matplotlib.colors import LinearSegmentedColormap

from plottable import ColumnDefinition, Table
from plottable.formatters import decimal_to_percent
from plottable.plots import bar, percentile_bars, percentile_stars, progress_donut

# 自定義顏色
cmap = LinearSegmentedColormap.from_list(
    name="BuYl", colors=["#01a6ff", "#eafedb", "#fffdbb", "#ffc834"], N=256
)

fig, ax = plt.subplots(figsize=(6, 6))

d = pd.DataFrame(np.random.random((5, 4)), columns=["A", "B", "C", "D"]).round(2)

tab = Table(
    d,
    cell_kw={
        "linewidth": 0,
        "edgecolor": "k",
    },
    textprops={"ha": "center"},
    column_definitions=[
        ColumnDefinition("index", textprops={"ha": "left"}),
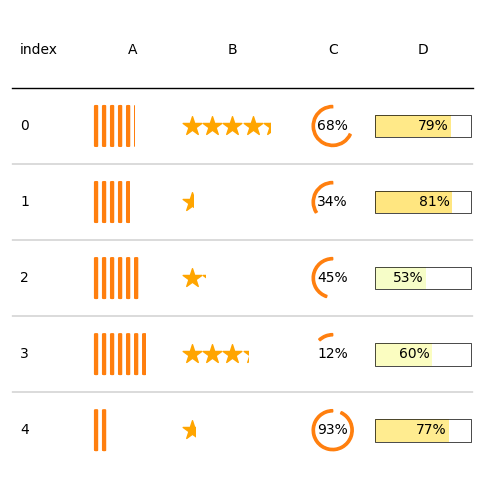
        ColumnDefinition("A", plot_fn=percentile_bars, plot_kw={"is_pct": True}),
        ColumnDefinition(
            "B", width=1.5, plot_fn=percentile_stars, plot_kw={"is_pct": True}
        ),
        ColumnDefinition(
            "C",
            plot_fn=progress_donut,
            plot_kw={
                "is_pct": True,
                "formatter": "{:.0%}"
                },
            ),
        ColumnDefinition(
            "D",
            width=1.25,
            plot_fn=bar,
            plot_kw={
                "cmap": cmap,
                "plot_bg_bar": True,
                "annotate": True,
                "height": 0.5,
                "lw": 0.5,
                "formatter": decimal_to_percent,
            },
        ),
    ],
)

plt.show()
2.3 熱圖
import matplotlib.pyplot as plt
import numpy as np
import pandas as pd
from matplotlib.colors import LinearSegmentedColormap
# ColDef是ColumnDefinition的別名
from plottable import ColDef, Table

# 自定義顏色
cmap = LinearSegmentedColormap.from_list(
    name="bugw", colors=["#ffffff", "#f2fbd2", "#c9ecb4", "#93d3ab", "#35b0ab"], N=256
)
# 建立資料
cities = [
    "TORONTO",
    "VANCOUVER",
    "HALIFAX",
    "CALGARY",
    "OTTAWA",
    "MONTREAL",
    "WINNIPEG",
    "EDMONTON",
    "LONDON",
    "ST. JONES",
]
months = [
    "JAN",
    "FEB",
    "MAR",
    "APR",
    "MAY",
    "JUN",
    "JUL",
    "AUG",
    "SEP",
    "OCT",
    "NOV",
    "DEC",
]

data = np.random.random((10, 12)) + np.abs(np.arange(12) - 5.5)
data = (1 - data / (np.max(data)))
data.shape
(10, 12)
# 繪圖
d = pd.DataFrame(data, columns=months, index=cities).round(2)
fig, ax = plt.subplots(figsize=(14, 5))

# 自定義各列的繪圖效果
column_definitions = [
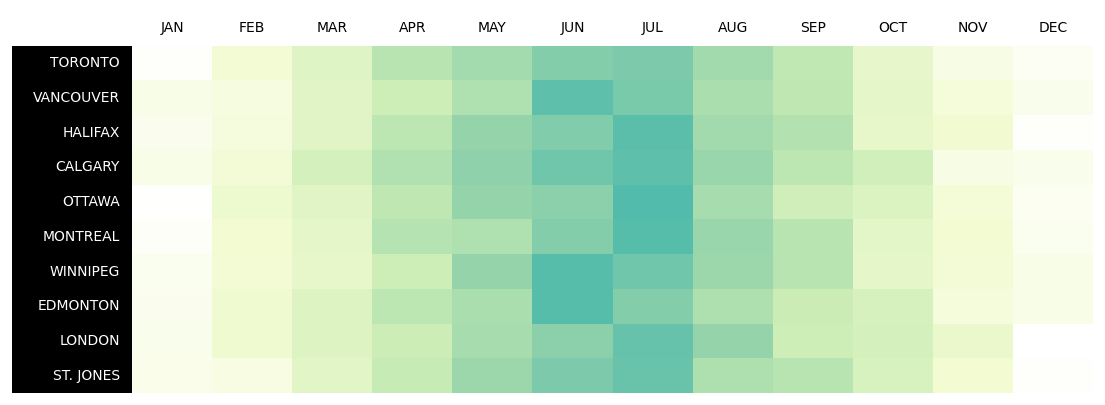
    ColDef(name, cmap=cmap, formatter=lambda x: "") for name in months
] + [ColDef("index", title="", width=1.5, textprops={"ha": "right"})]

tab = Table(
    d,
    column_definitions=column_definitions,
    row_dividers=False,
    col_label_divider=False,
    textprops={"ha": "center", "fontname": "Roboto"},
    # 設定各個單元格的效果
    cell_kw={
        "edgecolor": "black",
        "linewidth": 0,
    },
)


# 設定列標題文字和背景顏色
tab.col_label_row.set_facecolor("white")
tab.col_label_row.set_fontcolor("black")
# 設定行標題文字和背景顏色
tab.columns["index"].set_facecolor("black")
tab.columns["index"].set_fontcolor("white")
tab.columns["index"].set_linewidth(0)

plt.show()
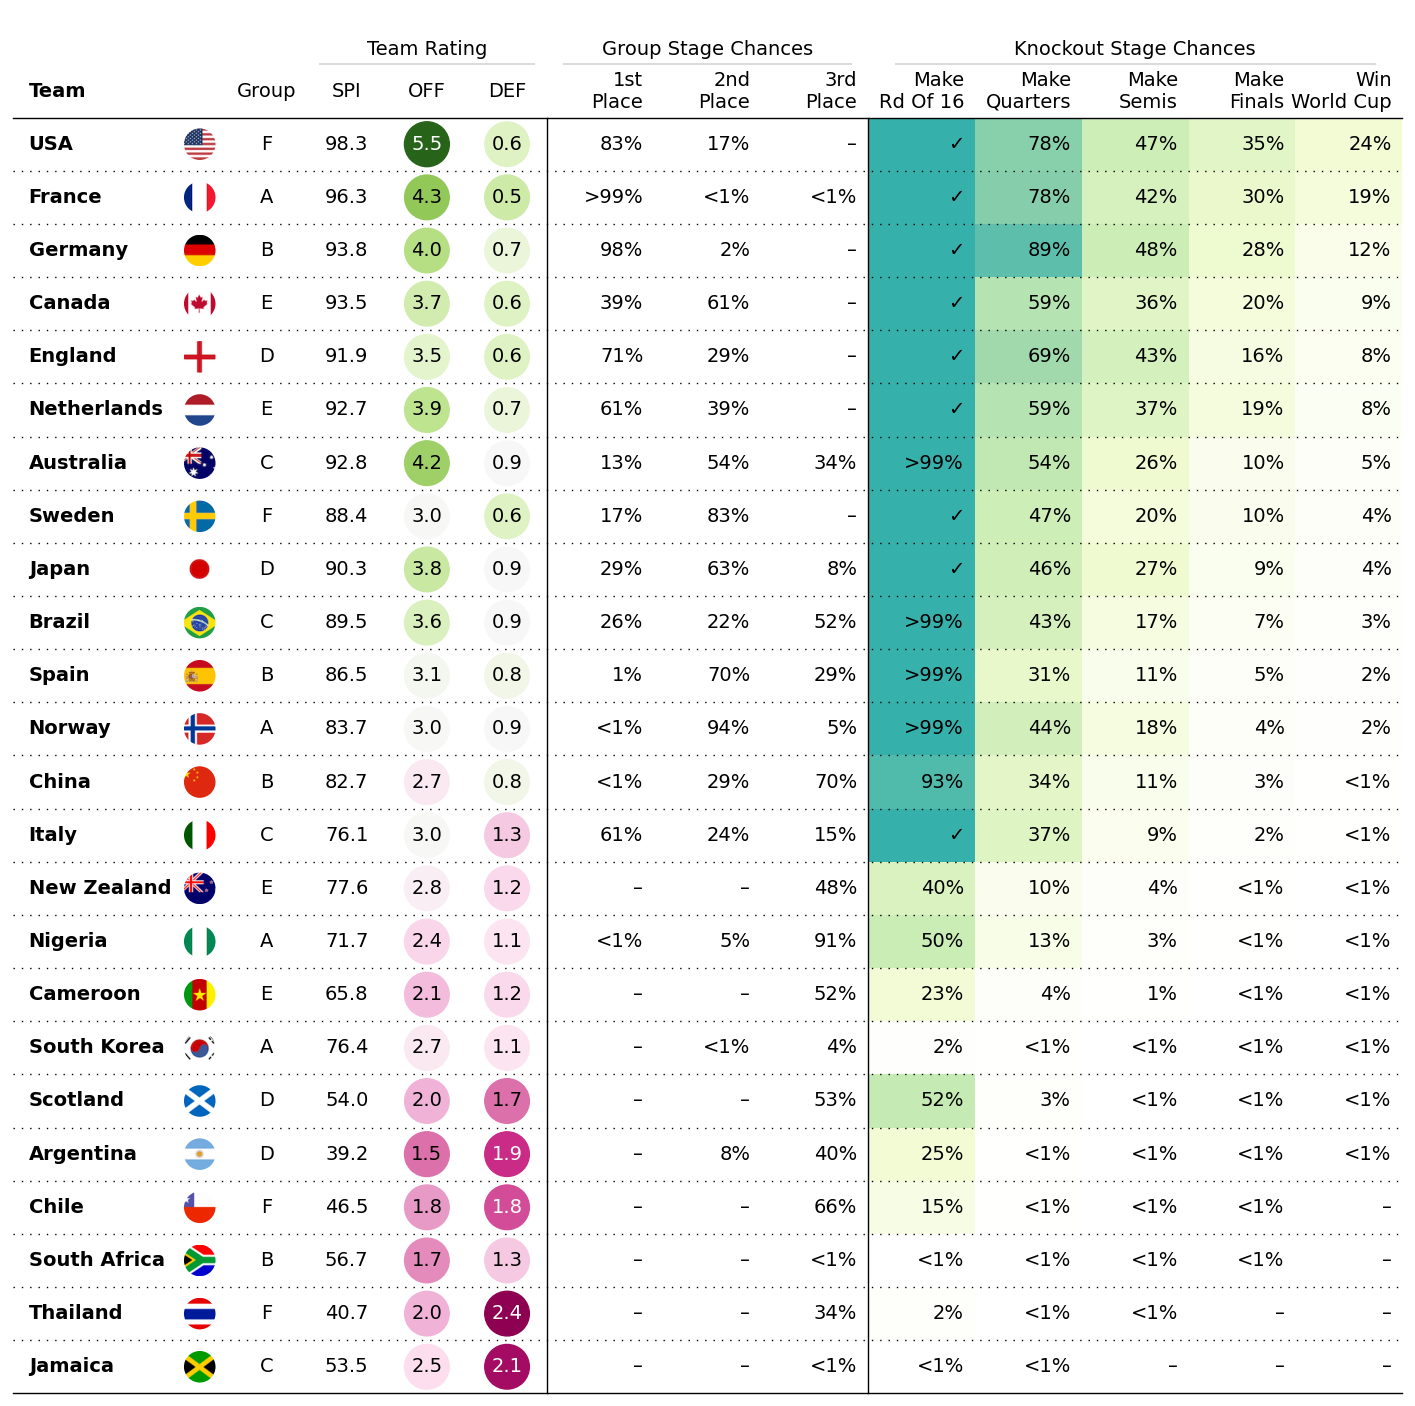
2.4 女子世界盃預測資料展示
step1 準備資料
下載範例資料,所有範例資料在plottable-example_notebooks。
# 下載資料集
# !wget https://raw.githubusercontent.com/znstrider/plottable/master/docs/example_notebooks/data/wwc_forecasts.csv
from pathlib import Path

import matplotlib
import matplotlib.pyplot as plt
import numpy as np
import pandas as pd
from matplotlib.colors import LinearSegmentedColormap

from plottable import ColumnDefinition, Table
from plottable.cmap import normed_cmap
from plottable.formatters import decimal_to_percent
from plottable.plots import circled_image # image
cols = [
    "team",
    "points",
    "group",
    "spi",
    "global_o",
    "global_d",
    "group_1",
    "group_2",
    "group_3",
    "make_round_of_16",
    "make_quarters",
    "make_semis",
    "make_final",
    "win_league",
]

# 讀取資料
df = pd.read_csv(
    "data/wwc_forecasts.csv",
    usecols=cols,
)

# 展示資料
df.head()
| team | group | spi | global_o | global_d | group_1 | group_2 | group_3 | make_round_of_16 | make_quarters | make_semis | make_final | win_league | points | |
|---|---|---|---|---|---|---|---|---|---|---|---|---|---|---|
| 0 | USA | F | 98.32748 | 5.52561 | 0.58179 | 0.82956 | 0.17044 | 0.00000 | 1.0 | 0.78079 | 0.47307 | 0.35076 | 0.23618 | 6 |
| 1 | France | A | 96.29671 | 4.31375 | 0.52137 | 0.99483 | 0.00515 | 0.00002 | 1.0 | 0.78367 | 0.42052 | 0.30038 | 0.19428 | 6 |
| 2 | Germany | B | 93.76549 | 3.96791 | 0.67818 | 0.98483 | 0.01517 | 0.00000 | 1.0 | 0.89280 | 0.48039 | 0.27710 | 0.12256 | 6 |
| 3 | Canada | E | 93.51599 | 3.67537 | 0.56980 | 0.38830 | 0.61170 | 0.00000 | 1.0 | 0.59192 | 0.36140 | 0.20157 | 0.09031 | 6 |
| 4 | England | D | 91.92311 | 3.51560 | 0.63717 | 0.70570 | 0.29430 | 0.00000 | 1.0 | 0.68510 | 0.43053 | 0.16465 | 0.08003 | 6 |
此外,我們需要準備每個國家對應的國旗圖片,該資料也在plottable-example_notebooks下。
# 讀取圖片路徑
flag_paths = list(Path("data/country_flags").glob("*.png"))
country_to_flagpath = {p.stem: p for p in flag_paths}
step2 資料處理
該步需要合併資料,將其轉換為plottable可用的資料結構。
# 重置列名
colnames = [
    "Team",
    "Points",
    "Group",
    "SPI",
    "OFF",
    "DEF",
    "1st Place",
    "2nd Place",
    "3rd Place",
    "Make Rd Of 16",
    "Make Quarters",
    "Make Semis",
    "Make Finals",
    "Win World Cup",
]

col_to_name = dict(zip(cols, colnames))
col_to_name
{'team': 'Team',
 'points': 'Points',
 'group': 'Group',
 'spi': 'SPI',
 'global_o': 'OFF',
 'global_d': 'DEF',
 'group_1': '1st Place',
 'group_2': '2nd Place',
 'group_3': '3rd Place',
 'make_round_of_16': 'Make Rd Of 16',
 'make_quarters': 'Make Quarters',
 'make_semis': 'Make Semis',
 'make_final': 'Make Finals',
 'win_league': 'Win World Cup'}
df[["spi", "global_o", "global_d"]] = df[["spi", "global_o", "global_d"]].round(1)

df = df.rename(col_to_name, axis=1)
# 刪除Points列
df = df.drop("Points", axis=1)
# 插入列
df.insert(0, "Flag", df["Team"].apply(lambda x: country_to_flagpath.get(x)))
df = df.set_index("Team")
df.head()
| Flag | Group | SPI | OFF | DEF | 1st Place | 2nd Place | 3rd Place | Make Rd Of 16 | Make Quarters | Make Semis | Make Finals | Win World Cup | |
|---|---|---|---|---|---|---|---|---|---|---|---|---|---|
| Team | |||||||||||||
| USA | data/country_flags/USA.png | F | 98.3 | 5.5 | 0.6 | 0.82956 | 0.17044 | 0.00000 | 1.0 | 0.78079 | 0.47307 | 0.35076 | 0.23618 |
| France | data/country_flags/France.png | A | 96.3 | 4.3 | 0.5 | 0.99483 | 0.00515 | 0.00002 | 1.0 | 0.78367 | 0.42052 | 0.30038 | 0.19428 |
| Germany | data/country_flags/Germany.png | B | 93.8 | 4.0 | 0.7 | 0.98483 | 0.01517 | 0.00000 | 1.0 | 0.89280 | 0.48039 | 0.27710 | 0.12256 |
| Canada | data/country_flags/Canada.png | E | 93.5 | 3.7 | 0.6 | 0.38830 | 0.61170 | 0.00000 | 1.0 | 0.59192 | 0.36140 | 0.20157 | 0.09031 |
| England | data/country_flags/England.png | D | 91.9 | 3.5 | 0.6 | 0.70570 | 0.29430 | 0.00000 | 1.0 | 0.68510 | 0.43053 | 0.16465 | 0.08003 |
step3 繪圖
# 設定顏色
cmap = LinearSegmentedColormap.from_list(
    name="bugw", colors=["#ffffff", "#f2fbd2", "#c9ecb4", "#93d3ab", "#35b0ab"], N=256
)
team_rating_cols = ["SPI", "OFF", "DEF"]
group_stage_cols = ["1st Place", "2nd Place", "3rd Place"]
knockout_stage_cols = list(df.columns[-5:])

# 單獨設定每一列的繪製引數
col_defs = (
    # 繪製第一部分效果
    [
        ColumnDefinition(
            name="Flag",
            title="",
            textprops={"ha": "center"},
            width=0.5,
            # 設定自定義效果展示函數
            plot_fn=circled_image,
        ),
        ColumnDefinition(
            name="Team",
            textprops={"ha": "left", "weight": "bold"},
            width=1.5,
        ),
        ColumnDefinition(
            name="Group",
            textprops={"ha": "center"},
            width=0.75,
        ),
        ColumnDefinition(
            name="SPI",
            group="Team Rating",
            textprops={"ha": "center"},
            width=0.75,
        ),
        ColumnDefinition(
            name="OFF",
            width=0.75,
            textprops={
                "ha": "center",
                # 設定填充方式
                "bbox": {"boxstyle": "circle", "pad": 0.35},
            },
            cmap=normed_cmap(df["OFF"], cmap=matplotlib.cm.PiYG, num_stds=2.5),
            group="Team Rating",
        ),
        ColumnDefinition(
            name="DEF",
            width=0.75,
            textprops={
                "ha": "center",
                "bbox": {"boxstyle": "circle", "pad": 0.35},
            },
            cmap=normed_cmap(df["DEF"], cmap=matplotlib.cm.PiYG_r, num_stds=2.5),
            group="Team Rating",
        ),
    ]
    # 繪製第二部分效果
    + [
        ColumnDefinition(
            name=group_stage_cols[0],
            title=group_stage_cols[0].replace(" ", "\n", 1),
            formatter=decimal_to_percent,
            group="Group Stage Chances",
            # 設定邊框
            border="left",
        )
    ]
    + [
        ColumnDefinition(
            name=col,
            title=col.replace(" ", "\n", 1),
            formatter=decimal_to_percent,
            group="Group Stage Chances",
        )
        for col in group_stage_cols[1:]
    ]
    # 繪製第三部分效果
    + [
        ColumnDefinition(
            name=knockout_stage_cols[0],
            title=knockout_stage_cols[0].replace(" ", "\n", 1),
            formatter=decimal_to_percent,
            cmap=cmap,
            group="Knockout Stage Chances",
            border="left",
        )
    ]
    + [
        ColumnDefinition(
            name=col,
            title=col.replace(" ", "\n", 1),
            formatter=decimal_to_percent,
            cmap=cmap,
            group="Knockout Stage Chances",
        )
        for col in knockout_stage_cols[1:]
    ]
)
# 繪圖
fig, ax = plt.subplots(figsize=(18, 18))

table = Table(
    df,
    column_definitions=col_defs,
    row_dividers=True,
    footer_divider=True,
    ax=ax,
    textprops={"fontsize": 14},
    row_divider_kw={"linewidth": 1, "linestyle": (0, (1, 5))},
    col_label_divider_kw={"linewidth": 1, "linestyle": "-"},
    column_border_kw={"linewidth": 1, "linestyle": "-"},
).autoset_fontcolors(colnames=["OFF", "DEF"])


plt.show()
# 儲存圖片
fig.savefig("wwc_table.jpg", facecolor=ax.get_facecolor(), dpi=300,bbox_inches='tight')
2.5 德甲積分排名榜展示
step1 準備資料
from pathlib import Path

import matplotlib.pyplot as plt
import numpy as np
import pandas as pd

from plottable import ColDef, Table
from plottable.plots import image
# 下載聯賽資料
# !wget https://projects.fivethirtyeight.com/soccer-api/club/spi_matches.csv
# !wget https://projects.fivethirtyeight.com/soccer-api/club/spi_matches_latest.csv
# 資料地址
FIVETHIRTYEIGHT_URLS = {
    "SPI_MATCHES": "https://projects.fivethirtyeight.com/soccer-api/club/spi_matches.csv",
    "SPI_MATCHES_LATEST": "https://projects.fivethirtyeight.com/soccer-api/club/spi_matches_latest.csv",
}

# 讀取資料
# df = pd.read_csv(FIVETHIRTYEIGHT_URLS["SPI_MATCHES_LATEST"])
df = pd.read_csv("data/spi_matches_latest.csv")
df.head()
| season | date | league_id | league | team1 | team2 | spi1 | spi2 | prob1 | prob2 | ... | importance1 | importance2 | score1 | score2 | xg1 | xg2 | nsxg1 | nsxg2 | adj_score1 | adj_score2 | |
|---|---|---|---|---|---|---|---|---|---|---|---|---|---|---|---|---|---|---|---|---|---|
| 0 | 2019 | 2019-03-01 | 1979 | Chinese Super League | Shandong Luneng | Guizhou Renhe | 48.22 | 37.83 | 0.5755 | 0.1740 | ... | 45.9 | 22.1 | 1.0 | 0.0 | 1.39 | 0.26 | 2.05 | 0.54 | 1.05 | 0.00 |
| 1 | 2019 | 2019-03-01 | 1979 | Chinese Super League | Shanghai Greenland | Shanghai SIPG | 39.81 | 60.08 | 0.2387 | 0.5203 | ... | 25.6 | 63.4 | 0.0 | 4.0 | 0.57 | 2.76 | 0.80 | 1.50 | 0.00 | 3.26 |
| 2 | 2019 | 2019-03-01 | 1979 | Chinese Super League | Guangzhou Evergrande | Tianjin Quanujian | 65.59 | 39.99 | 0.7832 | 0.0673 | ... | 77.1 | 28.8 | 3.0 | 0.0 | 0.49 | 0.45 | 1.05 | 0.75 | 3.15 | 0.00 |
| 3 | 2019 | 2019-03-01 | 1979 | Chinese Super League | Wuhan Zall | Beijing Guoan | 32.25 | 54.82 | 0.2276 | 0.5226 | ... | 35.8 | 58.9 | 0.0 | 1.0 | 1.12 | 0.97 | 1.51 | 0.94 | 0.00 | 1.05 |
| 4 | 2019 | 2019-03-01 | 1979 | Chinese Super League | Chongqing Lifan | Guangzhou RF | 38.24 | 40.45 | 0.4403 | 0.2932 | ... | 26.2 | 21.3 | 2.0 | 2.0 | 2.77 | 3.17 | 1.05 | 2.08 | 2.10 | 2.10 |
5 rows × 23 columns
# 篩選德甲聯賽資料,並刪除為空資料
bl = df.loc[df.league == "German Bundesliga"].dropna()
bl.head()
| season | date | league_id | league | team1 | team2 | spi1 | spi2 | prob1 | prob2 | ... | importance1 | importance2 | score1 | score2 | xg1 | xg2 | nsxg1 | nsxg2 | adj_score1 | adj_score2 | |
|---|---|---|---|---|---|---|---|---|---|---|---|---|---|---|---|---|---|---|---|---|---|
| 497 | 2022 | 2022-08-05 | 1845 | German Bundesliga | Eintracht Frankfurt | Bayern Munich | 68.47 | 91.75 | 0.1350 | 0.6796 | ... | 32.6 | 71.9 | 1.0 | 6.0 | 0.83 | 4.50 | 0.65 | 2.72 | 1.05 | 5.96 |
| 514 | 2022 | 2022-08-06 | 1845 | German Bundesliga | VfL Bochum | Mainz | 60.73 | 68.88 | 0.3568 | 0.3629 | ... | 33.5 | 34.5 | 1.0 | 2.0 | 1.00 | 1.62 | 0.96 | 0.86 | 1.05 | 2.10 |
| 515 | 2022 | 2022-08-06 | 1845 | German Bundesliga | Borussia Monchengladbach | TSG Hoffenheim | 69.38 | 66.77 | 0.4872 | 0.2742 | ... | 40.2 | 33.3 | 3.0 | 1.0 | 1.86 | 0.10 | 2.51 | 0.31 | 2.36 | 1.05 |
| 516 | 2022 | 2022-08-06 | 1845 | German Bundesliga | VfL Wolfsburg | Werder Bremen | 68.18 | 59.82 | 0.5319 | 0.2014 | ... | 30.2 | 33.3 | 2.0 | 2.0 | 0.81 | 0.97 | 1.07 | 1.25 | 2.10 | 2.10 |
| 517 | 2022 | 2022-08-06 | 1845 | German Bundesliga | 1. FC Union Berlin | Hertha Berlin | 69.98 | 59.70 | 0.5479 | 0.1860 | ... | 34.9 | 33.0 | 3.0 | 1.0 | 1.25 | 0.40 | 1.66 | 0.36 | 3.15 | 1.05 |
5 rows × 23 columns
step2 資料處理
# 統計得分
def add_points(df: pd.DataFrame) -> pd.DataFrame:
    # 三元表示式
    # df["score1"] > df["score2"],則返回3
    # np.where(df["score1"] == df["score2"],則返回1
    # 否則為0
    df["pts_home"] = np.where(
        df["score1"] > df["score2"], 3, np.where(df["score1"] == df["score2"], 1, 0)
    )
    df["pts_away"] = np.where(
        df["score1"] < df["score2"], 3, np.where(df["score1"] == df["score2"], 1, 0)
    )

    return df

# 統計得分資料
bl = add_points(bl)
# 總得分、總進球數、總助攻數和總黃牌數

# 以下程式碼先分別統計team1和team2的得分資料,然後將兩組資料相加
perform = (
    bl.groupby("team1")[[
        "pts_home",
        "score1",
        "score2",
        "xg1",
        "xg2",
    ]]
    .sum()
    .set_axis(
        [
            "pts",
            "gf",
            "ga",
            "xgf",
            "xga",
        ],
        axis=1,
    )
    .add(
        bl.groupby("team2")[[
            "pts_away",
            "score2",
            "score1",
            "xg2",
            "xg1",
        ]]
        .sum()
        .set_axis(
            [
                "pts",
                "gf",
                "ga",
                "xgf",
                "xga",
            ],
            axis=1,
        )
    )
)

# 由於python和pandas版本問題,如果上面的程式碼出問題,則使用下面程式碼
# t1= bl.groupby("team1")[["pts_home","score1","score2","xg1","xg2", ]]
# t1 = t1.sum()
# t1.set_axis( ["pts","gf","ga","xgf","xga", ], axis=1,)
# t2 = bl.groupby("team1")[["pts_home","score1","score2","xg1","xg2", ]]
# t2 = t2.sum()
# t2.set_axis( ["pts","gf","ga","xgf","xga", ], axis=1,)
# perform = (t1.add(t2))

perform.shape
(18, 5)
# 彙總得分表現資料
perform.index.name = "team"

perform["gd"] = perform["gf"] - perform["ga"]

perform = perform[
    [
        "pts",
        "gd",
        "gf",
        "ga",
        "xgf",
        "xga",
    ]
]

perform["games"] = bl.groupby("team1").size().add(bl.groupby("team2").size())
perform.head()
| pts | gd | gf | ga | xgf | xga | games | |
|---|---|---|---|---|---|---|---|
| team | |||||||
| 1. FC Union Berlin | 62 | 13.0 | 51.0 | 38.0 | 35.93 | 43.06 | 34 |
| Bayer Leverkusen | 50 | 8.0 | 57.0 | 49.0 | 53.62 | 48.20 | 34 |
| Bayern Munich | 71 | 54.0 | 92.0 | 38.0 | 84.93 | 40.12 | 34 |
| Borussia Dortmund | 71 | 39.0 | 83.0 | 44.0 | 75.96 | 42.69 | 34 |
| Borussia Monchengladbach | 43 | -3.0 | 52.0 | 55.0 | 53.05 | 58.88 | 34 |
# 統計各隊的勝負資料
def get_wins_draws_losses(games: pd.DataFrame) -> pd.DataFrame:
    return (
        games.rename({"pts_home": "pts", "team1": "team"}, axis=1)
        .groupby("team")["pts"]
        .value_counts()
        .add(
            games.rename({"pts_away": "pts", "team2": "team"}, axis=1)
            .groupby("team")["pts"]
            .value_counts(),
            fill_value=0,
        )
        .astype(int)
        .rename("count")
        .reset_index(level=1)
        .pivot(columns="pts", values="count")
        .rename({0: "L", 1: "D", 3: "W"}, axis=1)[["W", "D", "L"]]
    )

wins_draws_losses = get_wins_draws_losses(bl)
wins_draws_losses.head()
| pts | W | D | L |
|---|---|---|---|
| team | |||
| 1. FC Union Berlin | 18 | 8 | 8 |
| Bayer Leverkusen | 14 | 8 | 12 |
| Bayern Munich | 21 | 8 | 5 |
| Borussia Dortmund | 22 | 5 | 7 |
| Borussia Monchengladbach | 11 | 10 | 13 |
# 合併得分和勝負資料
perform = pd.concat([perform, wins_draws_losses], axis=1)
perform.head()
| pts | gd | gf | ga | xgf | xga | games | W | D | L | |
|---|---|---|---|---|---|---|---|---|---|---|
| team | ||||||||||
| 1. FC Union Berlin | 62 | 13.0 | 51.0 | 38.0 | 35.93 | 43.06 | 34 | 18 | 8 | 8 |
| Bayer Leverkusen | 50 | 8.0 | 57.0 | 49.0 | 53.62 | 48.20 | 34 | 14 | 8 | 12 |
| Bayern Munich | 71 | 54.0 | 92.0 | 38.0 | 84.93 | 40.12 | 34 | 21 | 8 | 5 |
| Borussia Dortmund | 71 | 39.0 | 83.0 | 44.0 | 75.96 | 42.69 | 34 | 22 | 5 | 7 |
| Borussia Monchengladbach | 43 | -3.0 | 52.0 | 55.0 | 53.05 | 58.88 | 34 | 11 | 10 | 13 |
step3 對映隊標圖片
隊標圖片地址為:plottable-example_notebooks
# 建立隊名和隊標的索引資料
club_logo_path = Path("data/bundesliga_crests_22_23")
club_logo_files = list(club_logo_path.glob("*.png"))
club_logos_paths = {f.stem: f for f in club_logo_files}
perform = perform.reset_index()

# 新增新列
perform.insert(0, "crest", perform["team"])
perform["crest"] = perform["crest"].replace(club_logos_paths)

# 資料排序
perform = perform.sort_values(by=["pts", "gd", "gf"], ascending=False)

for colname in ["gd", "gf", "ga"]:
    perform[colname] = perform[colname].astype("int32")

perform["goal_difference"] = perform["gf"].astype(str) + ":" + perform["ga"].astype(str)

# 新增排名
perform["rank"] = list(range(1, 19))

perform.head()
| crest | team | pts | gd | gf | ga | xgf | xga | games | W | D | L | goal_difference | rank | |
|---|---|---|---|---|---|---|---|---|---|---|---|---|---|---|
| 2 | data/bundesliga_crests_22_23/Bayern Munich.png | Bayern Munich | 71 | 54 | 92 | 38 | 84.93 | 40.12 | 34 | 21 | 8 | 5 | 92:38 | 1 |
| 3 | data/bundesliga_crests_22_23/Borussia Dortmund... | Borussia Dortmund | 71 | 39 | 83 | 44 | 75.96 | 42.69 | 34 | 22 | 5 | 7 | 83:44 | 2 |
| 10 | data/bundesliga_crests_22_23/RB Leipzig.png | RB Leipzig | 66 | 23 | 64 | 41 | 67.01 | 37.48 | 34 | 20 | 6 | 8 | 64:41 | 3 |
| 0 | data/bundesliga_crests_22_23/1. FC Union Berli... | 1. FC Union Berlin | 62 | 13 | 51 | 38 | 35.93 | 43.06 | 34 | 18 | 8 | 8 | 51:38 | 4 |
| 11 | data/bundesliga_crests_22_23/SC Freiburg.png | SC Freiburg | 59 | 7 | 51 | 44 | 53.11 | 52.25 | 34 | 17 | 8 | 9 | 51:44 | 5 |
step4 設定繪圖資料
# 設定顏色
row_colors = {
    "top4": "#2d3636",
    "top6": "#516362",
    "playoffs": "#8d9386",
    "relegation": "#c8ab8d",
    "even": "#627979",
    "odd": "#68817e",
}

bg_color = row_colors["odd"]
text_color = "#e0e8df"
# 確定繪圖列
table_cols = ["crest", "team", "games", "W", "D", "L", "goal_difference", "gd", "pts"]
perform[table_cols].head()
| crest | team | games | W | D | L | goal_difference | gd | pts | |
|---|---|---|---|---|---|---|---|---|---|
| 2 | data/bundesliga_crests_22_23/Bayern Munich.png | Bayern Munich | 34 | 21 | 8 | 5 | 92:38 | 54 | 71 |
| 3 | data/bundesliga_crests_22_23/Borussia Dortmund... | Borussia Dortmund | 34 | 22 | 5 | 7 | 83:44 | 39 | 71 |
| 10 | data/bundesliga_crests_22_23/RB Leipzig.png | RB Leipzig | 34 | 20 | 6 | 8 | 64:41 | 23 | 66 |
| 0 | data/bundesliga_crests_22_23/1. FC Union Berli... | 1. FC Union Berlin | 34 | 18 | 8 | 8 | 51:38 | 13 | 62 |
| 11 | data/bundesliga_crests_22_23/SC Freiburg.png | SC Freiburg | 34 | 17 | 8 | 9 | 51:44 | 7 | 59 |
# 定義各列繪圖效果
table_col_defs = [
    ColDef("rank", width=0.5, title=""),
    ColDef("crest", width=0.35, plot_fn=image, title=""),
    ColDef("team", width=2.5, title="", textprops={"ha": "left"}),
    ColDef("games", width=0.5, title="Games"),
    ColDef("W", width=0.5),
    ColDef("D", width=0.5),
    ColDef("L", width=0.5),
    ColDef("goal_difference", title="Goals"),
    ColDef("gd", width=0.5, title="", formatter="{:+}"),
    ColDef("pts", border="left", title="Points"),
]
step5 繪圖
fig, ax = plt.subplots(figsize=(14, 12))

plt.rcParams["text.color"] = text_color
# 設定繪圖字型
# plt.rcParams["font.family"] = "Roboto"

# 設定背景顏色
fig.set_facecolor(bg_color)
ax.set_facecolor(bg_color)

table = Table(
    perform,
    column_definitions=table_col_defs,
    row_dividers=True,
    col_label_divider=False,
    footer_divider=True,
    index_col="rank",
    columns=table_cols,
    even_row_color=row_colors["even"],
    footer_divider_kw={"color": bg_color, "lw": 2},
    row_divider_kw={"color": bg_color, "lw": 2},
    column_border_kw={"color": bg_color, "lw": 2},
    # 如果設定字型需要新增"fontname": "Roboto"
    textprops={"fontsize": 16, "ha": "center"},
)


# 設定不同行的顏色
for idx in [0, 1, 2, 3]:
    table.rows[idx].set_facecolor(row_colors["top4"])

for idx in [4, 5]:
    table.rows[idx].set_facecolor(row_colors["top6"])

table.rows[15].set_facecolor(row_colors["playoffs"])

for idx in [16, 17]:
    table.rows[idx].set_facecolor(row_colors["relegation"])
    table.rows[idx].set_fontcolor(row_colors["top4"])


fig.savefig(
    "bohndesliga_table_recreation.png",
    facecolor=fig.get_facecolor(),
    bbox_inches='tight',
    dpi=300,
)

