【調變解調】AM 調幅
說明
學習數位訊號處理演演算法時整理的學習筆記。同系列文章目錄可見 《DSP 學習之路》目錄。本篇介紹 AM 調幅訊號的調變與解調,內附全套 MATLAB 程式碼。
- 說明
- 1. AM 調變演演算法
- 2. AM 解調演演算法
- 3. AM 模擬(MATLAB Communications Toolbox)
- 參考資料
- 附錄程式碼
- 附.1 檔案 mod_am.m
- 附.2 檔案 main_modAM_example1.m
- 附.3 檔案 main_modAM_example2.m
- 附.4 檔案 demod_am_method1.m
- 附.5 檔案 main_demodAM_example1.m
- 附.6 檔案 demod_am_method2.m
- 附.7 檔案 main_demodAM_example2.m
- 附.8 檔案 demod_am_method3.m
- 附.9 檔案 main_demodAM_example3.m
- 附.10 檔案 demod_am_method4.m
- 附.11 檔案 main_demodAM_example4.m
- 附.12 檔案 main_CommAM_example.m
1. AM 調變演演算法
1.1 演演算法描述
用調變訊號去控制載波的幅度,使其按照調變訊號的規律變化,當調變訊號是模擬訊號時,這個過程就被稱為調幅(AM)。AM 訊號的時域表示式為:
式中:\(A_0\) 為外加的直流分量;\(m(t)\) 是調變訊號(攜帶要發出去的資訊),它可以是確知訊號,也可以是隨機訊號,其均值通常為 0;\(cos{\omega_ct}\) 是載波,\(\omega_c\) 是載波角頻率,與載波頻率 \(f_c\) 之間的關係為 \(\omega_c=2{\pi}f_c\)。
對式 \((1)\) 進行傅立葉變換,得到 AM 訊號的頻譜(幅度譜)表示式:
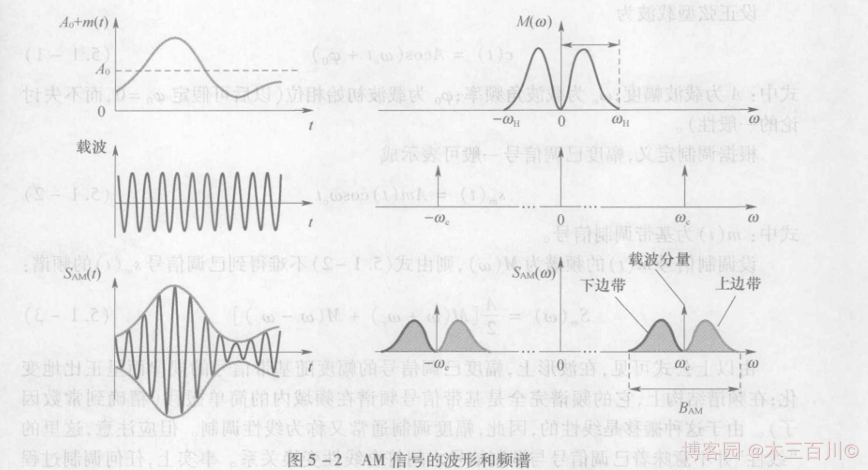
式中,\(M(\omega)\) 是調變訊號 \(m(t)\) 的頻譜。AM 訊號的特性如下:
-
\({\lvert}m(t){\rvert}_{max}\) 與 \(A_0\) 的比值被稱為調幅深度,或者調變指數,即 \({\beta}={{\lvert}m(t){\rvert}_{max}}/{A_0}\),取值範圍為 \((0,1]\),若調幅深度比 1 大,AM 訊號的包絡會出現嚴重失真,此時無法用包絡檢波法從 \(s_{AM}(t)\) 中解調出 \(m(t)\)。在接收端估算調變指數時,可以先提取訊號包絡 \(A(t)\),然後使用公式
\[\hat{\beta}=\frac{A_{max}-A_{min}}{A_{max}+A_{min}} \tag{3} \]對調變指數進行估算。
-
AM 訊號的頻譜由載波分量、上邊帶、下邊帶三部分組成。上邊帶的頻譜結構與原調變訊號的頻譜結構相同,下邊帶是上邊帶的映象。因此,AM 訊號是帶有載波分量的雙邊帶訊號,它的頻寬是基頻訊號(調變訊號)頻寬 \(f_H\) 的 2 倍,即 \(B_{AM}=2f_{H}\)。
-
有用功率 \(P_s\)(用於傳輸有用資訊的總邊帶功率)佔訊號總功率 \(P_{AM}\) 的比例被稱為調變效率,即
\[{\eta}_{AM}=\frac{P_s}{P_{AM}}=\frac{P_s}{{P_c}+{P_s}}=\frac{\overline{m^2(t)}}{A_0^2+\overline{m^2(t)}} \tag{4} \]式中 \(P_c\) 為載波功率,有 \(P_c={A_0^2}/2\),\(P_s\) 為邊帶功率,有 \(P_s=\overline{m^2(t)}/2\)。當調變訊號 \(m(t)\) 為單頻訊號時,調變效率 \({\eta}_{AM}\) 與調變指數 \({\beta}_{AM}\) 存在如下關係:
\[{\eta}_{AM}=\frac{{\beta}_{AM}^2}{2+{\beta}_{AM}^2} \tag{5} \]可得最大 AM 調變效率為 \(1/3\),因此 AM 訊號的功率利用率比較低。
1.2 調變訊號 m(t) 為確知訊號時
不妨假設確知訊號 \(m(t)\) 的時域表示式如下:
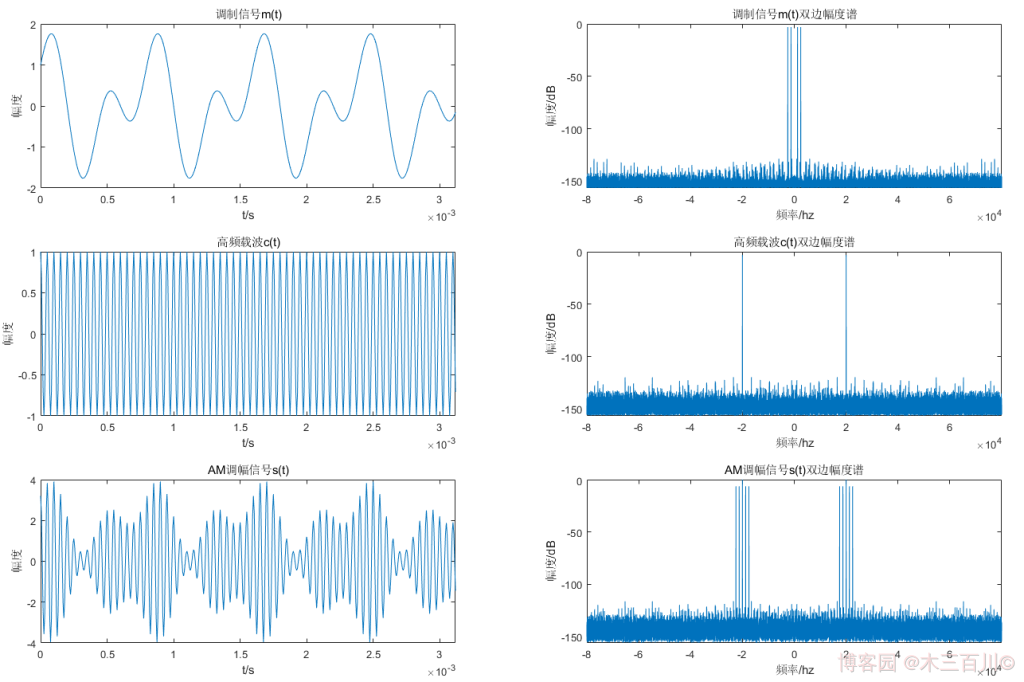
各調變引數取值:\(f_m=2500Hz\),\({\beta}=0.8\),\(f_c=20000Hz\)。訊號取樣率 \(f_s=8{f_c}\),模擬總時長為 \(2s\)。AM 調變效果如下圖所示(為了美觀,時域只顯示前 500 個點),調變訊號 \(m(t)\) 雙邊幅度譜有四根離散譜線(\({\pm}2500Hz\)、\({\pm}1250Hz\)),高頻載波 \(c(t)\) 雙邊幅度譜有兩根離散譜線(\({\pm}20000Hz\)),AM 調幅訊號 \(s(t)\) 雙邊幅度譜有十根離散譜線(\({\pm}22500Hz\)、\({\pm}21250Hz\)、\({\pm}20000Hz\)、\({\pm}18750Hz\)、\({\pm}17500Hz\))。
程式碼詳見附錄 main_modAM_example1.m 與 mod_am.m。
1.3 調變訊號 m(t) 為隨機訊號時
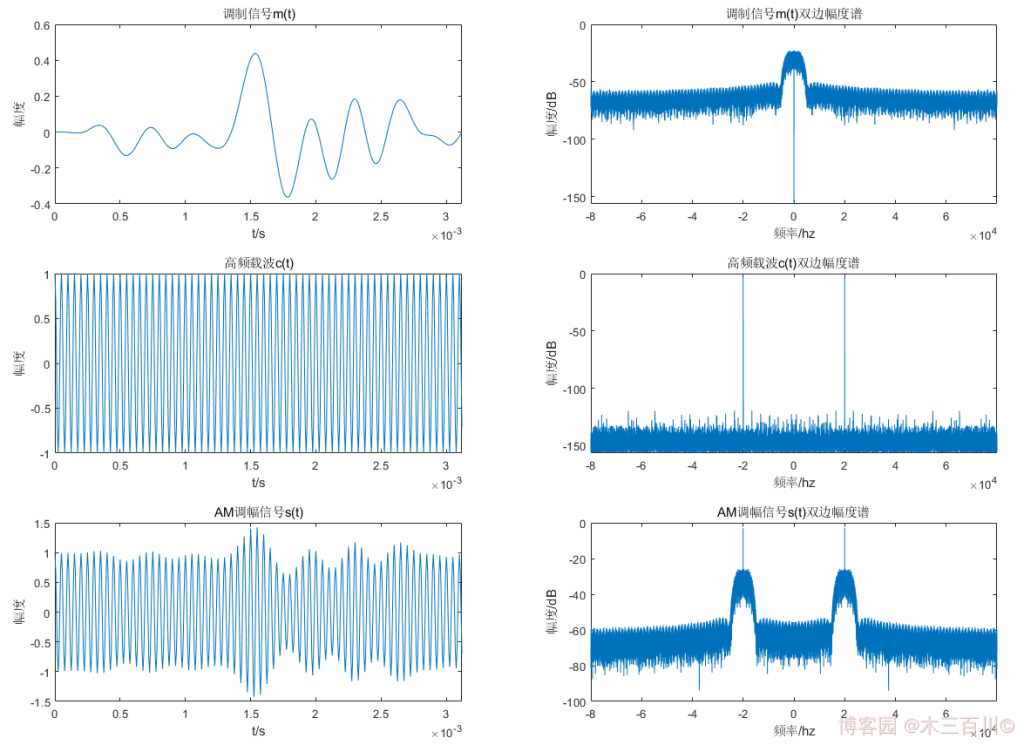
不妨假設基頻訊號頻寬為 \({f_H}=3000Hz\),各調變引數取值:\({\beta}=0.8\),\(f_c=20000Hz\)。訊號取樣率 \(f_s=8{f_c}\),模擬總時長為 \(2s\)。AM 調變效果如下圖所示(為了美觀,時域只顯示前 500 個點),調變訊號 \(m(t)\) 雙邊幅度譜中間譜峰的範圍約為 \(-3000Hz{\sim}3000Hz\),高頻載波 \(c(t)\) 雙邊幅度譜有兩根離散譜線(\({\pm}20000Hz\)),AM 調幅訊號 \(s(t)\) 雙邊幅度譜有兩根離散譜線(\({\pm}20000Hz\))及兩個譜峰(範圍約為 \(-23000Hz{\sim}-17000Hz\)、\(17000Hz{\sim}23000Hz\))。
程式碼詳見附錄 main_modAM_example2.m 與 mod_am.m。
2. AM 解調演演算法
解調是調變的逆過程,其作用是從接收的已調訊號中恢復原基頻訊號(即調變訊號)。AM 解調的方法可分為兩類:相干解調和非相干解調(包絡檢波),一般都採用包絡檢波。對上面 1.2 節中生成的 AM 訊號加高斯白噪聲,假設訊雜比 \(SNR=50dB\),加噪後的波形及頻譜如下圖所示(為了美觀,時域只顯示前 500 個點),頻譜中有十根離散譜線(\({\pm}22500Hz\)、\({\pm}21250Hz\)、\({\pm}20000Hz\)、\({\pm}18750Hz\)、\({\pm}17500Hz\)):

下面分別用幾種不同方法對這個 AM 接收訊號進行解調。
2.1 非相干解調(包絡檢波)
AM 訊號在滿足 \({\beta}{\leq}1\) 的條件下,其包絡與調變訊號 \(m(t)\) 的形狀完全一樣,因此可以從訊號包絡中提取調變訊號。AM 非相干解調(包絡檢波)一般有以下三個步驟:
- 第一步:全波整流(對 \(s(t)\) 取絕對值)或半波整流(將 \(s(t)\) 小於 \(0\) 的地方置零)。
- 第二步:低通濾波器濾除高頻載波,濾除 \(2{\omega}_c\) 或 \({\omega}_c\)。
- 第三步:去除直流分量(減去自身均值)。
每一步結果的時域波形及頻譜如下(為了美觀,時域只顯示前 500 個點)。全波整流結果的雙邊幅度譜中有二十根離散的譜線(\(0Hz\)、\({\pm}1250Hz\)、\({\pm}2500Hz\)、\({\pm}37500Hz\)、\({\pm}38750Hz\)、\({\pm}40000Hz\)、\({\pm}41250Hz\)、\({\pm}42500Hz\)、\({\pm}77500Hz\)、\({\pm}78750Hz\)、\(-80000Hz\))。經過低通濾波後,只剩零頻附近的五根譜線強度較大(\(0Hz\)、\({\pm}2500Hz\)、\({\pm}1250Hz\)),剩餘譜線可忽略。進一步去除直流後,只剩下調變訊號中的四根譜線(\({\pm}2500Hz\)、\({\pm}1250Hz\)),剩餘譜線可忽略,此時的時域波形就是 AM 非相干解調的結果。

解調訊號 \(\hat{m}(t)\) 與調變訊號 \(m(t)\) 的對比效果如下:
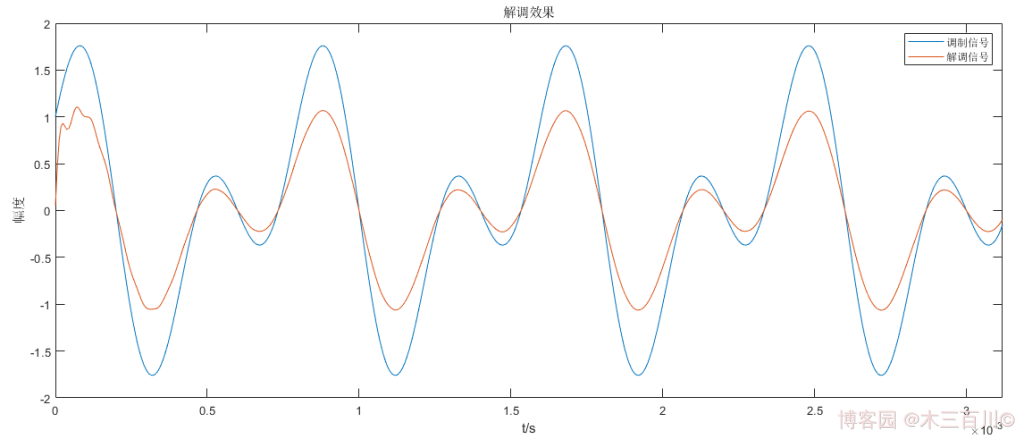
解調訊號與調變訊號波形基本一致,它們之間只相差一個比例係數,由 \(k=\overline{{\lvert}m(t){\rvert}}/\overline{{\lvert}\hat{m}(t){\rvert}}\) 可計算出這個比例係數約為 \(1.6567\),使用這個係數放大解調訊號幅值,然後計算誤差,有:\(\sqrt{\sum{{\lvert}m(t_i)-k\hat{m}(t_i){\rvert}^2}}/\sqrt{\sum{{\lvert}m(t_i){\rvert}^2}}\approx0.0054\)。程式碼詳見附錄 main_demodAM_example1.m 與 demod_am_method1.m。
2.2 相干解調
相干解調時,為了無失真地恢復原基頻訊號,接收端必須提供一個與調變載波嚴格同步(同頻同相)的本地載波(稱為相干載波,可使用鎖相環技術得到)。AM 相干解調一般有以下三個步驟:
- 第一步:乘以相干載波(即乘以 \(2cos({\omega_ct}+{\phi_0})\),前面的 2 被用來做幅度補償,詳見《通訊原理》教材)。
- 第二步:低通濾波器濾除高頻載波,濾除 \(2{\omega}_c\)。
- 第三步:去除直流分量(減去自身均值)。
解調時不妨取相干載波初相位為 \({\phi_0}=0\),更靠譜點的需使用鎖相環技術。每一步結果的時域波形及頻譜如下(為了美觀,時域只顯示前 500 個點)。乘以相干載波結果的雙邊幅度譜中有十五根離散的譜線(\(0Hz\)、\({\pm}1250Hz\)、\({\pm}2500Hz\)、\({\pm}37500Hz\)、\({\pm}38750Hz\)、\({\pm}40000Hz\)、\({\pm}41250Hz\)、\({\pm}42500Hz\))。經過低通濾波後,只剩零頻附近的五根譜線強度較大(\(0Hz\)、\({\pm}2500Hz\)、\({\pm}1250Hz\)),剩餘譜線可忽略。進一步去除直流後,只剩下調變訊號中的四根譜線(\({\pm}2500Hz\)、\({\pm}1250Hz\)),剩餘譜線可忽略,此時的時域波形就是 AM 相干解調的結果。
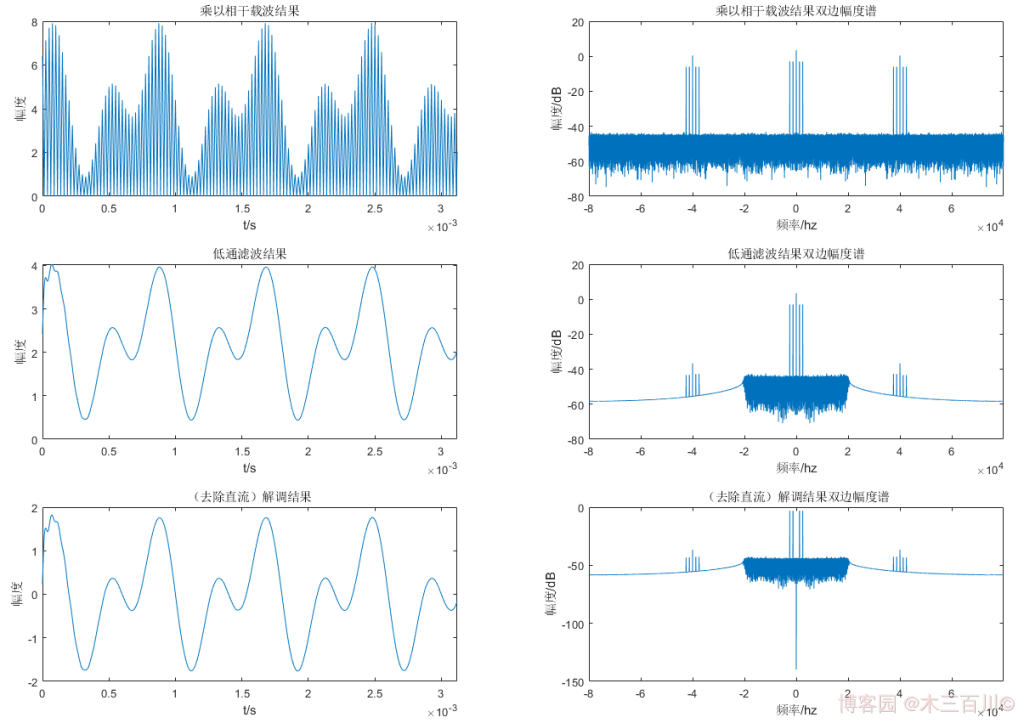
解調訊號 \(\hat{m}(t)\) 與調變訊號 \(m(t)\) 的對比效果如下:
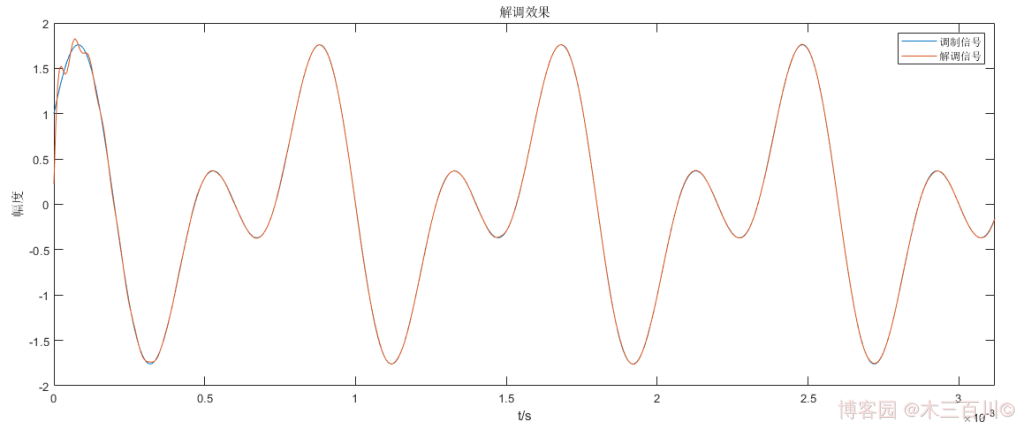
解調訊號與調變訊號波形基本重回,計算誤差,有:\(\sqrt{\sum{{\lvert}m(t_i)-\hat{m}(t_i){\rvert}^2}}/\sqrt{\sum{{\lvert}m(t_i){\rvert}^2}}\approx0.0053\)。更改相干載波的初始相位為 \({\phi_0}=\pi/4,\pi/2\),或者更改相干載波的中心頻率為 \(0.8f_c,1.2f_c\) 後,解調效果變差,說明這種方法對相干載波同頻同相的要求較高,魯棒性不夠強悍,可使用鎖相環技術來改善這一缺點。程式碼詳見附錄 main_demodAM_example2.m 與 demod_am_method2.m。
2.3 數位正交解調
數位正交解調也屬於相干解調的一種,但這種方法具有較強的抗載頻失配能力,不要求相干載波嚴格的同頻同相。AM 數位正交解調一般有以下四個步驟:
- 第一步:乘以正交相干載波得到 \({s_I}(t)\) 與 \({s_Q}(t)\),即 \({s_I}(t)=2s(t)cos({\omega_ct}+{\phi_0})\),\({s_Q}(t)=-2s(t)sin({\omega_ct}+{\phi_0})\),前面的 2 被用來做幅度補償。
- 第二步:低通濾波器濾除 \({s_I}(t)\) 與 \({s_Q}(t)\) 中的高頻分量。
- 第三步:計算包絡 \(A(t)=\sqrt{{s_I^2}(t)+{s_Q^2}(t)}\)。
- 第四步:去除直流分量(減去自身均值)。
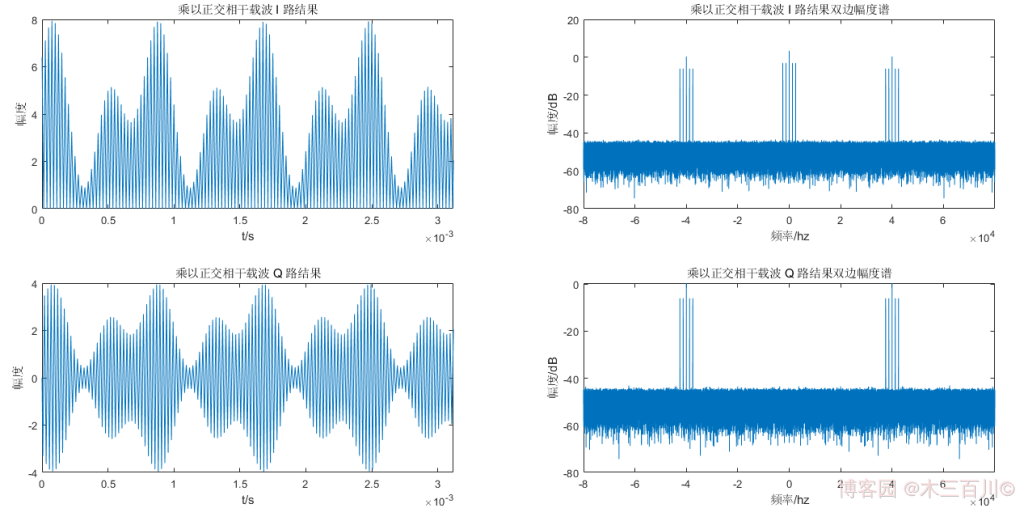
解調時不妨取相干載波初相位為 \({\phi_0}=0\)。第一步結果的時域波形及頻譜如下(為了美觀,時域只顯示前 500 個點)。乘以正交相干載波後,\(I\) 路雙邊幅度譜中有十五根離散譜線(\(0Hz\)、\({\pm}1250Hz\)、\({\pm}2500Hz\)、\({\pm}37500Hz\)、\({\pm}38750Hz\)、\({\pm}40000Hz\)、\({\pm}41250Hz\)、\({\pm}42500Hz\)),\(Q\) 路雙邊幅度譜中有十根離散譜線(\({\pm}37500Hz\)、\({\pm}38750Hz\)、\({\pm}40000Hz\)、\({\pm}41250Hz\)、\({\pm}42500Hz\))。
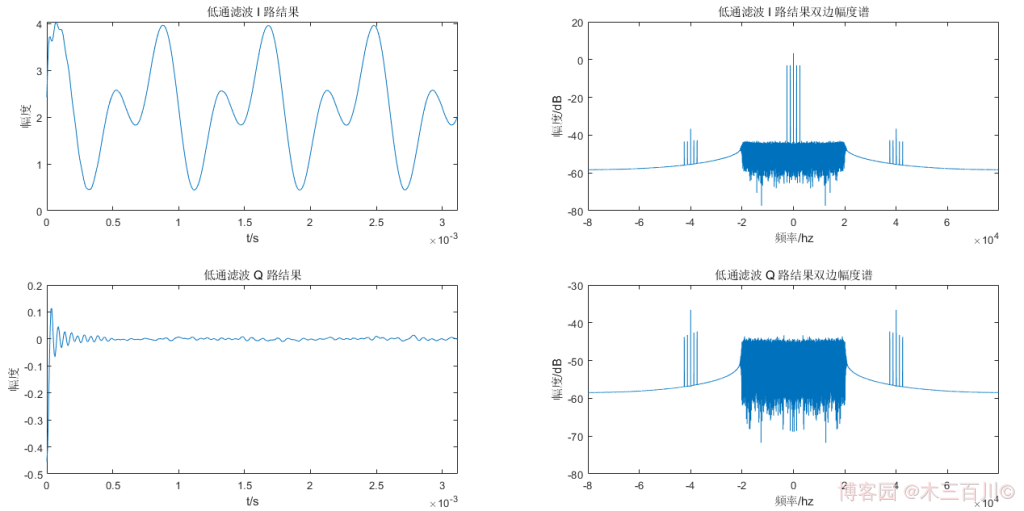
第二步結果的時域波形及頻譜如下(為了美觀,時域只顯示前 500 個點)。經過低通濾波後,\(I\) 路雙邊幅度譜只剩零頻附近的五根譜線強度較大(\(0Hz\)、\({\pm}2500Hz\)、\({\pm}1250Hz\)),剩餘譜線可忽略,\(Q\) 路雙邊幅度譜各譜線相對於 \(I\) 路而言都可忽略。
第三步以及第四步的時域波形及頻譜如下(為了美觀,時域只顯示前 500 個點)。計算所得包絡的雙邊幅度譜中,只剩零頻附近的五根譜線強度較大(\(0Hz\)、\({\pm}2500Hz\)、\({\pm}1250Hz\)),剩餘譜線可忽略,進一步去除直流後,只剩下調變訊號中的四根譜線(\({\pm}2500Hz\)、\({\pm}1250Hz\)),剩餘譜線可忽略,此時的時域波形就是 AM 相干解調的結果。
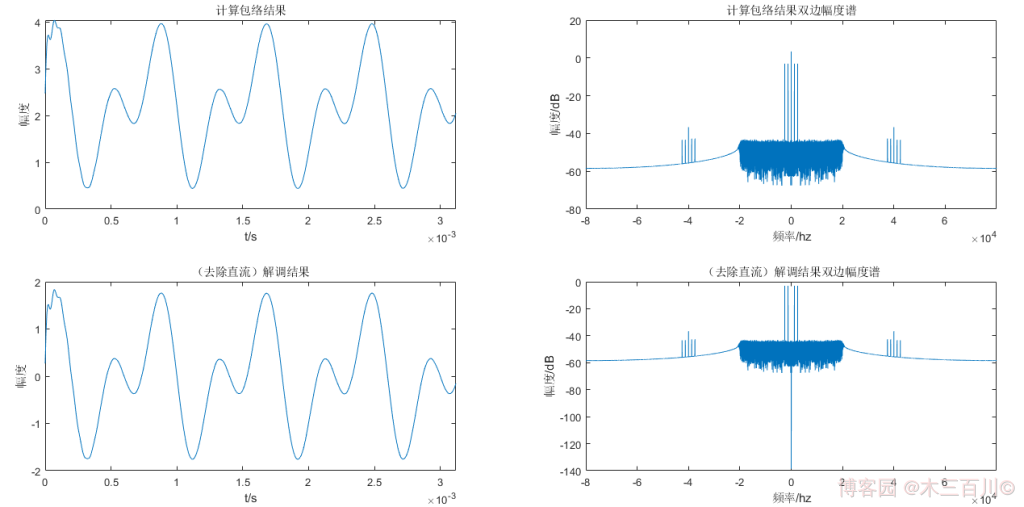
解調訊號 \(\hat{m}(t)\) 與調變訊號 \(m(t)\) 的對比效果如下:
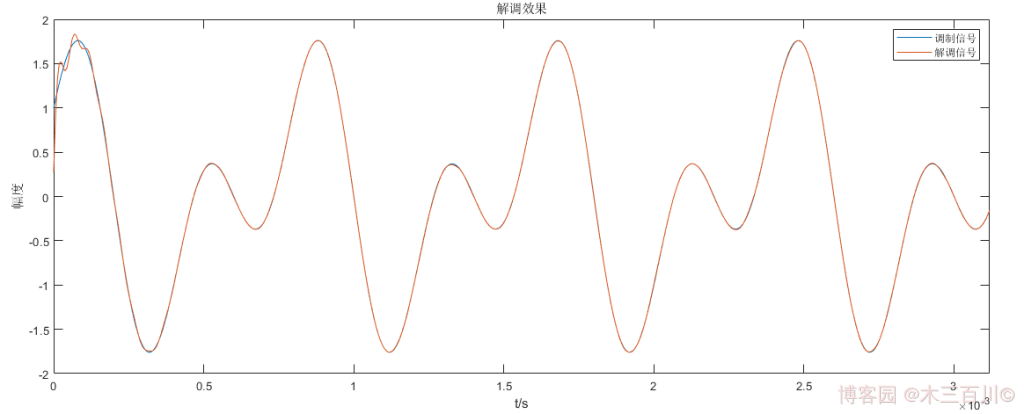
解調訊號與調變訊號波形基本重回,計算誤差,有:\(\sqrt{\sum{{\lvert}m(t_i)-\hat{m}(t_i){\rvert}^2}}/\sqrt{\sum{{\lvert}m(t_i){\rvert}^2}}\approx0.0053\)。更改相干載波的初始相位為 \({\phi_0}=\pi/4,\pi/2\),或者更改相干載波的中心頻率為 \(0.8f_c,1.2f_c\) 後,解調效果依然很好,說明這種方法具有較好的抗載頻失配能力。程式碼詳見附錄 main_demodAM_example3.m 與 demod_am_method3.m。
2.4 非相干解調(包絡檢波 - 希爾伯特變換法)
根據訊號的希爾伯特變換,可以計算出 AM 訊號的包絡,這種方法用 MATLAB 實現極為簡單,解調時無需任何載頻資訊:
-
第一步:計算 AM 訊號的希爾伯特變換,得到一個覆信號(實部為原 AM 訊號,虛部為其希爾伯特變換結果),對所得覆信號取模,即為 AM 訊號的包絡。
-
第二步:去除直流分量(減去自身均值)。
每一步結果的時域波形及頻譜如下(為了美觀,時域只顯示前 500 個點)。希爾伯特變換所得包絡的雙邊幅度譜中有五根離散的譜線(\(0Hz\)、\({\pm}1250Hz\)、\({\pm}2500Hz\))。去除直流後,只剩下調變訊號中的四根譜線(\({\pm}2500Hz\)、\({\pm}1250Hz\)),剩餘譜線可忽略,此時的時域波形就是 AM 非相干解調的結果。
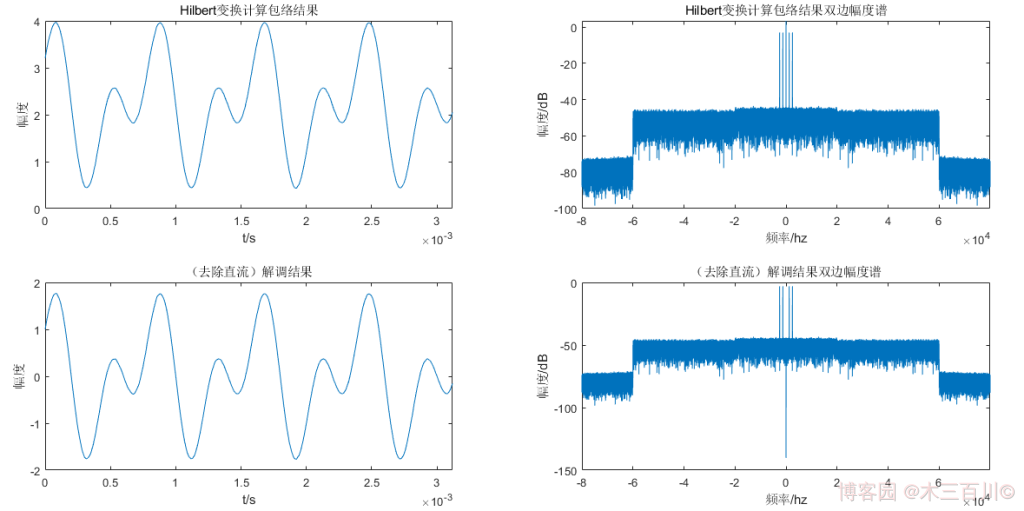
解調訊號 \(\hat{m}(t)\) 與調變訊號 \(m(t)\) 的對比效果如下:
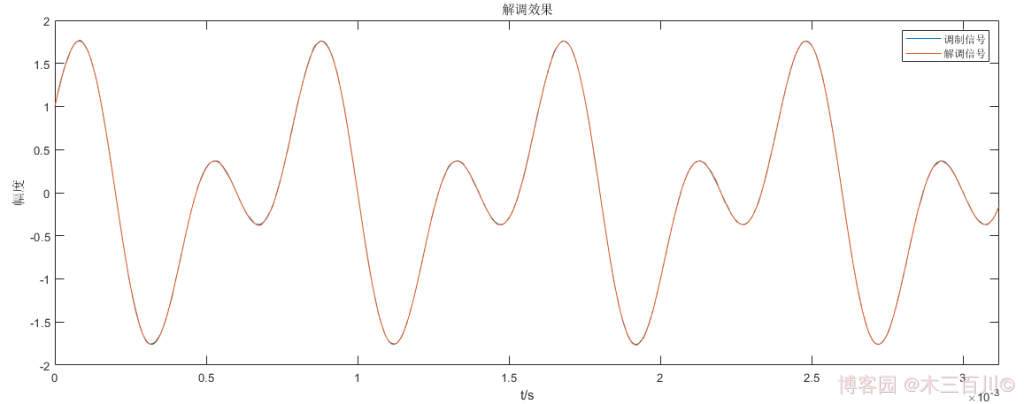
解調訊號與調變訊號波形基本重回,計算誤差,有:\(\sqrt{\sum{{\lvert}m(t_i)-\hat{m}(t_i){\rvert}^2}}/\sqrt{\sum{{\lvert}m(t_i){\rvert}^2}}\approx0.0054\)。程式碼詳見附錄 main_demodAM_example4.m 與 demod_am_method4.m。
3. AM 模擬(MATLAB Communications Toolbox)
MATLAB 的 Communications Toolbox 中提供了 AM 調變函數 ammod,高斯白噪聲函數 awgn,以及 AM 解調函數 amdemod,可以很方便地完成 AM 訊號模擬。使用這三個函數實現上面 1.2 節中確知訊號 \(m(t)\) 的 AM 調變解調,調變後加噪聲的效果如下:

解調效果如下:
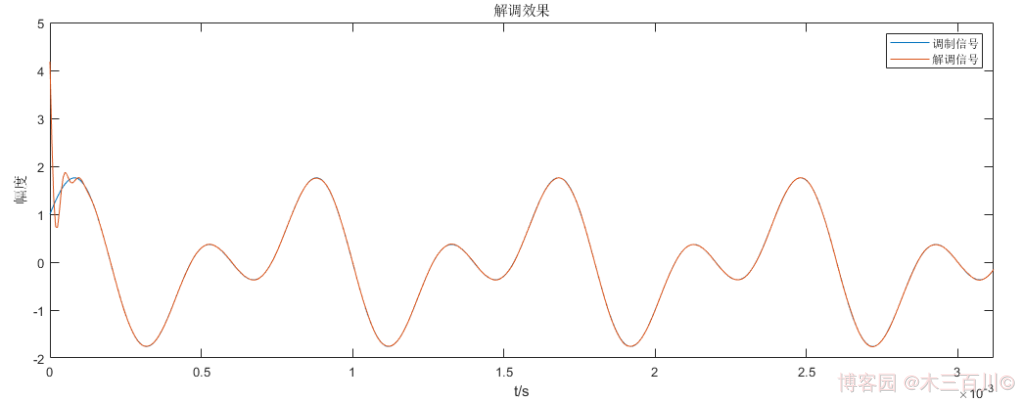
解調訊號與調變訊號波形基本重回,計算誤差,有:\(\sqrt{\sum{{\lvert}m(t_i)-\hat{m}(t_i){\rvert}^2}}/\sqrt{\sum{{\lvert}m(t_i){\rvert}^2}}\approx0.0074\)。程式碼詳見附錄 main_CommAM_example.m。
參考資料
[1] 樓才義,徐建良,楊小牛.軟體無線電原理與應用[M].電子工業出版社,2014.
[2] 樊昌信,曹麗娜.通訊原理.第7版[M].國防工業出版社,2012.
[3] CSDN - 幅度調變AM。
附錄程式碼
附.1 檔案 mod_am.m
function [ sig_am ] = mod_am(fc, beta, fs, mt, t)
% MOD_AM        AM 調幅
% 輸入引數:
%       fc      載波中心頻率
%       beta    調幅深度/調變指數
%       fs      訊號取樣率
%       mt      調變訊號
%       t       取樣時間
% 輸出引數:
%       sig_am  調幅(AM)實訊號
% @author 木三百川

% 計算直流分量
A0 = max(abs(mt))/beta;

% 生成訊號
ct = cos(2*pi*fc*t);      % 載波訊號
sig_am = (A0+mt).*ct;     % AM調幅訊號

% 繪圖
nfft = length(sig_am);
freq = (-nfft/2:nfft/2-1).'*(fs/nfft);
figure;set(gcf,'color','w');
plot_length = min(500, length(sig_am));
subplot(3,2,1);
plot(t(1:plot_length), mt(1:plot_length));xlim([t(1),t(plot_length)]);
xlabel('t/s');ylabel('幅度');title('調變訊號m(t)');
subplot(3,2,2);
plot(freq, 10*log10(fftshift(abs(fft(mt,nfft)/nfft))+eps));xlim([freq(1),freq(end)]);
xlabel('頻率/hz');ylabel('幅度/dB');title('調變訊號m(t)雙邊幅度譜');

subplot(3,2,3);
plot(t(1:plot_length), ct(1:plot_length));xlim([t(1),t(plot_length)]);
xlabel('t/s');ylabel('幅度');title('高頻載波c(t)');
subplot(3,2,4);
plot(freq, 10*log10(fftshift(abs(fft(ct,nfft)/nfft))+eps));xlim([freq(1),freq(end)]);
xlabel('頻率/hz');ylabel('幅度/dB');title('高頻載波c(t)雙邊幅度譜');

subplot(3,2,5);
plot(t(1:plot_length), sig_am(1:plot_length));xlim([t(1),t(plot_length)]);
xlabel('t/s');ylabel('幅度');title('AM調幅訊號s(t)');
subplot(3,2,6);
plot(freq, 10*log10(fftshift(abs(fft(sig_am,nfft)/nfft))+eps));xlim([freq(1),freq(end)]);
xlabel('頻率/hz');ylabel('幅度/dB');title('AM調幅訊號s(t)雙邊幅度譜');

end
附.2 檔案 main_modAM_example1.m
clc;
clear;
close all;
% AM 調變模擬(調變訊號為確知訊號)
% @author 木三百川

% 調變引數
fm = 2500;              % 調變訊號引數
beta = 0.8;             % 調幅深度/調變指數
fc = 20000;             % 載波頻率
fs = 8*fc;              % 取樣率
total_time = 2;         % 模擬時長,單位:秒

% 取樣時間
t = 0:1/fs:total_time-1/fs;

% 調變訊號為確知訊號
mt = sin(2*pi*fm*t)+cos(pi*fm*t);

% AM 調變
[ sig_am ] = mod_am(fc, beta, fs, mt, t);
附.3 檔案 main_modAM_example2.m
clc;
clear;
close all;
% AM 調變模擬(調變訊號為隨機訊號)
% @author 木三百川

% 調變引數
fH = 3000;          	% 基頻訊號頻寬
beta = 0.8;             % 調幅深度/調變指數
fc = 20000;             % 載波頻率
fs = 8*fc;              % 取樣率
total_time = 2;         % 模擬時長,單位:秒

% 取樣時間
t = 0:1/fs:total_time-1/fs;

% 調變訊號為隨機訊號
mt = randn(size(t));
b = fir1(512, fH/(fs/2), 'low');
mt = filter(b,1,mt);
mt = mt - mean(mt);

% AM 調變
[ sig_am ] = mod_am(fc, beta, fs, mt, t);
附.4 檔案 demod_am_method1.m
function [ sig_am_demod ] = demod_am_method1(sig_am_receive, fc, fs, t)
% DEMOD_AM_METHOD1        AM 非相干解調(包絡檢波)
% 輸入引數:
%       sig_am_receive      AM 接收訊號,行向量
%       fc                  載波中心頻率
%       fs                  訊號取樣率
%       t                   取樣時間
% 輸出引數:
%       sig_am_demod        解調結果,與 sig_am_receive 等長
% @author 木三百川

% 第一步:全波整流
sig_am_abs = abs(sig_am_receive);

% 第二步:低通濾波(補零進行時延修正)
b = fir1(256, fc/(fs/2), 'low');
sig_am_lpf = filter(b,1,[sig_am_abs,zeros(1, fix(length(b)/2))]);
sig_am_lpf = sig_am_lpf(fix(length(b)/2)+1:end);

% 第三步:去除直流分量
sig_am_demod = sig_am_lpf - mean(sig_am_lpf);

% 繪圖
nfft = length(sig_am_abs);
freq = (-nfft/2:nfft/2-1).'*(fs/nfft);
figure;set(gcf,'color','w');
plot_length = min(500, length(sig_am_abs));
subplot(3,2,1);
plot(t(1:plot_length), sig_am_abs(1:plot_length));xlim([t(1),t(plot_length)]);
xlabel('t/s');ylabel('幅度');title('全波整流結果');
subplot(3,2,2);
plot(freq, 10*log10(fftshift(abs(fft(sig_am_abs,nfft)/nfft))+eps));xlim([freq(1),freq(end)]);
xlabel('頻率/hz');ylabel('幅度/dB');title('全波整流結果雙邊幅度譜');

subplot(3,2,3);
plot(t(1:plot_length), sig_am_lpf(1:plot_length));xlim([t(1),t(plot_length)]);
xlabel('t/s');ylabel('幅度');title('低通濾波結果');
subplot(3,2,4);
plot(freq, 10*log10(fftshift(abs(fft(sig_am_lpf,nfft)/nfft))+eps));xlim([freq(1),freq(end)]);
xlabel('頻率/hz');ylabel('幅度/dB');title('低通濾波結果雙邊幅度譜');

subplot(3,2,5);
plot(t(1:plot_length), sig_am_demod(1:plot_length));xlim([t(1),t(plot_length)]);
xlabel('t/s');ylabel('幅度');title('(去除直流)解調結果');
subplot(3,2,6);
plot(freq, 10*log10(fftshift(abs(fft(sig_am_demod,nfft)/nfft))+eps));xlim([freq(1),freq(end)]);
xlabel('頻率/hz');ylabel('幅度/dB');title('(去除直流)解調結果雙邊幅度譜');

end
附.5 檔案 main_demodAM_example1.m
clc;
clear;
close all;
% AM 解調模擬(調變訊號為確知訊號,非相干解調/包絡檢波)
% @author 木三百川

% 調變引數
fm = 2500;              % 調變訊號引數
beta = 0.8;             % 調幅深度/調變指數
fc = 20000;             % 載波頻率
fs = 8*fc;              % 取樣率
total_time = 2;         % 模擬時長,單位:秒

% 取樣時間
t = 0:1/fs:total_time-1/fs;

% 調變訊號為確知訊號
mt = sin(2*pi*fm*t)+cos(pi*fm*t);

% AM 調變
[ sig_am_send ] = mod_am(fc, beta, fs, mt, t);

% 加噪聲
snr = 50;               % 訊雜比
sig_am_receive = awgn(sig_am_send, snr, 'measured');

% 非相干解調
[ sig_am_demod ] = demod_am_method1(sig_am_receive, fc, fs, t);

% 繪圖
nfft = length(sig_am_receive);
freq = (-nfft/2:nfft/2-1).'*(fs/nfft);
figure;set(gcf,'color','w');
plot_length = min(500, length(sig_am_receive));
subplot(1,2,1);
plot(t(1:plot_length), sig_am_receive(1:plot_length));xlim([t(1),t(plot_length)]);
xlabel('t/s');ylabel('幅度');title('AM接收訊號');
subplot(1,2,2);
plot(freq, 10*log10(fftshift(abs(fft(sig_am_receive,nfft)/nfft))+eps));xlim([freq(1),freq(end)]);
xlabel('頻率/hz');ylabel('幅度/dB');title('AM接收訊號雙邊幅度譜');

figure;set(gcf,'color','w');
plot(t(1:plot_length), mt(1:plot_length));xlim([t(1),t(plot_length)]);
hold on;
plot(t(1:plot_length), sig_am_demod(1:plot_length));xlim([t(1),t(plot_length)]);
xlabel('t/s');ylabel('幅度');title('解調效果');
legend('調變訊號','解調訊號');

coef = mean(abs(mt))/mean(abs(sig_am_demod));
fprintf('norm(調變訊號 - %.2f * 解調訊號)/norm(調變訊號) = %.4f.\n', coef, norm(mt-coef*sig_am_demod)/norm(mt));
附.6 檔案 demod_am_method2.m
function [ sig_am_demod ] = demod_am_method2(sig_am_receive, fc, fs, t, phi0)
% DEMOD_AM_METHOD2        AM 相干解調
% 輸入引數:
%       sig_am_receive      AM 接收訊號,行向量
%       fc                  載波中心頻率
%       fs                  訊號取樣率
%       t                   取樣時間
%       phi0                相干載波初始相位
% 輸出引數:
%       sig_am_demod        解調結果,與 sig_am_receive 等長
% @author 木三百川

% 第一步:乘以相干載波
ct = 2*cos(2*pi*fc*t+phi0);
sig_am_ct = sig_am_receive.*ct;

% 第二步:低通濾波(補零進行時延修正)
b = fir1(256, fc/(fs/2), 'low');
sig_am_lpf = filter(b,1,[sig_am_ct,zeros(1, fix(length(b)/2))]);
sig_am_lpf = sig_am_lpf(fix(length(b)/2)+1:end);

% 第三步:去除直流分量
sig_am_demod = sig_am_lpf - mean(sig_am_lpf);

% 繪圖
nfft = length(sig_am_ct);
freq = (-nfft/2:nfft/2-1).'*(fs/nfft);
figure;set(gcf,'color','w');
plot_length = min(500, length(sig_am_ct));
subplot(3,2,1);
plot(t(1:plot_length), sig_am_ct(1:plot_length));xlim([t(1),t(plot_length)]);
xlabel('t/s');ylabel('幅度');title('乘以相干載波結果');
subplot(3,2,2);
plot(freq, 10*log10(fftshift(abs(fft(sig_am_ct,nfft)/nfft))+eps));xlim([freq(1),freq(end)]);
xlabel('頻率/hz');ylabel('幅度/dB');title('乘以相干載波結果雙邊幅度譜');

subplot(3,2,3);
plot(t(1:plot_length), sig_am_lpf(1:plot_length));xlim([t(1),t(plot_length)]);
xlabel('t/s');ylabel('幅度');title('低通濾波結果');
subplot(3,2,4);
plot(freq, 10*log10(fftshift(abs(fft(sig_am_lpf,nfft)/nfft))+eps));xlim([freq(1),freq(end)]);
xlabel('頻率/hz');ylabel('幅度/dB');title('低通濾波結果雙邊幅度譜');

subplot(3,2,5);
plot(t(1:plot_length), sig_am_demod(1:plot_length));xlim([t(1),t(plot_length)]);
xlabel('t/s');ylabel('幅度');title('(去除直流)解調結果');
subplot(3,2,6);
plot(freq, 10*log10(fftshift(abs(fft(sig_am_demod,nfft)/nfft))+eps));xlim([freq(1),freq(end)]);
xlabel('頻率/hz');ylabel('幅度/dB');title('(去除直流)解調結果雙邊幅度譜');

end
附.7 檔案 main_demodAM_example2.m
clc;
clear;
close all;
% AM 解調模擬(調變訊號為確知訊號,相干解調)
% @author 木三百川

% 調變引數
fm = 2500;              % 調變訊號引數
beta = 0.8;             % 調幅深度/調變指數
fc = 20000;             % 載波頻率
fs = 8*fc;              % 取樣率
total_time = 2;         % 模擬時長,單位:秒

% 取樣時間
t = 0:1/fs:total_time-1/fs;

% 調變訊號為確知訊號
mt = sin(2*pi*fm*t)+cos(pi*fm*t);

% AM 調變
[ sig_am_send ] = mod_am(fc, beta, fs, mt, t);

% 加噪聲
snr = 50;               % 訊雜比
sig_am_receive = awgn(sig_am_send, snr, 'measured');

% 非相干解調
phi0 = 0;               % 相干載波初相位
[ sig_am_demod ] = demod_am_method2(sig_am_receive, fc, fs, t, phi0);

% 繪圖
nfft = length(sig_am_receive);
freq = (-nfft/2:nfft/2-1).'*(fs/nfft);
figure;set(gcf,'color','w');
plot_length = min(500, length(sig_am_receive));
subplot(1,2,1);
plot(t(1:plot_length), sig_am_receive(1:plot_length));xlim([t(1),t(plot_length)]);
xlabel('t/s');ylabel('幅度');title('AM接收訊號');
subplot(1,2,2);
plot(freq, 10*log10(fftshift(abs(fft(sig_am_receive,nfft)/nfft))+eps));xlim([freq(1),freq(end)]);
xlabel('頻率/hz');ylabel('幅度/dB');title('AM接收訊號雙邊幅度譜');

figure;set(gcf,'color','w');
plot(t(1:plot_length), mt(1:plot_length));xlim([t(1),t(plot_length)]);
hold on;
plot(t(1:plot_length), sig_am_demod(1:plot_length));xlim([t(1),t(plot_length)]);
xlabel('t/s');ylabel('幅度');title('解調效果');
legend('調變訊號','解調訊號');

coef = mean(abs(mt))/mean(abs(sig_am_demod));
fprintf('norm(調變訊號 - %.2f * 解調訊號)/norm(調變訊號) = %.4f.\n', coef, norm(mt-coef*sig_am_demod)/norm(mt));
附.8 檔案 demod_am_method3.m
function [ sig_am_demod ] = demod_am_method3(sig_am_receive, fc, fs, t, phi0)
% DEMOD_AM_METHOD3        AM 數位正交解調/相干解調
% 輸入引數:
%       sig_am_receive      AM 接收訊號,行向量
%       fc                  載波中心頻率
%       fs                  訊號取樣率
%       t                   取樣時間
%       phi0                相干載波初始相位
% 輸出引數:
%       sig_am_demod        解調結果,與 sig_am_receive 等長
% @author 木三百川

% 第一步:乘以正交相干載波
sig_am_i = 2*sig_am_receive.*cos(2*pi*fc*t+phi0);
sig_am_q = -2*sig_am_receive.*sin(2*pi*fc*t+phi0);

% 第二步:低通濾波(補零進行時延修正)
b = fir1(256, fc/(fs/2), 'low');
sig_am_i_lpf = filter(b,1,[sig_am_i,zeros(1,fix(length(b)/2))]);
sig_am_q_lpf = filter(b,1,[sig_am_q,zeros(1,fix(length(b)/2))]);
sig_am_i_lpf = sig_am_i_lpf(fix(length(b)/2)+1:end);
sig_am_q_lpf = sig_am_q_lpf(fix(length(b)/2)+1:end);

% 第三步:計算包絡
At = sqrt(sig_am_i_lpf.^2 + sig_am_q_lpf.^2);

% 第四步:去除直流分量
sig_am_demod = At - mean(At);

% 繪圖
nfft = length(sig_am_receive);
freq = (-nfft/2:nfft/2-1).'*(fs/nfft);
figure;set(gcf,'color','w');
plot_length = min(500, length(sig_am_receive));
subplot(2,2,1);
plot(t(1:plot_length), sig_am_i(1:plot_length));xlim([t(1),t(plot_length)]);
xlabel('t/s');ylabel('幅度');title('乘以正交相干載波 I 路結果');
subplot(2,2,2);
plot(freq, 10*log10(fftshift(abs(fft(sig_am_i,nfft)/nfft))+eps));xlim([freq(1),freq(end)]);
xlabel('頻率/hz');ylabel('幅度/dB');title('乘以正交相干載波 I 路結果雙邊幅度譜');
subplot(2,2,3);
plot(t(1:plot_length), sig_am_q(1:plot_length));xlim([t(1),t(plot_length)]);
xlabel('t/s');ylabel('幅度');title('乘以正交相干載波 Q 路結果');
subplot(2,2,4);
plot(freq, 10*log10(fftshift(abs(fft(sig_am_q,nfft)/nfft))+eps));xlim([freq(1),freq(end)]);
xlabel('頻率/hz');ylabel('幅度/dB');title('乘以正交相干載波 Q 路結果雙邊幅度譜');

figure;set(gcf,'color','w');
subplot(2,2,1);
plot(t(1:plot_length), sig_am_i_lpf(1:plot_length));xlim([t(1),t(plot_length)]);
xlabel('t/s');ylabel('幅度');title('低通濾波 I 路結果');
subplot(2,2,2);
plot(freq, 10*log10(fftshift(abs(fft(sig_am_i_lpf,nfft)/nfft))+eps));xlim([freq(1),freq(end)]);
xlabel('頻率/hz');ylabel('幅度/dB');title('低通濾波 I 路結果雙邊幅度譜');
subplot(2,2,3);
plot(t(1:plot_length), sig_am_q_lpf(1:plot_length));xlim([t(1),t(plot_length)]);
xlabel('t/s');ylabel('幅度');title('低通濾波 Q 路結果');
subplot(2,2,4);
plot(freq, 10*log10(fftshift(abs(fft(sig_am_q_lpf,nfft)/nfft))+eps));xlim([freq(1),freq(end)]);
xlabel('頻率/hz');ylabel('幅度/dB');title('低通濾波 Q 路結果雙邊幅度譜');

figure;set(gcf,'color','w');
subplot(2,2,1);
plot(t(1:plot_length), At(1:plot_length));xlim([t(1),t(plot_length)]);
xlabel('t/s');ylabel('幅度');title('計算包絡結果');
subplot(2,2,2);
plot(freq, 10*log10(fftshift(abs(fft(At,nfft)/nfft))+eps));xlim([freq(1),freq(end)]);
xlabel('頻率/hz');ylabel('幅度/dB');title('計算包絡結果雙邊幅度譜');
subplot(2,2,3);
plot(t(1:plot_length), sig_am_demod(1:plot_length));xlim([t(1),t(plot_length)]);
xlabel('t/s');ylabel('幅度');title('(去除直流)解調結果');
subplot(2,2,4);
plot(freq, 10*log10(fftshift(abs(fft(sig_am_demod,nfft)/nfft))+eps));xlim([freq(1),freq(end)]);
xlabel('頻率/hz');ylabel('幅度/dB');title('(去除直流)解調結果雙邊幅度譜');

end
附.9 檔案 main_demodAM_example3.m
clc;
clear;
close all;
% AM 解調模擬(調變訊號為確知訊號,數位正交解調/相干解調)
% @author 木三百川

% 調變引數
fm = 2500;              % 調變訊號引數
beta = 0.8;             % 調幅深度/調變指數
fc = 20000;             % 載波頻率
fs = 8*fc;              % 取樣率
total_time = 2;         % 模擬時長,單位:秒

% 取樣時間
t = 0:1/fs:total_time-1/fs;

% 調變訊號為確知訊號
mt = sin(2*pi*fm*t)+cos(pi*fm*t);

% AM 調變
[ sig_am_send ] = mod_am(fc, beta, fs, mt, t);

% 加噪聲
snr = 50;               % 訊雜比
sig_am_receive = awgn(sig_am_send, snr, 'measured');

% 非相干解調
phi0 = 0;               % 相干載波初相位
[ sig_am_demod ] = demod_am_method3(sig_am_receive, fc, fs, t, phi0);

% 繪圖
nfft = length(sig_am_receive);
freq = (-nfft/2:nfft/2-1).'*(fs/nfft);
figure;set(gcf,'color','w');
plot_length = min(500, length(sig_am_receive));
subplot(1,2,1);
plot(t(1:plot_length), sig_am_receive(1:plot_length));xlim([t(1),t(plot_length)]);
xlabel('t/s');ylabel('幅度');title('AM接收訊號');
subplot(1,2,2);
plot(freq, 10*log10(fftshift(abs(fft(sig_am_receive,nfft)/nfft))+eps));xlim([freq(1),freq(end)]);
xlabel('頻率/hz');ylabel('幅度/dB');title('AM接收訊號雙邊幅度譜');

figure;set(gcf,'color','w');
plot(t(1:plot_length), mt(1:plot_length));xlim([t(1),t(plot_length)]);
hold on;
plot(t(1:plot_length), sig_am_demod(1:plot_length));xlim([t(1),t(plot_length)]);
xlabel('t/s');ylabel('幅度');title('解調效果');
legend('調變訊號','解調訊號');

coef = mean(abs(mt))/mean(abs(sig_am_demod));
fprintf('norm(調變訊號 - %.2f * 解調訊號)/norm(調變訊號) = %.4f.\n', coef, norm(mt-coef*sig_am_demod)/norm(mt));
附.10 檔案 demod_am_method4.m
function [ sig_am_demod ] = demod_am_method4(sig_am_receive, fs, t)
% DEMOD_AM_METHOD1        AM 非相干解調(包絡檢波,Hilbert變換計算包絡)
% 輸入引數:
%       sig_am_receive      AM 接收訊號,行向量
%       fs                  訊號取樣率
%       t                   取樣時間
% 輸出引數:
%       sig_am_demod        解調結果,與 sig_am_receive 等長
% @author 木三百川

% 第一步:計算訊號包絡
sig_am_envelope = abs(hilbert(sig_am_receive));

% 第二步:去除直流分量
sig_am_demod = sig_am_envelope - mean(sig_am_envelope);

% 繪圖
nfft = length(sig_am_envelope);
freq = (-nfft/2:nfft/2-1).'*(fs/nfft);
figure;set(gcf,'color','w');
plot_length = min(500, length(sig_am_envelope));
subplot(2,2,1);
plot(t(1:plot_length), sig_am_envelope(1:plot_length));xlim([t(1),t(plot_length)]);
xlabel('t/s');ylabel('幅度');title('Hilbert變換計算包絡結果');
subplot(2,2,2);
plot(freq, 10*log10(fftshift(abs(fft(sig_am_envelope,nfft)/nfft))+eps));xlim([freq(1),freq(end)]);
xlabel('頻率/hz');ylabel('幅度/dB');title('Hilbert變換計算包絡結果雙邊幅度譜');
subplot(2,2,3);
plot(t(1:plot_length), sig_am_demod(1:plot_length));xlim([t(1),t(plot_length)]);
xlabel('t/s');ylabel('幅度');title('(去除直流)解調結果');
subplot(2,2,4);
plot(freq, 10*log10(fftshift(abs(fft(sig_am_demod,nfft)/nfft))+eps));xlim([freq(1),freq(end)]);
xlabel('頻率/hz');ylabel('幅度/dB');title('(去除直流)解調結果雙邊幅度譜');

end
附.11 檔案 main_demodAM_example4.m
clc;
clear;
close all;
% AM 解調模擬(調變訊號為確知訊號,非相干解調,包絡檢波,Hilbert變換計算包絡)
% @author 木三百川

% 調變引數
fm = 2500;              % 調變訊號引數
beta = 0.8;             % 調幅深度/調變指數
fc = 20000;             % 載波頻率
fs = 8*fc;              % 取樣率
total_time = 2;         % 模擬時長,單位:秒

% 取樣時間
t = 0:1/fs:total_time-1/fs;

% 調變訊號為確知訊號
mt = sin(2*pi*fm*t)+cos(pi*fm*t);

% AM 調變
[ sig_am_send ] = mod_am(fc, beta, fs, mt, t);

% 加噪聲
snr = 50;               % 訊雜比
sig_am_receive = awgn(sig_am_send, snr, 'measured');

% 非相干解調
[ sig_am_demod ] = demod_am_method4(sig_am_receive, fs, t);

% 繪圖
nfft = length(sig_am_receive);
freq = (-nfft/2:nfft/2-1).'*(fs/nfft);
figure;set(gcf,'color','w');
plot_length = min(500, length(sig_am_receive));
subplot(1,2,1);
plot(t(1:plot_length), sig_am_receive(1:plot_length));xlim([t(1),t(plot_length)]);
xlabel('t/s');ylabel('幅度');title('AM接收訊號');
subplot(1,2,2);
plot(freq, 10*log10(fftshift(abs(fft(sig_am_receive,nfft)/nfft))+eps));xlim([freq(1),freq(end)]);
xlabel('頻率/hz');ylabel('幅度/dB');title('AM接收訊號雙邊幅度譜');

figure;set(gcf,'color','w');
plot(t(1:plot_length), mt(1:plot_length));xlim([t(1),t(plot_length)]);
hold on;
plot(t(1:plot_length), sig_am_demod(1:plot_length));xlim([t(1),t(plot_length)]);
xlabel('t/s');ylabel('幅度');title('解調效果');
legend('調變訊號','解調訊號');

coef = mean(abs(mt))/mean(abs(sig_am_demod));
fprintf('norm(調變訊號 - %.2f * 解調訊號)/norm(調變訊號) = %.4f.\n', coef, norm(mt-coef*sig_am_demod)/norm(mt));
附.12 檔案 main_CommAM_example.m
clc;
clear;
close all;
% AM 調變解調模擬(使用Communications Toolbox工具箱)
% @author 木三百川

% 調變引數
fm = 2500;              % 調變訊號引數
beta = 0.8;             % 調幅深度/調變指數
fc = 20000;             % 載波頻率
fs = 8*fc;              % 取樣率
total_time = 2;         % 模擬時長,單位:秒

% 取樣時間
t = 0:1/fs:total_time-1/fs;

% 調變訊號為確知訊號
mt = sin(2*pi*fm*t)+cos(pi*fm*t);

% AM 調變
A0 = max(abs(mt))/beta;
ini_phase = 0;
sig_am_send = ammod(mt, fc, fs, ini_phase, A0);

% 加噪聲
snr = 50;               % 訊雜比
sig_am_receive = awgn(sig_am_send, snr, 'measured');

% AM 解調
[ sig_am_demod ] = amdemod(sig_am_receive, fc, fs, ini_phase, A0);

% 繪圖
nfft = length(sig_am_receive);
freq = (-nfft/2:nfft/2-1).'*(fs/nfft);
figure;set(gcf,'color','w');
plot_length = min(500, length(sig_am_receive));
subplot(1,2,1);
plot(t(1:plot_length), sig_am_receive(1:plot_length));xlim([t(1),t(plot_length)]);
xlabel('t/s');ylabel('幅度');title('AM接收訊號');
subplot(1,2,2);
plot(freq, 10*log10(fftshift(abs(fft(sig_am_receive,nfft)/nfft))+eps));xlim([freq(1),freq(end)]);
xlabel('頻率/hz');ylabel('幅度/dB');title('AM接收訊號雙邊幅度譜');

figure;set(gcf,'color','w');
plot(t(1:plot_length), mt(1:plot_length));xlim([t(1),t(plot_length)]);
hold on;
plot(t(1:plot_length), sig_am_demod(1:plot_length));xlim([t(1),t(plot_length)]);
xlabel('t/s');ylabel('幅度');title('解調效果');
legend('調變訊號','解調訊號');

coef = mean(abs(mt))/mean(abs(sig_am_demod));
fprintf('norm(調變訊號 - %.2f * 解調訊號)/norm(調變訊號) = %.4f.\n', coef, norm(mt-coef*sig_am_demod)/norm(mt));
本文作者:木三百川
本文連結:https://www.cnblogs.com/young520/p/17539846.html
版權宣告:本文系博主原創文章,著作權歸作者所有。商業轉載請聯絡作者獲得授權,非商業轉載請附上出處連結。遵循 署名-非商業性使用-相同方式共用 4.0 國際版 (CC BY-NC-SA 4.0) 版權協定。