【QCustomPlot】效能提升之修改原始碼(版本 V2.x.x)
說明
QCustomPlot 是開源專案,原始碼編寫十分規範,想要理解它的視覺化思路不算特別困難。我在這篇隨筆中總結一下常用的原始碼修改技巧,下面的每一個技巧都是獨立的,不同技巧中新增的程式碼無任何依賴關係,相互之間也不會引發任何衝突,不會影響 QCustomPlot 原生的介面。範例中使用的 QCustomPlot 版本號為 2.0.1,但在更高的 2.x.x 版本中也適用。
1. 技巧一:啟用 GPU 加速
這裡選用 FreeGlut 庫。
1.1 下載並編譯 FreeGlut 庫
去 https://freeglut.sourceforge.net/index.php 下載 freeglut 原始碼,編譯出 freeglut 庫,編譯過程不做介紹。然後將編譯出來的庫以及 GL 資料夾下的五個標頭檔案都包含進專案中,我使用的是 MSVC2015 64bit 靜態庫,因此在 pro/pri 檔案中新增以下程式碼(因人而異):
HEADERS += \
    $$PWD/GL/freeglut.h \
    $$PWD/GL/freeglut_ext.h \
    $$PWD/GL/freeglut_std.h \
    $$PWD/GL/freeglut_ucall.h \
    $$PWD/GL/glut.h

CONFIG(debug, debug | release) {
    LIBS += -L$$PWD/lib64 -lfreeglut_staticd
    LIBS += -L$$PWD/lib64 -lfreeglutd
}

CONFIG(release, debug | release) {
    LIBS += -L$$PWD/lib64 -lfreeglut_static
    LIBS += -L$$PWD/lib64 -lfreeglut
}
1.2 在 qcustomplot.cpp 檔案中新增程式碼
在檔案的前面幾行(比如 #include "qcustomplot.h" 的後面)新增以下程式碼:
#define GLUT_DISABLE_ATEXIT_HACK
#include <GL/freeglut.h>
若同一個介面上有多個 QCustimPlot 視窗物件,且都開啟了 GPU 加速,則在視窗切換時圖形顯示可能會出現錯亂(被稱為上下文異常),為了避免這種現象,需要在 QCPPaintBufferGlFbo::draw 函數裡面新增以下程式碼:
/* inherits documentation from base class */
void QCPPaintBufferGlFbo::draw(QCPPainter *painter) const
{
    if (!painter || !painter->isActive())
    {
        qDebug() << Q_FUNC_INFO << "invalid or inactive painter passed";
        return;
    }
    if (!mGlFrameBuffer)
    {
        qDebug() << Q_FUNC_INFO << "OpenGL frame buffer object doesn't exist, reallocateBuffer was not called?";
        return;
    }

    // 這個 if 語句是新新增的
    if(QOpenGLContext::currentContext() != mGlContext.data())
    {
        mGlContext.data()->makeCurrent(mGlContext.data()->surface());
    }

    painter->drawImage(0, 0, mGlFrameBuffer->toImage());
}
1.3 在 pro 檔案中新增程式碼
在 pro 檔案中,新增以下程式碼:
QT       += printsupport opengl
DEFINES += QCUSTOMPLOT_USE_OPENGL
這個 printsupport 是使用 QCustomPlot 時需要新增的,不論是否啟用 GPU 加速都需要新增。後面的 opengl 則是為了啟用 GPU 加速而新添的,此外,還需要使用 DEFINES 新增 QCUSTOMPLOT_USE_OPENGL 宏。
1.4 啟用 GPU 加速
對 QCustomPlot 物件使用 setOpenGl() 函數設定是否啟用 OpenGL,如下所示:
ui->Plot->setOpenGl(true);
可以通過 openGl() 函數的返回值判斷是否成功啟用了 GPU 加速:
qDebug() << "啟用狀態" << ui->Plot->openGl();
需要注意的是,當繪製的圖形有大塊填充區域,尤其是半透明的填充時,GPU 加速的效果才明顯,這個時候才能減輕 CPU 壓力。如果僅僅繪製一些簡單的曲線圖還開啟 OpenGL,結果往往會適得其反,CPU 壓力不減反增,有興趣的可以進行測試,開啟工作管理員觀察啟用前後 CPU 的佔用百分比即可。
1.5 加速效果
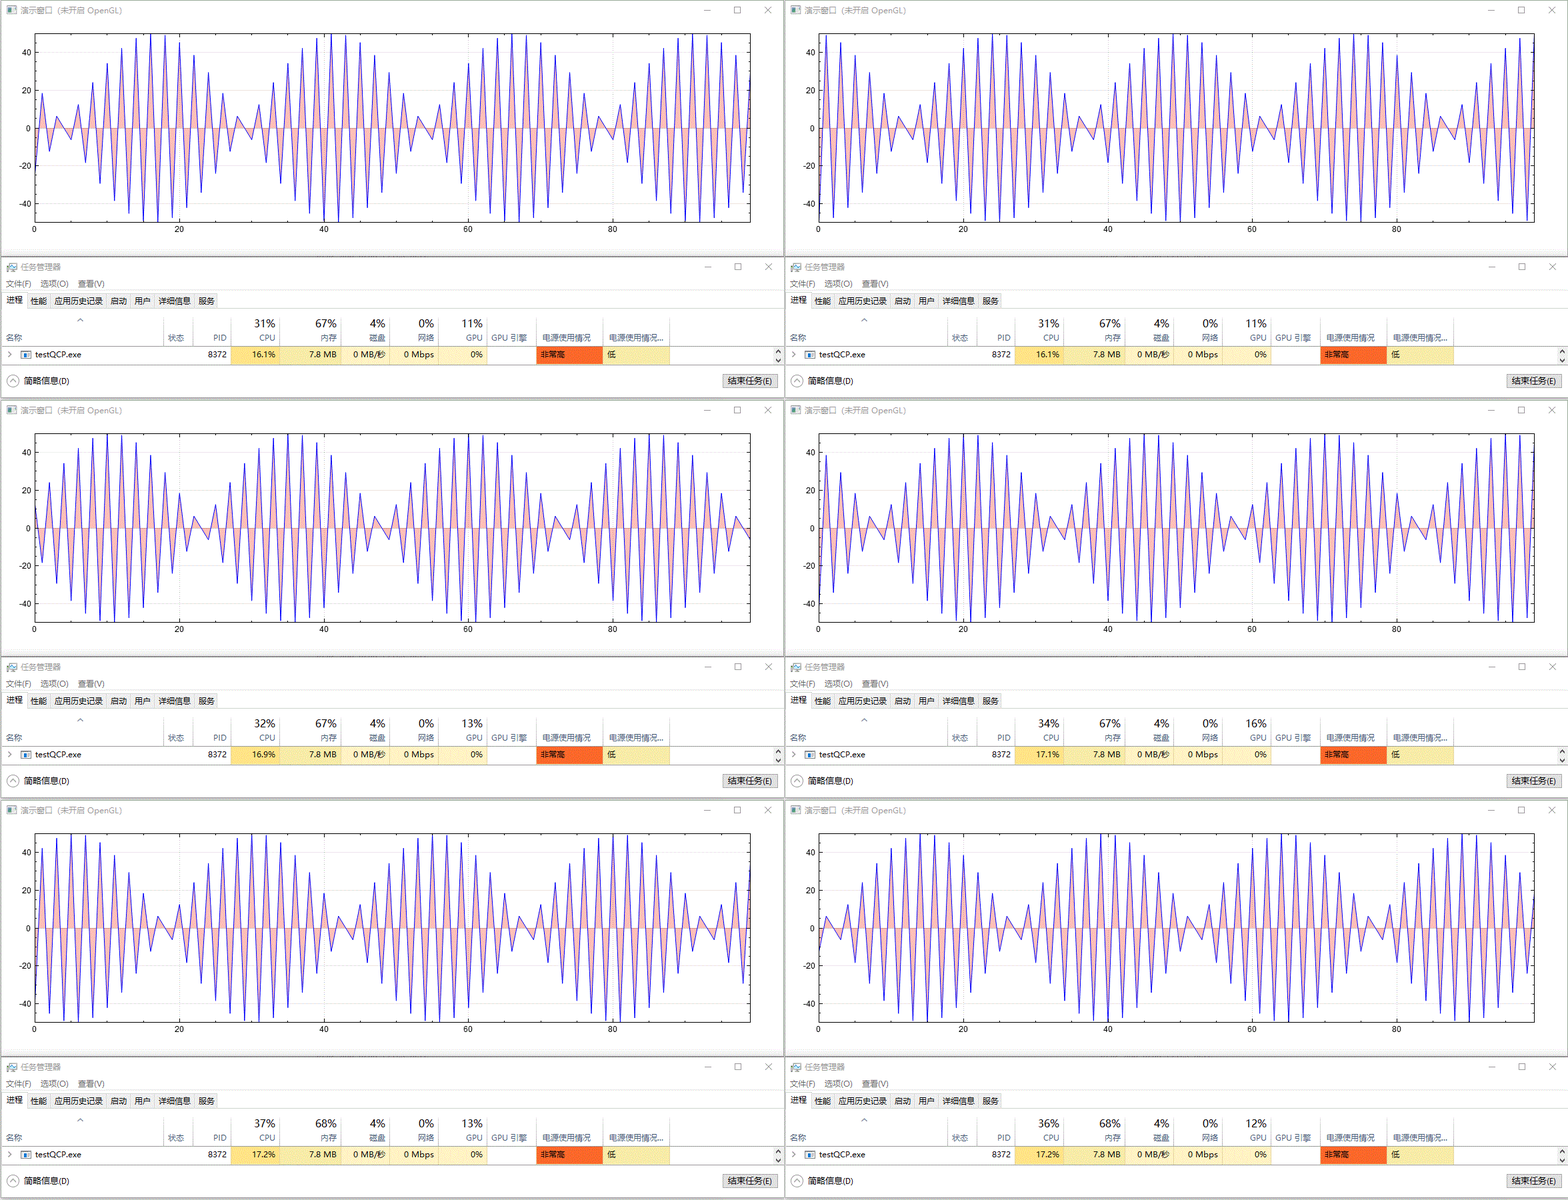
繪製實時更新的、含有填充區域的影象,未開啟 GPU 加速前的效果:

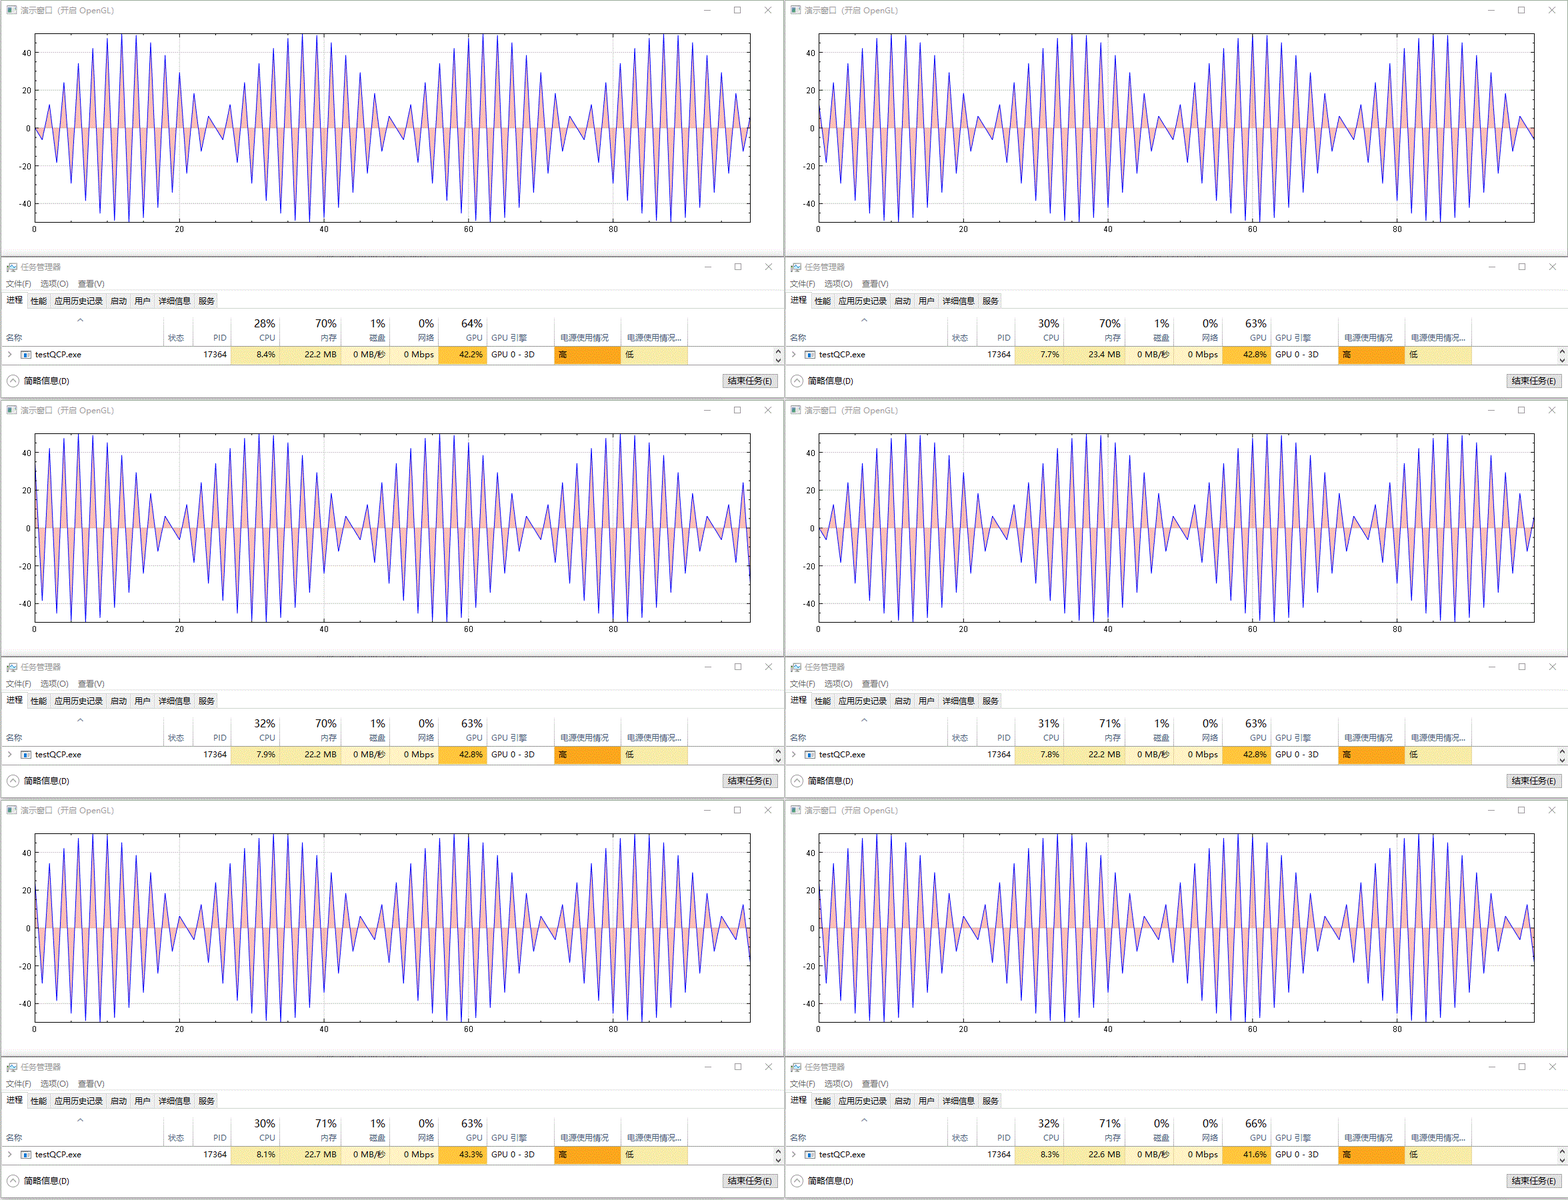
開啟 GPU 加速後的效果:

以上演範例中並沒有更改資料重新整理頻率(都為 10 ms 間隔)及資料量大小(都為 100 個點),兩者僅有的差別為是否呼叫了 setOpenGl(true) 開啟了 GPU 加速。從結果中可以看到,開啟 OpenGL 後,CPU 佔用率從 16%~17% 下降到 7%~8%,GPU 佔用率從 0% 上升到 41%~43%,並且從視覺效果上看,重新整理變得更快了,這可能是因為 CPU 被減輕了壓力,單次計算後顯示所需時間更短了。
2. 技巧二:新增曲線平滑功能
思路是先計算貝塞爾控制點,然後使用 QPainterPath 繪製平滑曲線,參考資料:
2.1 在 qcustomplot.h 檔案中新增程式碼
在原生的 class QCP_LIB_DECL QCPGraph 類定義中(使用搜尋功能找到對應位置)新增以下兩個內容,注意 public 與 protected 限定符:
class QCP_LIB_DECL QCPGraph : public QCPAbstractPlottable1D<QCPGraphData>
{
public:
    ...
    void setSmooth(bool smooth);             // 新增內容

protected:
    ...
    bool mSmooth;                            // 新增內容
}
在 qcustomplot.h 檔案的末尾(#endif 的上一行)新增 SmoothCurveGenerator 類定義的程式碼:
class SmoothCurveGenerator
{
protected:
    static QPainterPath generateSmoothCurveImp(const QVector<QPointF> &points) {
        QPainterPath path;
        int len = points.size();

        if (len < 2) {
            return path;
        }

        QVector<QPointF> firstControlPoints;
        QVector<QPointF> secondControlPoints;
        calculateControlPoints(points, &firstControlPoints, &secondControlPoints);

        path.moveTo(points[0].x(), points[0].y());

        // Using bezier curve to generate a smooth curve.
        for (int i = 0; i < len - 1; ++i) {
            path.cubicTo(firstControlPoints[i], secondControlPoints[i], points[i+1]);
        }

        return path;
    }
public:
    static QPainterPath generateSmoothCurve(const QVector<QPointF> &points) {
        QPainterPath result;

        int segmentStart = 0;
        int i = 0;
        int pointSize = points.size();
        while (i < pointSize) {
            if (qIsNaN(points.at(i).y()) || qIsNaN(points.at(i).x()) || qIsInf(points.at(i).y())) {
                QVector<QPointF> lineData(i - segmentStart); std::copy(points.constBegin() + segmentStart, points.constBegin() + i - segmentStart, lineData.begin());
                result.addPath(generateSmoothCurveImp(lineData));
                segmentStart = i + 1;
            }
            ++i;
        }
        QVector<QPointF> lineData(i - segmentStart); std::copy(points.constBegin() + segmentStart, points.constBegin() + i - segmentStart, lineData.begin());
        result.addPath(generateSmoothCurveImp(lineData));
        return result;
    }

    static QPainterPath generateSmoothCurve(const QPainterPath &basePath, const QVector<QPointF> &points) {
        if (points.isEmpty()) return basePath;

        QPainterPath path = basePath;
        int len = points.size();
        if (len == 1) {
            path.lineTo(points.at(0));
            return path;
        }

        QVector<QPointF> firstControlPoints;
        QVector<QPointF> secondControlPoints;
        calculateControlPoints(points, &firstControlPoints, &secondControlPoints);

        path.lineTo(points.at(0));
        for (int i = 0; i < len - 1; ++i)
            path.cubicTo(firstControlPoints[i], secondControlPoints[i], points[i+1]);

        return path;
    }

    static void calculateFirstControlPoints(double *&result, const double *rhs, int n) {
        result = new double[n];
        double *tmp = new double[n];
        double b = 2.0;
        result[0] = rhs[0] / b;

        // Decomposition and forward substitution.
        for (int i = 1; i < n; i++) {
            tmp[i] = 1 / b;
            b = (i < n - 1 ? 4.0 : 3.5) - tmp[i];
            result[i] = (rhs[i] - result[i - 1]) / b;
        }

        for (int i = 1; i < n; i++) {
            result[n - i - 1] -= tmp[n - i] * result[n - i]; // Backsubstitution.
        }

        delete[] tmp;
    }

    static void calculateControlPoints(const QVector<QPointF> &knots,
                                       QVector<QPointF> *firstControlPoints,
                                       QVector<QPointF> *secondControlPoints) {
        int n = knots.size() - 1;

        firstControlPoints->reserve(n);
        secondControlPoints->reserve(n);

        for (int i = 0; i < n; ++i) {
            firstControlPoints->append(QPointF());
            secondControlPoints->append(QPointF());
        }

        if (n == 1) {
            // Special case: Bezier curve should be a straight line.
            // P1 = (2P0 + P3) / 3
            (*firstControlPoints)[0].rx() = (2 * knots[0].x() + knots[1].x()) / 3;
            (*firstControlPoints)[0].ry() = (2 * knots[0].y() + knots[1].y()) / 3;

            // P2 = 2P1 – P0
            (*secondControlPoints)[0].rx() = 2 * (*firstControlPoints)[0].x() - knots[0].x();
            (*secondControlPoints)[0].ry() = 2 * (*firstControlPoints)[0].y() - knots[0].y();

            return;
        }

        // Calculate first Bezier control points
        double *xs = nullptr;
        double *ys = nullptr;
        double *rhsx = new double[n]; // Right hand side vector
        double *rhsy = new double[n]; // Right hand side vector

        // Set right hand side values
        for (int i = 1; i < n - 1; ++i) {
            rhsx[i] = 4 * knots[i].x() + 2 * knots[i + 1].x();
            rhsy[i] = 4 * knots[i].y() + 2 * knots[i + 1].y();
        }
        rhsx[0] = knots[0].x() + 2 * knots[1].x();
        rhsx[n - 1] = (8 * knots[n - 1].x() + knots[n].x()) / 2.0;
        rhsy[0] = knots[0].y() + 2 * knots[1].y();
        rhsy[n - 1] = (8 * knots[n - 1].y() + knots[n].y()) / 2.0;

        // Calculate first control points coordinates
        calculateFirstControlPoints(xs, rhsx, n);
        calculateFirstControlPoints(ys, rhsy, n);

        // Fill output control points.
        for (int i = 0; i < n; ++i) {
            (*firstControlPoints)[i].rx() = xs[i];
            (*firstControlPoints)[i].ry() = ys[i];

            if (i < n - 1) {
                (*secondControlPoints)[i].rx() = 2 * knots[i + 1].x() - xs[i + 1];
                (*secondControlPoints)[i].ry() = 2 * knots[i + 1].y() - ys[i + 1];
            } else {
                (*secondControlPoints)[i].rx() = (knots[n].x() + xs[n - 1]) / 2;
                (*secondControlPoints)[i].ry() = (knots[n].y() + ys[n - 1]) / 2;
            }
        }

        delete xs;
        delete ys;
        delete[] rhsx;
        delete[] rhsy;
    }
};
2.2 在 qcustomplot.cpp 檔案中新增程式碼
在原生的 QCPGraph::QCPGraph(QCPAxis *keyAxis, QCPAxis *valueAxis) 建構函式(使用搜尋功能找到對應位置)實現中,新增 mSmooth 成員變數的初始化程式碼:
QCPGraph::QCPGraph(QCPAxis *keyAxis, QCPAxis *valueAxis) :
  QCPAbstractPlottable1D<QCPGraphData>(keyAxis, valueAxis)
{
    ...
    mSmooth = false;  // 新增內容
}
在對應位置新增 QCPGraph::setSmooth() 成員函數的實現(比如寫在 void QCPGraph::setAdaptiveSampling(bool enabled) 的後面):
void QCPGraph::setSmooth(bool smooth)
{
    mSmooth = smooth;
}
將原生的 QCPGraph::drawLinePlot 成員函數(使用搜尋功能找到對應位置)修改為如下形式,實質上只新增了個 if 語句:
void QCPGraph::drawLinePlot(QCPPainter *painter, const QVector<QPointF> &lines) const
{
    if (painter->pen().style() != Qt::NoPen && painter->pen().color().alpha() != 0)
    {
        applyDefaultAntialiasingHint(painter);
        if (mSmooth && mLineStyle == lsLine) painter->drawPath(SmoothCurveGenerator::generateSmoothCurve(lines));
        else drawPolyline(painter, lines);
    }
}
2.3 啟用曲線平滑
對 QCPGraph 物件使用 setSmooth() 函數設定是否啟用曲線平滑,如下所示:
ui->Plot->graph(0)->setSmooth(true);
2.4 平滑效果
繪製 50 個點,未啟用曲線平滑時的效果:

啟用曲線平滑時的效果:

3. 技巧三:匯出一維繪圖資料地址
3.1 一維繪圖資料的記憶體結構
一維繪圖資料都儲存在 QCPDataContainer 這個類裡面,繪圖資料儲存的容器為 QVector<DataType>,詳見 qcustomplot.h 檔案中 QCPDataContainer 的類定義。不同的一維繪圖型別有著不同的底層資料型別:
- 對於
QCPGraph繪圖型別,這個DataType為QCPGraphData,檢視QCPGraphData類定義,它有且僅有兩個double型別的成員變數key和value。因此QCPGraph的繪圖資料被儲存在一塊連續的記憶體塊中(類似於double陣列),繪圖資料在記憶體中按順序x0-y0-x1-y1-x2-y2...這樣依次排列,xi和yi分別表示第i個橫軸資料和第i個縱軸資料。 - 對於
QCPCurve繪圖型別,這個DataType為QCPCurveData,檢視QCPCurveData類定義,它有且僅有三個double型別的成員變數t、key和value。因此QCPCurve的繪圖資料在記憶體中按順序t0-x0-y0-t1-x1-y1-t2-x2-y2...這樣依次排列,這個t表示引數曲線對應的參變數。 - 對於
QCPBars繪圖型別,這個DataType為QCPBarsData,檢視QCPBarsData類定義,它有且僅有兩個double型別的成員變數key和value。因此QCPBars繪圖資料與QCPGraph繪圖資料的記憶體排列方式一樣。 QCPStatisticalBox與QCPFinancial這兩個繪圖型別就相對複雜些,但不變的是,繪圖資料仍被依次儲存在一塊連續的記憶體塊中,感興趣的可以看下QCPStatisticalBoxData與QCPFinancialData的類定義。
更新一維繪圖資料時,QCustomPlot 提供了一些介面,分別為:
// QCPGraph 4個介面
void setData(QSharedPointer<QCPGraphDataContainer> data)
void setData(const QVector<double> &keys, const QVector<double> &values, bool alreadySorted=false)
void addData(const QVector<double> &keys, const QVector<double> &values, bool alreadySorted=false)
void addData(double key, double value)

// QCPCurve 7個介面
void setData(QSharedPointer<QCPCurveDataContainer> data)
void setData(const QVector<double> &t, const QVector<double> &keys, const QVector<double> &values, bool alreadySorted=false)
void setData(const QVector<double> &keys, const QVector<double> &values)
void addData(const QVector<double> &t, const QVector<double> &keys, const QVector<double> &values, bool alreadySorted=false)
void addData(const QVector<double> &keys, const QVector<double> &values)
void addData(double t, double key, double value)
void addData(double key, double value)

// QCPBars 4個介面
void setData(QSharedPointer<QCPBarsDataContainer > data)
void setData(const QVector< double > &keys, const QVector<double> &values, bool alreadySorted=false)
void addData(const QVector< double > &keys, const QVector<double> &values, bool alreadySorted=false)
void addData(double key, double value)

// QCPStatisticalBox 4個介面
void setData(QSharedPointer<QCPStatisticalBoxDataContainer> data)
void setData(const QVector<double> &keys, const QVector<double> &minimum, const QVector<double> &lowerQuartile, const QVector<double> &median, const QVector<double> &upperQuartile, const QVector<double> &maximum, bool alreadySorted=false)
void addData(const QVector<double> &keys, const QVector<double> &minimum, const QVector<double> &lowerQuartile, const QVector<double> &median, const QVector<double> &upperQuartile, const QVector<double> &maximum, bool alreadySorted=false)
void addData(double key, double minimum, double lowerQuartile, double median, double upperQuartile, double maximum, const QVector<double> &outliers=QVector<double>())

// QCPFinancial 4個介面
void setData(QSharedPointer<QCPFinancialDataContainer> data)
void setData(const QVector<double> &keys, const QVector<double> &open, const QVector<double> &high, const QVector<double> &low, const QVector<double> &close, bool alreadySorted=false)
void addData(const QVector<double> &keys, const QVector<double> &open, const QVector<double> &high, const QVector<double> &low, const QVector<double> &close, bool alreadySorted=false)
void addData(double key, double open, double high, double low, double close)
其中第一個介面暴露出來的指標並沒有直接指向繪圖資料所在記憶體的首地址,也無法通過這個指標來獲得 QVector<DataType> 這個容器的地址。除第一個介面外,原生的 setData() 與 addData() 介面內部都會呼叫 QVector 相關的 resize()、size()、std::sort()、std::inplace_merge() 等函數,還存在很多 if 語句。在一些時候,特別是資料點數固定但數值更新速率很高時,頻繁的呼叫 size() 等函數會大大延長重新整理時間,此時原生介面中的很多操作都是不必要的,因此不妨直接將儲存繪圖資料的 QVector<DataType> 容器地址交給使用者,以獲得更佳的效能,縮短更新時間。
3.2 在 qcustomplot.h 檔案中新增程式碼
在 QCPDataContainer 類定義的 public 區域,新增以下一行程式碼即可:
template <class DataType>
class QCPDataContainer // no QCP_LIB_DECL, template class ends up in header (cpp included below)
{
public:
    ...

    // 新添內容
    QVector<DataType>* coreData() { return &mData; }
}
3.3 使用繪圖資料地址來更新資料
對相應的繪圖物件使用 coreData() 函數獲得繪圖資料的地址,如下所示:
QVector<QCPGraphData> *mData = ui->Plot->graph(0)->data()->coreData();
得到這個地址後,就可以用陣列存取的方式逐點更新資料,或者使用 memcpy() 做一次更新。後面繪圖時會預設資料已經排好了序,不會再進行排序操作,因此若需要重排資料順序,需人工提前排好。
// 可能需要預分配容器記憶體,預分配記憶體僅需一次
mData->reserve(totalSize);
mData->resize(totalSize);

// 逐點更新 xi = 5.0;
(*mData)[i].key = 5.0;

// 逐點更新 yi = sin(5.0);
(*mData)[i].value = sin(5.0);

// 一次更新
memcpy((char*)mData, (char*)pData, sizeof(double)*totalSize*2);
注意:使用 memcpy() 一次更新時,這個 pData 為儲存新資料的記憶體首地址,pData 所指空間中資料的排列方式必須和對應繪圖資料的記憶體排列方式保持一致。
4. 技巧四:匯出 QCPColorMap 繪圖資料地址
4.1 QCPColorMap 繪圖資料的記憶體結構
QCPColorMap 繪圖資料儲存在 QCPColorMapData 這個類裡面,詳見 qcustomplot.h 檔案中 QCPColorMapData 的類定義,繪圖資料儲存的容器為一維 double 陣列,按行進行儲存,縱座標小的排在陣列前面。縱座標最小的一行排在陣列最前面,縱座標最大的一行排在陣列最後面;儲存每行時,橫座標最小的排在陣列前面,橫座標最大的排在陣列後面。QCustomPlot 提供的資料更新介面有:
// QCPColorMapData
void setData(double key, double value, double z)
void setCell(int keyIndex, int valueIndex, double z)
void fill(double z)

// QCPColorMap
void setData(QCPColorMapData *data, bool copy=false)
同樣在資料點數固定但數值更新速率很高時,原生介面中的很多操作都是不必要的。
4.2 在 qcustomplot.h 檔案中新增程式碼
在 QCPColorMapData 類定義的 public 區域,新增以下一行程式碼即可:
class QCP_LIB_DECL QCPColorMapData
{
public:
    ...

    // 新添內容
    double *coreData() { mDataModified = true; return mData; }
}
4.3 使用繪圖資料地址來更新資料
對 QCPColorMap 物件使用 coreData() 函數獲得繪圖資料的地址,如下所示:
double *mData = m_pColorMap->data()->coreData();
得到這個地址後,就可以用陣列存取的方式逐點更新資料,或者使用 memcpy() 做一次更新。
// 不要在外部使用 new 來分配記憶體,而應使用原生介面來做記憶體預分配
m_pColorMap->data()->setSize(xsize, ysize);

// 逐點更新 m[xi][yj] = 5.0; 其中 xi,yj 為非負整型索引值
mData[(yj-1)*xsize+xi] = 5.0;

// 一次更新
memcpy((char*)mData, (char*)pData, sizeof(double)*xsize*ysize);
注意:使用 memcpy() 一次更新時,這個 pData 為儲存新資料的記憶體首地址,pData 所指空間中資料的排列方式必須和 QCPColorMap 繪圖資料的記憶體排列方式保持一致。
本文作者:木三百川
本文連結:https://www.cnblogs.com/young520/p/17441950.html
版權宣告:本文系博主原創文章,著作權歸作者所有。商業轉載請聯絡作者獲得授權,非商業轉載請附上出處連結。遵循 署名-非商業性使用-相同方式共用 4.0 國際版 (CC BY-NC-SA 4.0) 版權協定。