地圖:leaflet基本使用
2023-03-31 18:00:36
leaflet:一個開源並且對行動端友好的互動式地圖 JavaScript 庫
中文檔案:https://leafletjs.cn/reference.html
官網(英文):https://iclient.supermap.io/examples/leaflet/examples.html
該專案基於vue3+ts搭建
專案地址 gitee:https://gitee.com/philippines-kisses-snow/leaflet-map
地圖組成與名詞解釋
建議在學習之前先了解一些相關名詞,以便理解:
高德官網的名詞解釋:https://lbs.amap.com/api/javascript-api/guide/abc/components
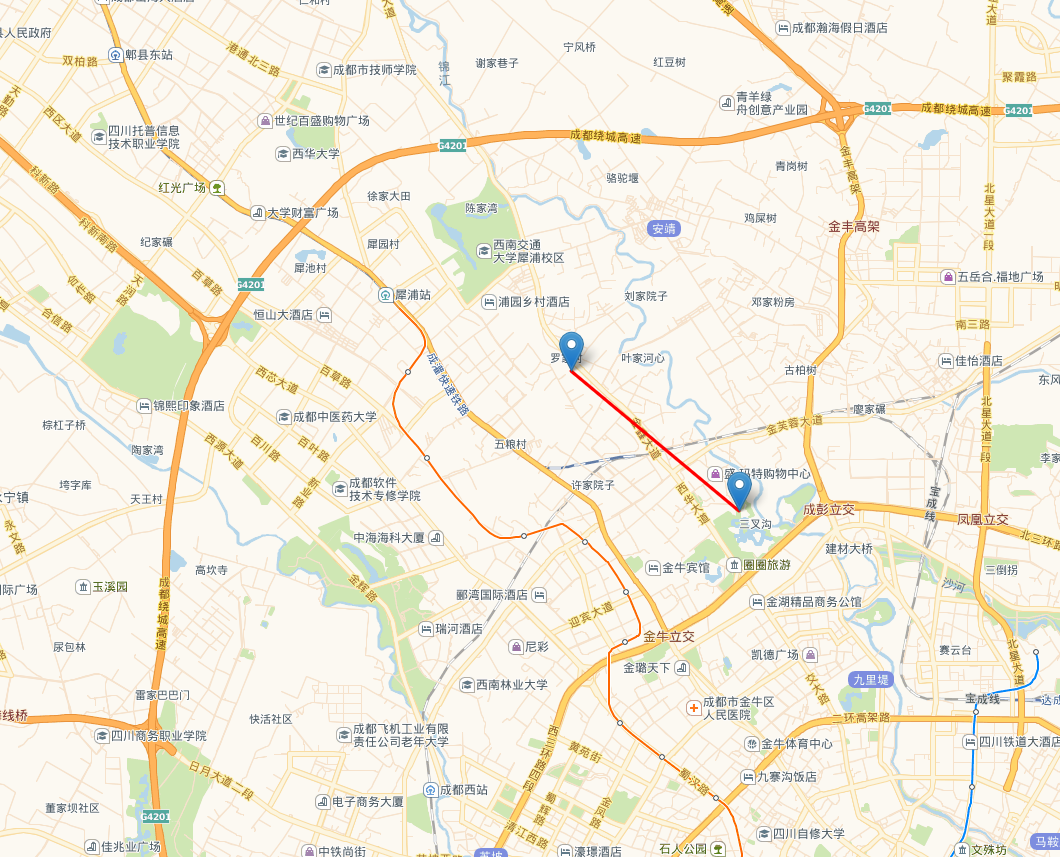
效果:

下載庫:
npm i leaflet
引入css:
// main.ts
import "leaflet/dist/leaflet.css"
在元件中使用leaflet:
- 引入:
import L from 'leaflet'
若引入時leaflet沒有型別檔案報錯,需在.d.ts檔案中加入:
// shims-vue.d.ts
declare module 'leaflet';
- 新增HTML地圖節點,節點需要有寬高
<div id="map"></div>
- 初始化:
import { onMounted } from 'vue';

/*
 * layer: 地圖切片地址,用於顯示地圖,該切片地址為高德地圖使用的地址
 * 具體出處在高德官網並未找到,從相關部落格推測可能是某個大佬抓包或其他方式獲取到的
 * 相關部落格:https://blog.csdn.net/fredricen/article/details/77189453
 */
const layer = L.tileLayer('http://webrd01.is.autonavi.com/appmaptile?lang=zh_cn&size=1&scale=1&style=7&x={x}&y={y}&z={z}')
let map: any = {}

onMounted(() => {
  // 'map'為HTML節點id
  map = L.map('map', {
    center: [30.745922638363268, 104.00415658374735],//中心座標
    zoom: 10,//縮放級別
    zoomControl: true, //縮放元件
    attributionControl: false, //去掉右下角logol
    layers: [layer],//圖層
  })
})
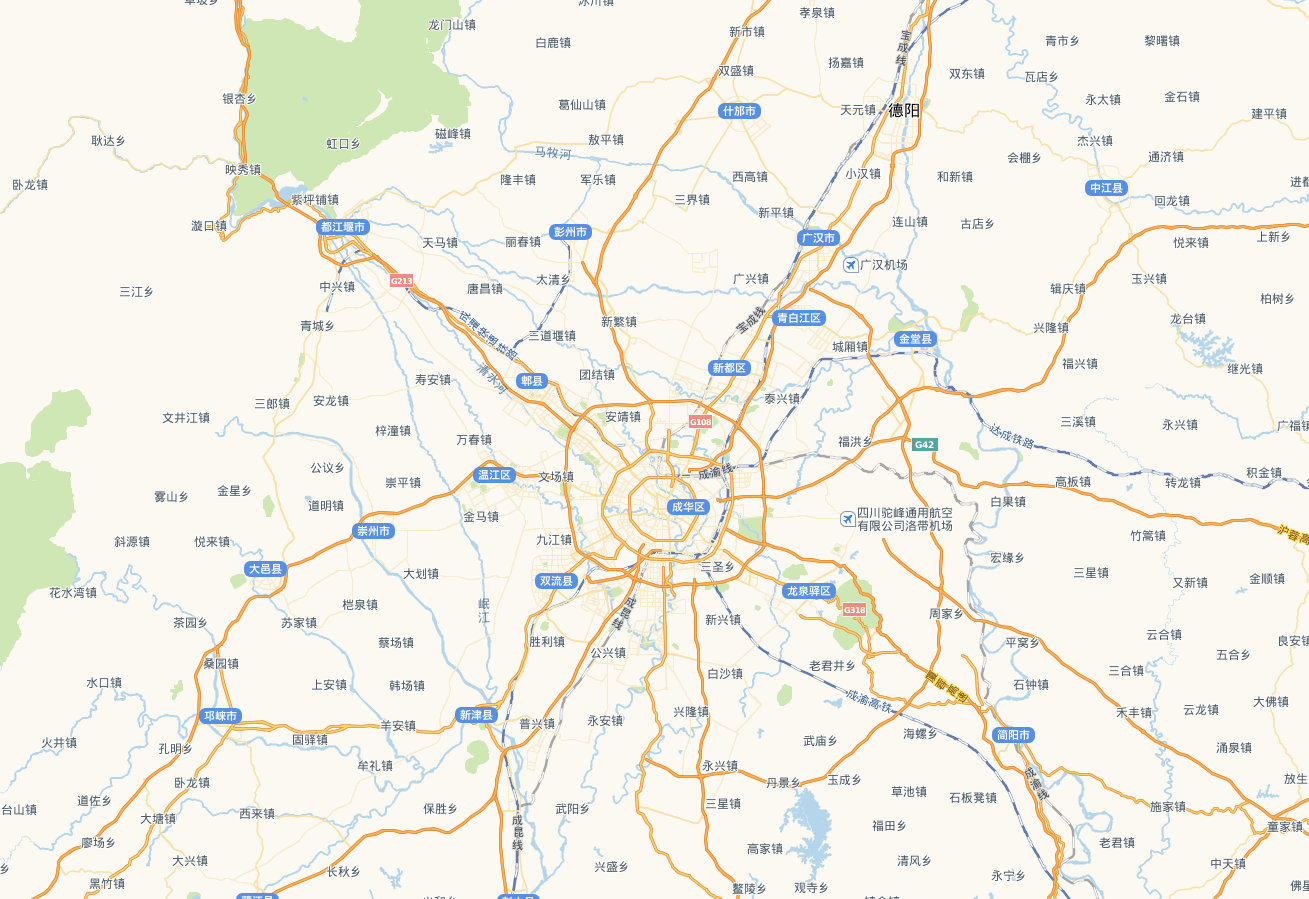
效果:

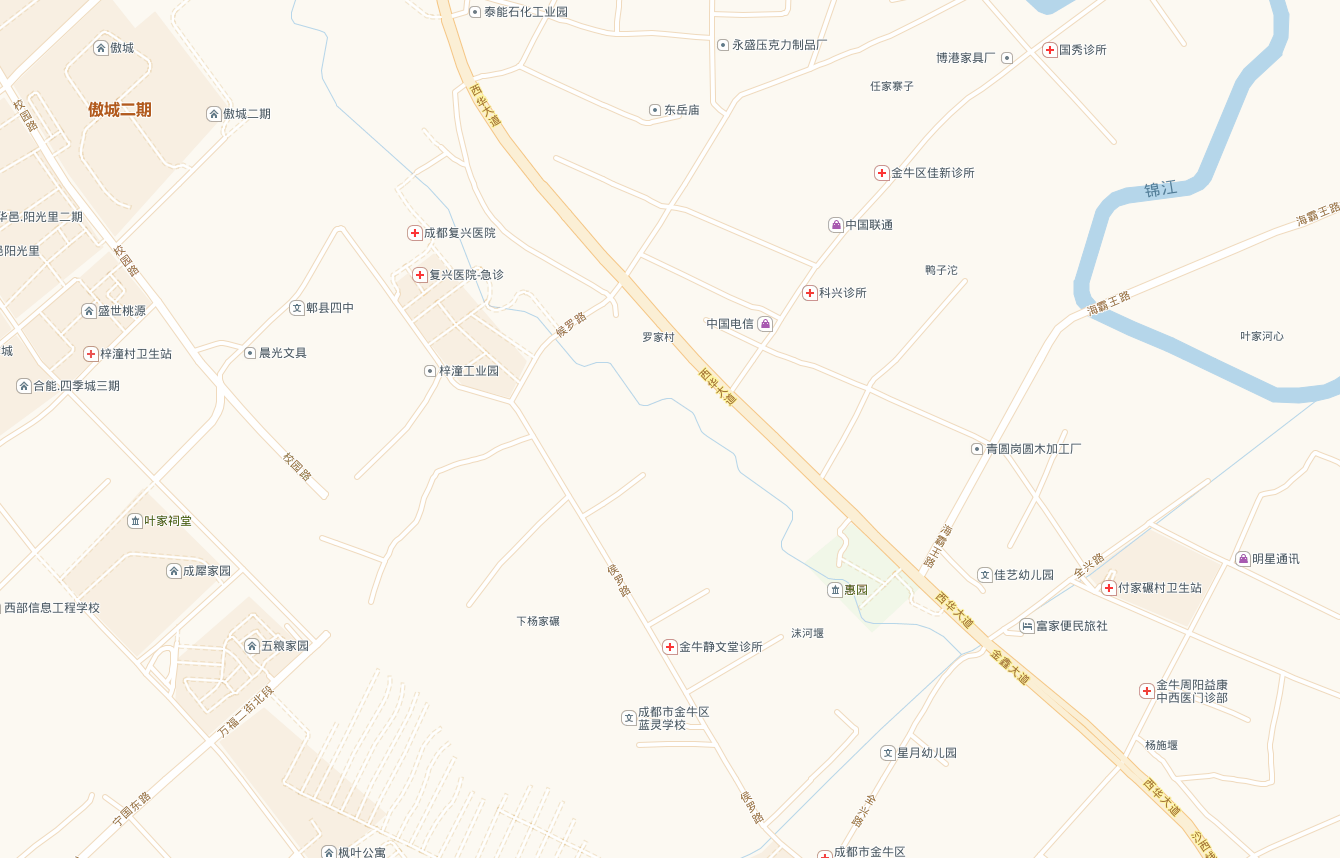
- 將地圖點位到指定點,並放大16倍(可顯示街道)
map.setView([30.745922638363268, 104.00415658374735], 16)
效果:

5. 新增標記
(1)直接新增,官網當中是直接建立一個標記,並新增到地圖(不推薦,不好管理)
L.marker([50.5, 30.5]).addTo(map);
(2)新增一個要素組,將標記新增到要素組裡面管理(推薦)
// 新增標記組
let featureGroup: any = {}
featureGroup = L.featureGroup().addTo(map)

// 設定標記點:[緯度, 經度]
const marker = L.marker([30.745922638363268, 104.00415658374735])
featureGroup.addLayer(marker)
若標記後報錯:

在引入時還需要獨引入圖片並更改預設Icon:
import L from 'leaflet'

// 圖片
import _ICON from 'leaflet/dist/images/marker-icon.png';
import _ICONSHADOW from 'leaflet/dist/images/marker-shadow.png';
/*
 * 測試過幾組資料,當使用自定義icon時,若不設定iconSize、iconAnchor,圖示會在放大地圖時位置傳送偏移
 * iconAnchor:圖示 "tip" 的座標(相對於其左上角),該值大致為:[iconSize寬的一半,iconSize高]
 * iconAnchor需要在設定iconSize之後才會生效
 * popupAnchor:標記的彈出框的位置(使用預設彈出框時需要
 * popupAnchor若不設定,則預設為經緯度位置,會遮蓋標記圖示,-50表示將彈出框相對於經緯度位置向上移動50px
 */
let _L_DEFAULT_ICON = L.icon({
    iconUrl: _ICON,
    shadowUrl: _ICONSHADOW,
    iconSize: [25, 41],
    iconAnchor: [12, 40],
    popupAnchor: [0, -50]
});
L.Marker.prototype.options.icon = _L_DEFAULT_ICON
(3)給標記新增事件與彈出框-bindPopup(只支援簡單新增)
// 給標記新增事件
marker.on('click', () => { })
// 給標記新增彈出框
marker.bindPopup('彈出內容').openPopup();
(4)給標記新增事件與彈出框-popup(高階用法)
marker.on('click', () => {
    // 可在點選標記後發起請求,請求成功後彈出框顯示請求內容
    // 建立彈出框:彈出框預設從經緯度位置彈出,會遮蓋圖示,可使用offset設定偏移量:[x軸偏移量, y軸偏移量]
    L.popup({ offset: [0, -50] })
      .setLatLng(marker.getLatLng()) //設定彈出框彈出位置
      .setContent('請求內容')
      .openOn(map);
})
- 清除標記
if(featureGroup) featureGroup.clearLayers();
- 新增連線
// 再新增一個要素組,要素組可存在多個
let lineFeatureGroup: any = {}
lineFeatureGroup = L.featureGroup().addTo(map)
const locations = [
  [30.745922638363268, 104.00415658374735],
  [30.725309888823382, 104.03297424316408]
]

var polyline = L.polyline(locations, {color: 'red'}).addTo(map);
lineFeatureGroup.addLayer(polyline)
- 清除連線
if(lineFeatureGroup) lineFeatureGroup.clearLayers();
完整demo程式碼(程式碼已上傳gitee)
<template>
  <div class="hello">
    <div id="map"></div>
    <div class="controls">
      <div class="fc">
        地圖點選:
        <input type="radio" name="mapclick" :value="1" v-model="mapClick">開
        <input class="ml15" type="radio" name="mapclick" :value="0" v-model="mapClick">關
      </div>
    </div>
  </div>
</template>

<script setup lang="ts">
import L from 'leaflet'
import { onMounted, ref } from 'vue';

import _ICON from 'leaflet/dist/images/marker-icon.png';
import _ICONSHADOW from 'leaflet/dist/images/marker-shadow.png';
/*
 * 測試過幾組資料,當使用自定義icon時,若不設定iconSize、iconAnchor,圖示會在放大地圖時位置傳送偏移
 * iconAnchor:圖示 "tip" 的座標(相對於其左上角),該值大致為:[iconSize寬的一半,iconSize高]
 * iconAnchor需要在設定iconSize之後才會生效
 * popupAnchor:標記的彈出框的位置(使用預設彈出框時需要
 * popupAnchor若不設定,則預設為經緯度位置,會遮蓋標記圖示,-50表示將彈出框相對於經緯度位置向上移動50px
 */
let _L_DEFAULT_ICON = L.icon({
    iconUrl: _ICON,
    shadowUrl: _ICONSHADOW,
    iconSize: [25, 41],
    iconAnchor: [12, 40],
    popupAnchor: [0, -50]
});
L.Marker.prototype.options.icon = _L_DEFAULT_ICON

const locations = [[30.745922638363268, 104.00415658374735], [30.725309888823382, 104.03297424316408]]
const layer = L.tileLayer('http://webrd01.is.autonavi.com/appmaptile?lang=zh_cn&size=1&scale=1&style=7&x={x}&y={y}&z={z}')
const mapClick = ref(1)

let map: any = {}
let featureGroup: any = {}
let lineFeatureGroup: any = {}

onMounted(() => {
  // 初始化地圖
  map = L.map('map', {
    center: [30.745922638363268, 104.00415658374735],//中心座標
    zoom: 10,//縮放級別
    zoomControl: true, //縮放元件
    attributionControl: false, //去掉右下角logol
    layers: [layer],//圖層
  })
  // 將檢視點位到指定點,並放大16倍
  map.setView([30.745922638363268, 104.00415658374735], 16)
  // 地圖點選
  map.on('click', (e: any) => {
    if(mapClick.value) {
      const latlng = e.latlng
      locations.push([latlng.lat, latlng.lng])
      // 清除要素
      if(featureGroup) featureGroup.clearLayers();
      locations.forEach(item => {
        point(item)
      })
    }
  })
  // 新增地圖要素組
  featureGroup = L.featureGroup().addTo(map)
  lineFeatureGroup = L.featureGroup().addTo(map)
  // 設定初始打點
  locations.forEach(item => {
    point(item)
  })

  setPolyLine()
})

const point = (arr: number[]) => {
  // 設定點標記:[緯度, 經度]
  const marker = L.marker(arr)
  // 給標記新增事件
  marker.on('click', () => {
    // 建立彈出框:彈出框預設從經緯度位置彈出,會遮蓋圖示,可使用offset設定偏移量:[x軸偏移量, y軸偏移量]
    L.popup({ offset: [0, -50] })
      .setLatLng(marker.getLatLng())
      .setContent(arr[0] + ': ' + arr[1])
      .openOn(map);
  })
  // 將標記新增到要素組
  featureGroup.addLayer(marker)
}

const setPolyLine = () => {
  var polyline = L.polyline([locations[0], locations[1]], {color: 'red'}).addTo(map);
  lineFeatureGroup.addLayer(polyline)
}
</script>

<style scoped>
.hello, #map {
  height: 100%;
  width: 100%;
}

.hello {
  position: relative;
}

.controls {
  position: absolute;
  right: 0;
  top: 0;
  padding: 15px;
  z-index: 1000;

  font-size: 14px;
  background-color: #fff;
}

.fc {
  display: flex;
  align-items: center;
}

.ml15 {
  margin-left: 15px;
}

.mr15 {
  margin-right: 15px;
}
</style>