機器學習演演算法(五):基於企鵝資料集的決策樹分類預測
機器學習演演算法(五):基於企鵝資料集的決策樹分類預測
1 邏決策樹的介紹和應用
1.1 決策樹的介紹
決策樹是一種常見的分類模型,在金融風控、醫療輔助診斷等諸多行業具有較為廣泛的應用。決策樹的核心思想是基於樹結構對資料進行劃分,這種思想是人類處理問題時的本能方法。例如在婚戀市場中,女方通常會先詢問男方是否有房產,如果有房產再瞭解是否有車產,如果有車產再看是否有穩定工作……最後得出是否要深入瞭解的判斷。
主要應用:
由於決策樹模型中自變數與因變數的非線性關係以及決策樹簡單的計算方法,使得它成為整合學習中最為廣泛使用的基模型。梯度提升樹(GBDT),XGBoost以及LightGBM等先進的整合模型都採用了決策樹作為基模型,在廣告計算、CTR預估、金融風控等領域大放異彩,成為當今與神經網路相提並論的複雜模型,更是資料探勘比賽中的常客。在新的研究中,南京大學周志華教授提出一種多粒度級聯森林模型,創造了一種全新的基於決策樹的深度整合方法,為我們提供了決策樹發展的另一種可能。
同時決策樹在一些明確需要可解釋性或者提取分類規則的場景中被廣泛應用,而其他機器學習模型在這一點很難做到。例如在醫療輔助系統中,為了方便專業人員發現錯誤,常常將決策樹演演算法用於輔助病症檢測。例如在一個預測哮喘患者的模型中,醫生髮現測試的許多高階模型的效果非常差。在他們執行了一個決策樹模型後發現,演演算法認為劇烈咳嗽的病人患哮喘的風險很小。但醫生非常清楚劇烈咳嗽一般都會被立刻檢查治療,這意味著患有劇烈咳嗽的哮喘病人都會馬上得到收治。用於建模的資料認為這類病人風險很小,是因為所有這類病人都得到了及時治療,所以極少有人在此之後患病或死亡。
1.2 相關流程
- 瞭解 決策樹 的理論知識
- 掌握 決策樹 的 sklearn 函數呼叫並將其運用在企鵝資料集的預測中
Part1 Demo實踐
- Step1:庫函數匯入
- Step2:模型訓練
- Step3:資料和模型視覺化
- Step4:模型預測
Part2 基於企鵝(penguins)資料集的決策樹分類實踐
- Step1:庫函數匯入
- Step2:資料讀取/載入
- Step3:資料資訊簡單檢視
- Step4:視覺化描述
- Step5:利用 決策樹模型 在二分類上 進行訓練和預測
- Step6:利用 決策樹模型 在三分類(多分類)上 進行訓練和預測
3 演演算法實戰
3.1Demo實踐
Step1: 庫函數匯入
##  基礎函數庫
import numpy as np

## 匯入畫相簿
import matplotlib.pyplot as plt
import seaborn as sns

## 匯入決策樹模型函數
from sklearn.tree import DecisionTreeClassifier
from sklearn import tree
Step2: 訓練模型
##Demo演示LogisticRegression分類

## 構造資料集
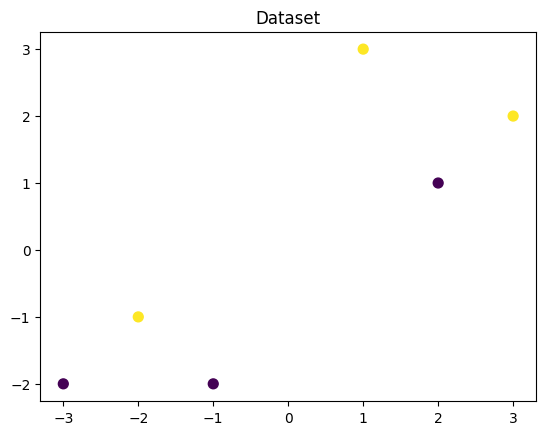
x_fearures = np.array([[-1, -2], [-2, -1], [-3, -2], [1, 3], [2, 1], [3, 2]])
y_label = np.array([0, 1, 0, 1, 0, 1])

## 呼叫決策樹迴歸模型
tree_clf = DecisionTreeClassifier()

## 呼叫決策樹模型擬合構造的資料集
tree_clf = tree_clf.fit(x_fearures, y_label)
Step3: 資料和模型視覺化(需要用到graphviz視覺化庫)
## 視覺化構造的資料樣本點
plt.figure()
plt.scatter(x_fearures[:,0],x_fearures[:,1], c=y_label, s=50, cmap='viridis')
plt.title('Dataset')
plt.show()
## 視覺化決策樹
import graphviz
dot_data = tree.export_graphviz(tree_clf, out_file=None)
graph = graphviz.Source(dot_data)
graph.render("pengunis")
'pengunis.pdf'
Step4:模型預測
## 建立新樣本
x_fearures_new1 = np.array([[0, -1]])
x_fearures_new2 = np.array([[2, 1]])

## 在訓練集和測試集上分佈利用訓練好的模型進行預測
y_label_new1_predict = tree_clf.predict(x_fearures_new1)
y_label_new2_predict = tree_clf.predict(x_fearures_new2)

print('The New point 1 predict class:\n',y_label_new1_predict)
print('The New point 2 predict class:\n',y_label_new2_predict)
The New point 1 predict class:
 [1]
The New point 2 predict class:
 [0]
3.2 基於penguins_raw資料集的決策樹實戰
在實踐的最開始,我們首先需要匯入一些基礎的函數庫包括:numpy (Python進行科學計算的基礎軟體包),pandas(pandas是一種快速,強大,靈活且易於使用的開源資料分析和處理工具),matplotlib和seaborn繪圖。
#下載需要用到的資料集
!wget https://tianchi-media.oss-cn-beijing.aliyuncs.com/DSW/6tree/penguins_raw.csv
--2023-03-22 16:21:32--  https://tianchi-media.oss-cn-beijing.aliyuncs.com/DSW/6tree/penguins_raw.csv
正在解析主機 tianchi-media.oss-cn-beijing.aliyuncs.com (tianchi-media.oss-cn-beijing.aliyuncs.com)... 49.7.22.39
正在連線 tianchi-media.oss-cn-beijing.aliyuncs.com (tianchi-media.oss-cn-beijing.aliyuncs.com)|49.7.22.39|:443... 已連線。
已發出 HTTP 請求,正在等待迴應... 200 OK
長度: 53098 (52K) [text/csv]
正在儲存至: 「penguins_raw.csv」

penguins_raw.csv    100%[===================>]  51.85K  --.-KB/s    in 0.04s

2023-03-22 16:21:33 (1.23 MB/s) - 已儲存 「penguins_raw.csv」 [53098/53098])
Step1:函數庫匯入
##  基礎函數庫
import numpy as np
import pandas as pd

## 繪圖函數庫
import matplotlib.pyplot as plt
import seaborn as sns
本次我們選擇企鵝資料(palmerpenguins)進行方法的嘗試訓練,該資料集一共包含8個變數,其中7個特徵變數,1個目標分類變數。共有150個樣本,目標變數為 企鵝的類別 其都屬於企鵝類的三個亞屬,分別是(Adélie, Chinstrap and Gentoo)。包含的三種種企鵝的七個特徵,分別是所在島嶼,嘴巴長度,嘴巴深度,腳蹼長度,身體體積,性別以及年齡。
| 變數 | 描述 |
|---|---|
| species | a factor denoting penguin species |
| island | a factor denoting island in Palmer Archipelago, Antarctica |
| bill_length_mm | a number denoting bill length |
| bill_depth_mm | a number denoting bill depth |
| flipper_length_mm | an integer denoting flipper length |
| body_mass_g | an integer denoting body mass |
| sex | a factor denoting penguin sex |
| year | an integer denoting the study year |
Step2:資料讀取/載入
## 我們利用Pandas自帶的read_csv函數讀取並轉化為DataFrame格式

data = pd.read_csv('./penguins_raw.csv')
## 為了方便我們僅選取四個簡單的特徵,有興趣的同學可以研究下其他特徵的含義以及使用方法
data = data[['Species','Culmen Length (mm)','Culmen Depth (mm)',
            'Flipper Length (mm)','Body Mass (g)']]
Step3:資料資訊簡單檢視
## 利用.info()檢視資料的整體資訊
data.info()
<class 'pandas.core.frame.DataFrame'>
RangeIndex: 344 entries, 0 to 343
Data columns (total 5 columns):
 #   Column               Non-Null Count  Dtype
---  ------               --------------  -----
 0   Species              344 non-null    object
 1   Culmen Length (mm)   342 non-null    float64
 2   Culmen Depth (mm)    342 non-null    float64
 3   Flipper Length (mm)  342 non-null    float64
 4   Body Mass (g)        342 non-null    float64
dtypes: float64(4), object(1)
memory usage: 13.6+ KB
## 進行簡單的資料檢視,我們可以利用 .head() 頭部.tail()尾部
data.head()
| Species | Culmen Length (mm) | Culmen Depth (mm) | Flipper Length (mm) | Body Mass (g) | |
|---|---|---|---|---|---|
| 0 | Adelie Penguin (Pygoscelis adeliae) | 39.1 | 18.7 | 181.0 | 3750.0 |
| 1 | Adelie Penguin (Pygoscelis adeliae) | 39.5 | 17.4 | 186.0 | 3800.0 |
| 2 | Adelie Penguin (Pygoscelis adeliae) | 40.3 | 18.0 | 195.0 | 3250.0 |
| 3 | Adelie Penguin (Pygoscelis adeliae) | NaN | NaN | NaN | NaN |
| 4 | Adelie Penguin (Pygoscelis adeliae) | 36.7 | 19.3 | 193.0 | 3450.0 |
這裡我們發現資料集中存在NaN,一般的我們認為NaN在資料集中代表了缺失值,可能是資料採集或處理時產生的一種錯誤。這裡我們採用-1將缺失值進行填補,還有其他例如「中位數填補、平均數填補」的缺失值處理方法有興趣的同學也可以嘗試。
data = data.fillna(-1)
data.tail()
| Species | Culmen Length (mm) | Culmen Depth (mm) | Flipper Length (mm) | Body Mass (g) | |
|---|---|---|---|---|---|
| 339 | Chinstrap penguin (Pygoscelis antarctica) | 55.8 | 19.8 | 207.0 | 4000.0 |
| 340 | Chinstrap penguin (Pygoscelis antarctica) | 43.5 | 18.1 | 202.0 | 3400.0 |
| 341 | Chinstrap penguin (Pygoscelis antarctica) | 49.6 | 18.2 | 193.0 | 3775.0 |
| 342 | Chinstrap penguin (Pygoscelis antarctica) | 50.8 | 19.0 | 210.0 | 4100.0 |
| 343 | Chinstrap penguin (Pygoscelis antarctica) | 50.2 | 18.7 | 198.0 | 3775.0 |
## 其對應的類別標籤為'Adelie Penguin', 'Gentoo penguin', 'Chinstrap penguin'三種不同企鵝的類別。
data['Species'].unique()
array(['Adelie Penguin (Pygoscelis adeliae)',
       'Gentoo penguin (Pygoscelis papua)',
       'Chinstrap penguin (Pygoscelis antarctica)'], dtype=object)
## 利用value_counts函數檢視每個類別數量
pd.Series(data['Species']).value_counts()
Adelie Penguin (Pygoscelis adeliae)          152
Gentoo penguin (Pygoscelis papua)            124
Chinstrap penguin (Pygoscelis antarctica)     68
Name: Species, dtype: int64
## 對於特徵進行一些統計描述
data.describe()
| Culmen Length (mm) | Culmen Depth (mm) | Flipper Length (mm) | Body Mass (g) | |
|---|---|---|---|---|
| count | 344.000000 | 344.000000 | 344.000000 | 344.000000 |
| mean | 43.660756 | 17.045640 | 199.741279 | 4177.319767 |
| std | 6.428957 | 2.405614 | 20.806759 | 861.263227 |
| min | -1.000000 | -1.000000 | -1.000000 | -1.000000 |
| 25% | 39.200000 | 15.500000 | 190.000000 | 3550.000000 |
| 50% | 44.250000 | 17.300000 | 197.000000 | 4025.000000 |
| 75% | 48.500000 | 18.700000 | 213.000000 | 4750.000000 |
| max | 59.600000 | 21.500000 | 231.000000 | 6300.000000 |
Step4:視覺化描述
## 特徵與標籤組合的散點視覺化
sns.pairplot(data=data, diag_kind='hist', hue= 'Species')
plt.show()
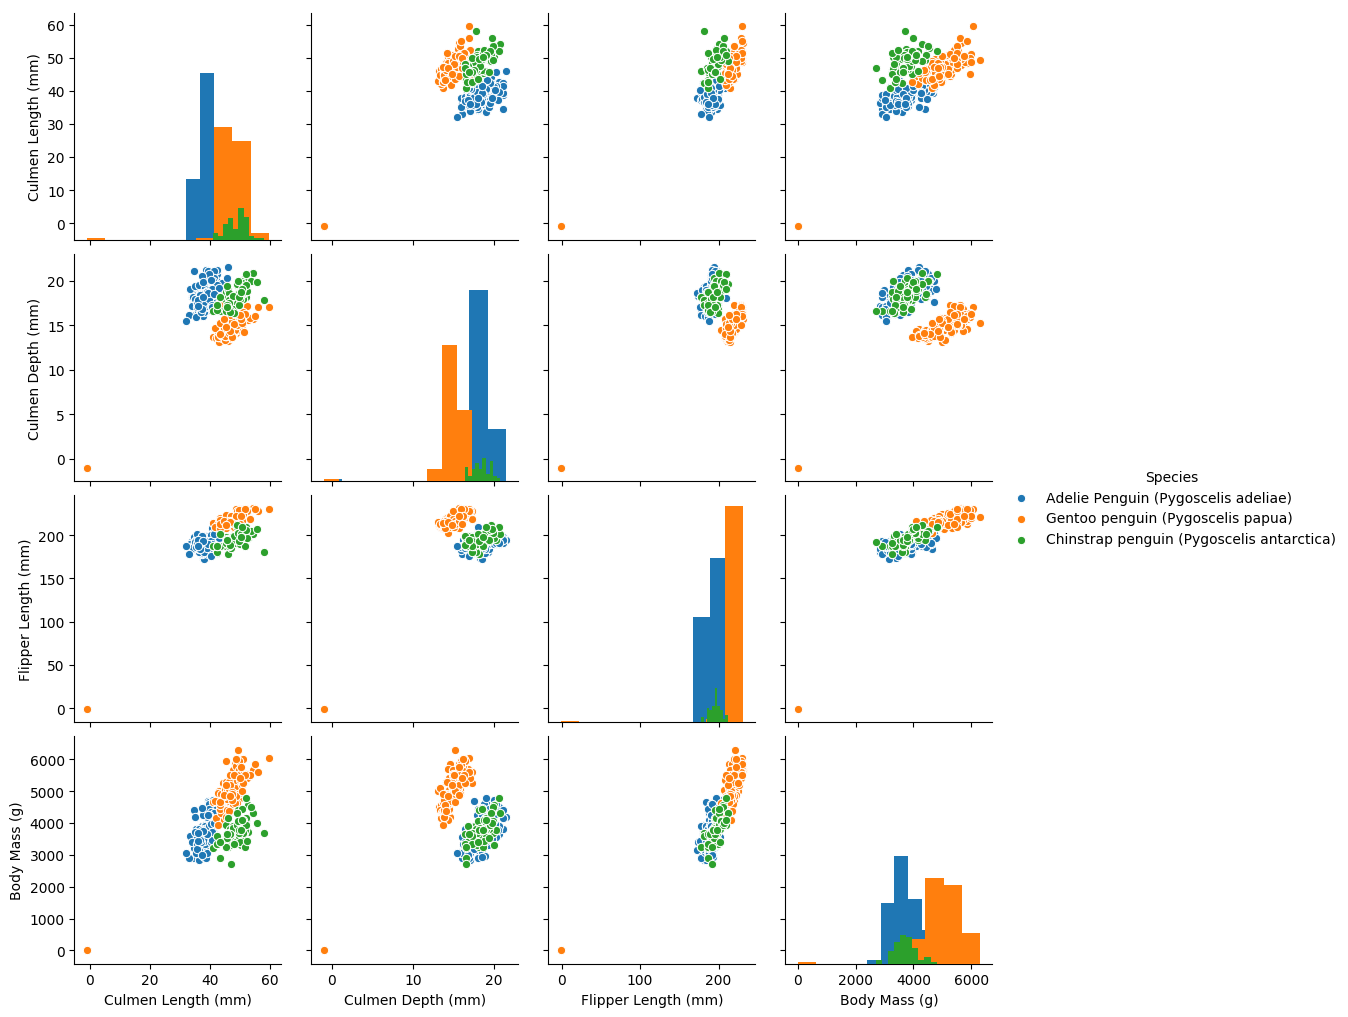
從上圖可以發現,在2D情況下不同的特徵組合對於不同類別的企鵝的散點分佈,以及大概的區分能力。Culmen Lenth與其他特徵的組合散點的重合較少,所以對於資料集的劃分能力最好。
我們發現
'''為了方便我們將標籤轉化為數位
       'Adelie Penguin (Pygoscelis adeliae)'        ------0
       'Gentoo penguin (Pygoscelis papua)'          ------1
       'Chinstrap penguin (Pygoscelis antarctica)   ------2 '''

def trans(x):
    if x == data['Species'].unique()[0]:
        return 0
    if x == data['Species'].unique()[1]:
        return 1
    if x == data['Species'].unique()[2]:
        return 2

data['Species'] = data['Species'].apply(trans)
for col in data.columns:
    if col != 'Species':
        sns.boxplot(x='Species', y=col, saturation=0.5, palette='pastel', data=data)
        plt.title(col)
        plt.show()
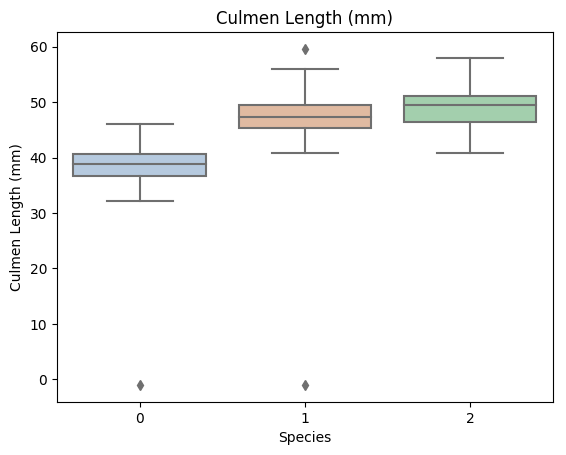

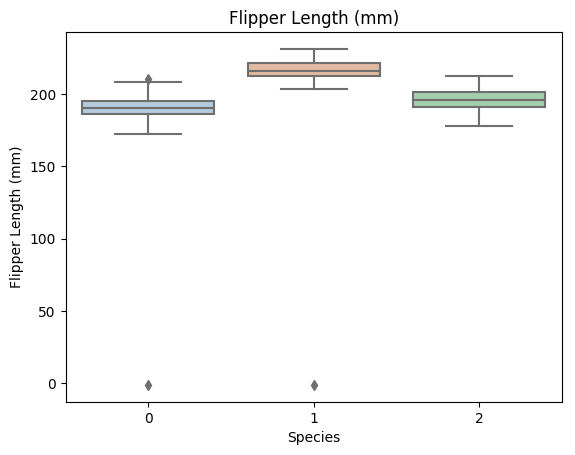
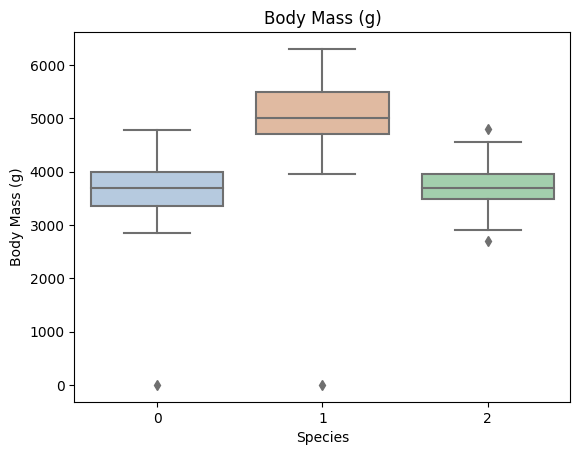
利用箱型圖我們也可以得到不同類別在不同特徵上的分佈差異情況。
# 選取其前三個特徵繪製三維散點圖
from mpl_toolkits.mplot3d import Axes3D

fig = plt.figure(figsize=(10,8))
ax = fig.add_subplot(111, projection='3d')

data_class0 = data[data['Species']==0].values
data_class1 = data[data['Species']==1].values
data_class2 = data[data['Species']==2].values
# 'setosa'(0), 'versicolor'(1), 'virginica'(2)
ax.scatter(data_class0[:,0], data_class0[:,1], data_class0[:,2],label=data['Species'].unique()[0])
ax.scatter(data_class1[:,0], data_class1[:,1], data_class1[:,2],label=data['Species'].unique()[1])
ax.scatter(data_class2[:,0], data_class2[:,1], data_class2[:,2],label=data['Species'].unique()[2])
plt.legend()

plt.show()
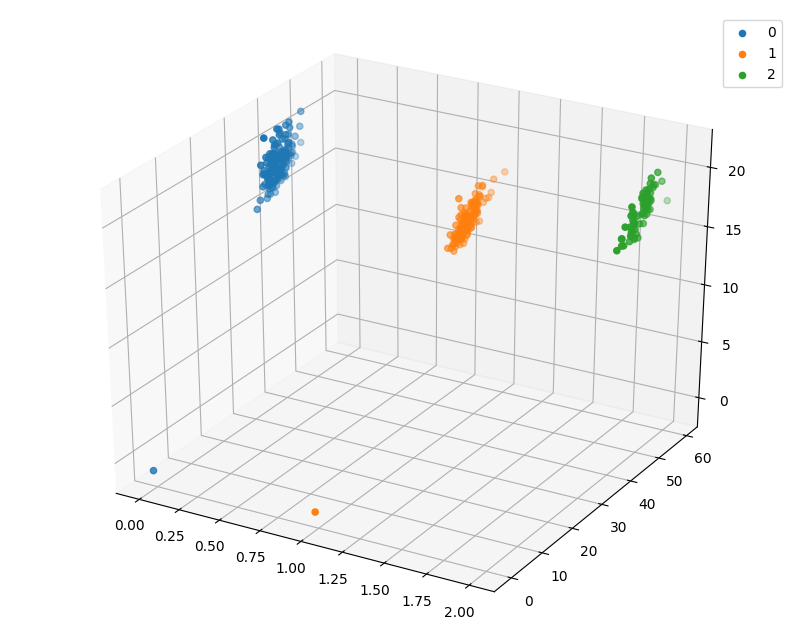
Step5:利用 決策樹模型 在二分類上 進行訓練和預測
## 為了正確評估模型效能,將資料劃分為訓練集和測試集,並在訓練集上訓練模型,在測試集上驗證模型效能。
from sklearn.model_selection import train_test_split

## 選擇其類別為0和1的樣本 (不包括類別為2的樣本)
data_target_part = data[data['Species'].isin([0,1])][['Species']]
data_features_part = data[data['Species'].isin([0,1])][['Culmen Length (mm)','Culmen Depth (mm)',
            'Flipper Length (mm)','Body Mass (g)']]

## 測試集大小為20%, 80%/20%分
x_train, x_test, y_train, y_test = train_test_split(data_features_part, data_target_part, test_size = 0.2, random_state = 2020)
## 從sklearn中匯入決策樹模型
from sklearn.tree import DecisionTreeClassifier
from sklearn import tree
## 定義 決策樹模型
clf = DecisionTreeClassifier(criterion='entropy')
# 在訓練集上訓練決策樹模型
clf.fit(x_train, y_train)
DecisionTreeClassifier(ccp_alpha=0.0, class_weight=None, criterion='entropy',
                       max_depth=None, max_features=None, max_leaf_nodes=None,
                       min_impurity_decrease=0.0, min_impurity_split=None,
                       min_samples_leaf=1, min_samples_split=2,
                       min_weight_fraction_leaf=0.0, presort='deprecated',
                       random_state=None, splitter='best')
## 視覺化
import graphviz
dot_data = tree.export_graphviz(clf, out_file=None)
graph = graphviz.Source(dot_data)
graph.render("penguins")
'penguins.pdf'
## 在訓練集和測試集上分佈利用訓練好的模型進行預測
train_predict = clf.predict(x_train)
test_predict = clf.predict(x_test)
from sklearn import metrics

## 利用accuracy(準確度)【預測正確的樣本數目佔總預測樣本數目的比例】評估模型效果
print('The accuracy of the Logistic Regression is:',metrics.accuracy_score(y_train,train_predict))
print('The accuracy of the Logistic Regression is:',metrics.accuracy_score(y_test,test_predict))

## 檢視混淆矩陣 (預測值和真實值的各類情況統計矩陣)
confusion_matrix_result = metrics.confusion_matrix(test_predict,y_test)
print('The confusion matrix result:\n',confusion_matrix_result)

# 利用熱力圖對於結果進行視覺化
plt.figure(figsize=(8, 6))
sns.heatmap(confusion_matrix_result, annot=True, cmap='Blues')
plt.xlabel('Predicted labels')
plt.ylabel('True labels')
plt.show()
The accuracy of the Logistic Regression is: 0.9954545454545455
The accuracy of the Logistic Regression is: 1.0
The confusion matrix result:
 [[31  0]
 [ 0 25]]
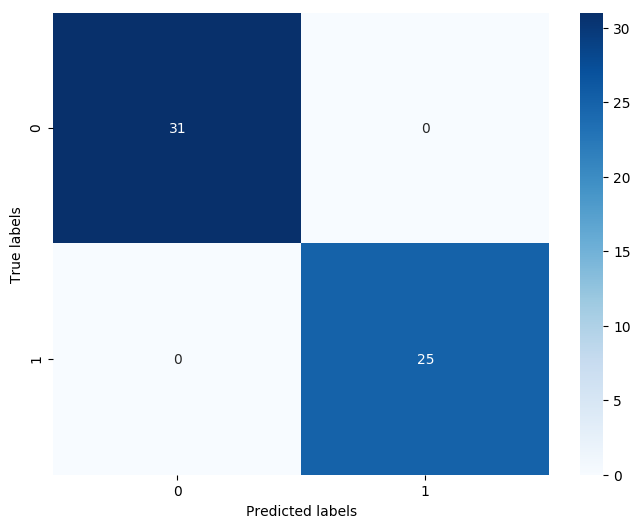
我們可以發現其準確度為1,代表所有的樣本都預測正確了。
Step6:利用 決策樹模型 在三分類(多分類)上 進行訓練和預測
## 測試集大小為20%, 80%/20%分
x_train, x_test, y_train, y_test = train_test_split(data[['Culmen Length (mm)','Culmen Depth (mm)',
            'Flipper Length (mm)','Body Mass (g)']], data[['Species']], test_size = 0.2, random_state = 2020)
## 定義 決策樹模型
clf = DecisionTreeClassifier()
# 在訓練集上訓練決策樹模型
clf.fit(x_train, y_train)
DecisionTreeClassifier(ccp_alpha=0.0, class_weight=None, criterion='gini',
                       max_depth=None, max_features=None, max_leaf_nodes=None,
                       min_impurity_decrease=0.0, min_impurity_split=None,
                       min_samples_leaf=1, min_samples_split=2,
                       min_weight_fraction_leaf=0.0, presort='deprecated',
                       random_state=None, splitter='best')
## 在訓練集和測試集上分佈利用訓練好的模型進行預測
train_predict = clf.predict(x_train)
test_predict = clf.predict(x_test)

## 由於決策樹模型是概率預測模型(前文介紹的 p = p(y=1|x,\theta)),所有我們可以利用 predict_proba 函數預測其概率
train_predict_proba = clf.predict_proba(x_train)
test_predict_proba = clf.predict_proba(x_test)

print('The test predict Probability of each class:\n',test_predict_proba)
## 其中第一列代表預測為0類的概率,第二列代表預測為1類的概率,第三列代表預測為2類的概率。

## 利用accuracy(準確度)【預測正確的樣本數目佔總預測樣本數目的比例】評估模型效果
print('The accuracy of the Logistic Regression is:',metrics.accuracy_score(y_train,train_predict))
print('The accuracy of the Logistic Regression is:',metrics.accuracy_score(y_test,test_predict))
The test predict Probability of each class:
 [[0. 0. 1.]
 [0. 1. 0.]
 [0. 1. 0.]
 [1. 0. 0.]
 [1. 0. 0.]
 [0. 0. 1.]
 [0. 0. 1.]
 [1. 0. 0.]
 [0. 1. 0.]
 [1. 0. 0.]
 [0. 1. 0.]
 [0. 1. 0.]
 [1. 0. 0.]
 [0. 1. 0.]
 [0. 1. 0.]
 [0. 1. 0.]
 [1. 0. 0.]
 [0. 1. 0.]
 [1. 0. 0.]
 [1. 0. 0.]
 [0. 0. 1.]
 [1. 0. 0.]
 [0. 0. 1.]
 [1. 0. 0.]
 [1. 0. 0.]
 [1. 0. 0.]
 [0. 1. 0.]
 [1. 0. 0.]
 [0. 1. 0.]
 [1. 0. 0.]
 [1. 0. 0.]
 [0. 0. 1.]
 [0. 0. 1.]
 [0. 1. 0.]
 [1. 0. 0.]
 [0. 1. 0.]
 [0. 1. 0.]
 [1. 0. 0.]
 [1. 0. 0.]
 [0. 1. 0.]
 [0. 0. 1.]
 [1. 0. 0.]
 [0. 1. 0.]
 [1. 0. 0.]
 [1. 0. 0.]
 [0. 0. 1.]
 [0. 0. 1.]
 [1. 0. 0.]
 [1. 0. 0.]
 [0. 1. 0.]
 [1. 0. 0.]
 [1. 0. 0.]
 [0. 1. 0.]
 [0. 1. 0.]
 [0. 0. 1.]
 [0. 0. 1.]
 [0. 1. 0.]
 [1. 0. 0.]
 [1. 0. 0.]
 [1. 0. 0.]
 [0. 1. 0.]
 [0. 1. 0.]
 [0. 0. 1.]
 [0. 0. 1.]
 [1. 0. 0.]
 [0. 1. 0.]
 [0. 0. 1.]
 [1. 0. 0.]
 [1. 0. 0.]]
The accuracy of the Logistic Regression is: 0.9963636363636363
The accuracy of the Logistic Regression is: 0.9565217391304348
## 檢視混淆矩陣
confusion_matrix_result = metrics.confusion_matrix(test_predict,y_test)
print('The confusion matrix result:\n',confusion_matrix_result)

# 利用熱力圖對於結果進行視覺化
plt.figure(figsize=(8, 6))
sns.heatmap(confusion_matrix_result, annot=True, cmap='Blues')
plt.xlabel('Predicted labels')
plt.ylabel('True labels')
plt.show()
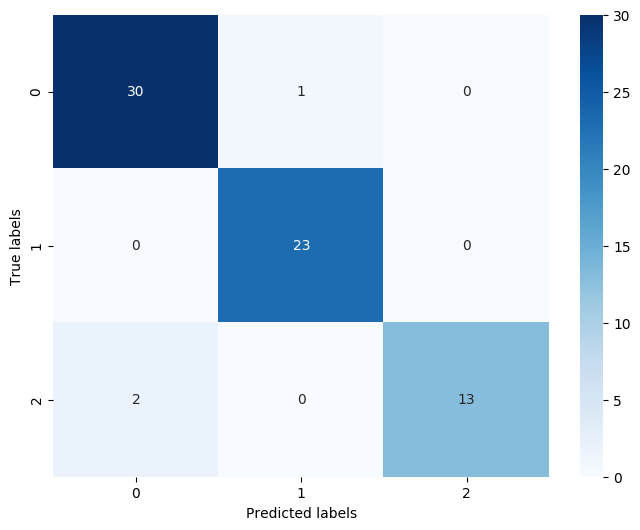
The confusion matrix result:
 [[30  1  0]
 [ 0 23  0]
 [ 2  0 13]]
3.3 重要知識點
3.3.1 決策樹構建的虛擬碼
輸入: 訓練集D={($x_1$,$y_1$),($x_2$,$y_2$),....,($x_m$,$y_m$)};
特徵集A={$a_1$,$a_2$,....,$a_d$}
輸出: 以node為根節點的一顆決策樹
過程:函數TreeGenerate($D$,$A$)
- 生成節點node
- $if$ $D$中樣本全書屬於同一類別$C$ $then$:
- ----將node標記為$C$類葉節點;$return$
- $if$ $A$ = 空集 OR D中樣本在$A$上的取值相同 $then$:
- ----將node標記為葉節點,其類別標記為$D$中樣本數最多的類;$return$
- 從 $A$ 中選擇最優劃分屬性 $a_*$;
- $for$ $a_$ 的每一個值 $a_^v$ $do$:
- ----為node生成一個分支,令$D_v$表示$D$中在$a_$上取值為$a_^v$的樣本子集;
- ----$if$ $D_v$ 為空 $then$:
- --------將分支節點標記為葉節點,其類別標記為$D$中樣本最多的類;$then$
- ----$else$:
- --------以 TreeGenerate($D_v$,$A${$a_*$})為分支節點
決策樹的構建過程是一個遞迴過程。函數存在三種返回狀態:(1)當前節點包含的樣本全部屬於同一類別,無需繼續劃分;(2)當前屬性集為空或者所有樣本在某個屬性上的取值相同,無法繼續劃分;(3)當前節點包含的樣本集合為空,無法劃分。
3.3.2 劃分選擇
從上述虛擬碼中我們發現,決策樹的關鍵在於line6.從$A$中選擇最優劃分屬性$