這樣封裝echarts簡單好用
2023-03-21 15:03:22
為什麼要去封裝echarts?
在我們的專案中,有很多的地方都使用了echarts圖表展示資料。
在有些場景,一個頁面有十多個的echarts圖。
這些echarts只是展示的指標不一樣。
如果我們每一個echarts圖都寫一份設定型的話,
會有非常多的冗餘程式碼,並且如果需要某一個設定項。
我們需要給一個圖修改一次,這樣不僅麻煩,還噁心。
為了方便後面的維護,我們決定將echarts做一個簡單實用的封裝
我們將實現以下這些功能
1.父元件只需要傳遞X軸和Y軸的資料。
2.如果無資料的話,將展示暫無資料。
3.在渲染之前清空當前範例(會移除範例中所有的元件和圖表)
4.子元件用watch監聽資料變化達到資料變化後立刻跟新檢視
5.給一個頁面可以單獨設定echarts的各個屬性
6.可以設定多條折線圖
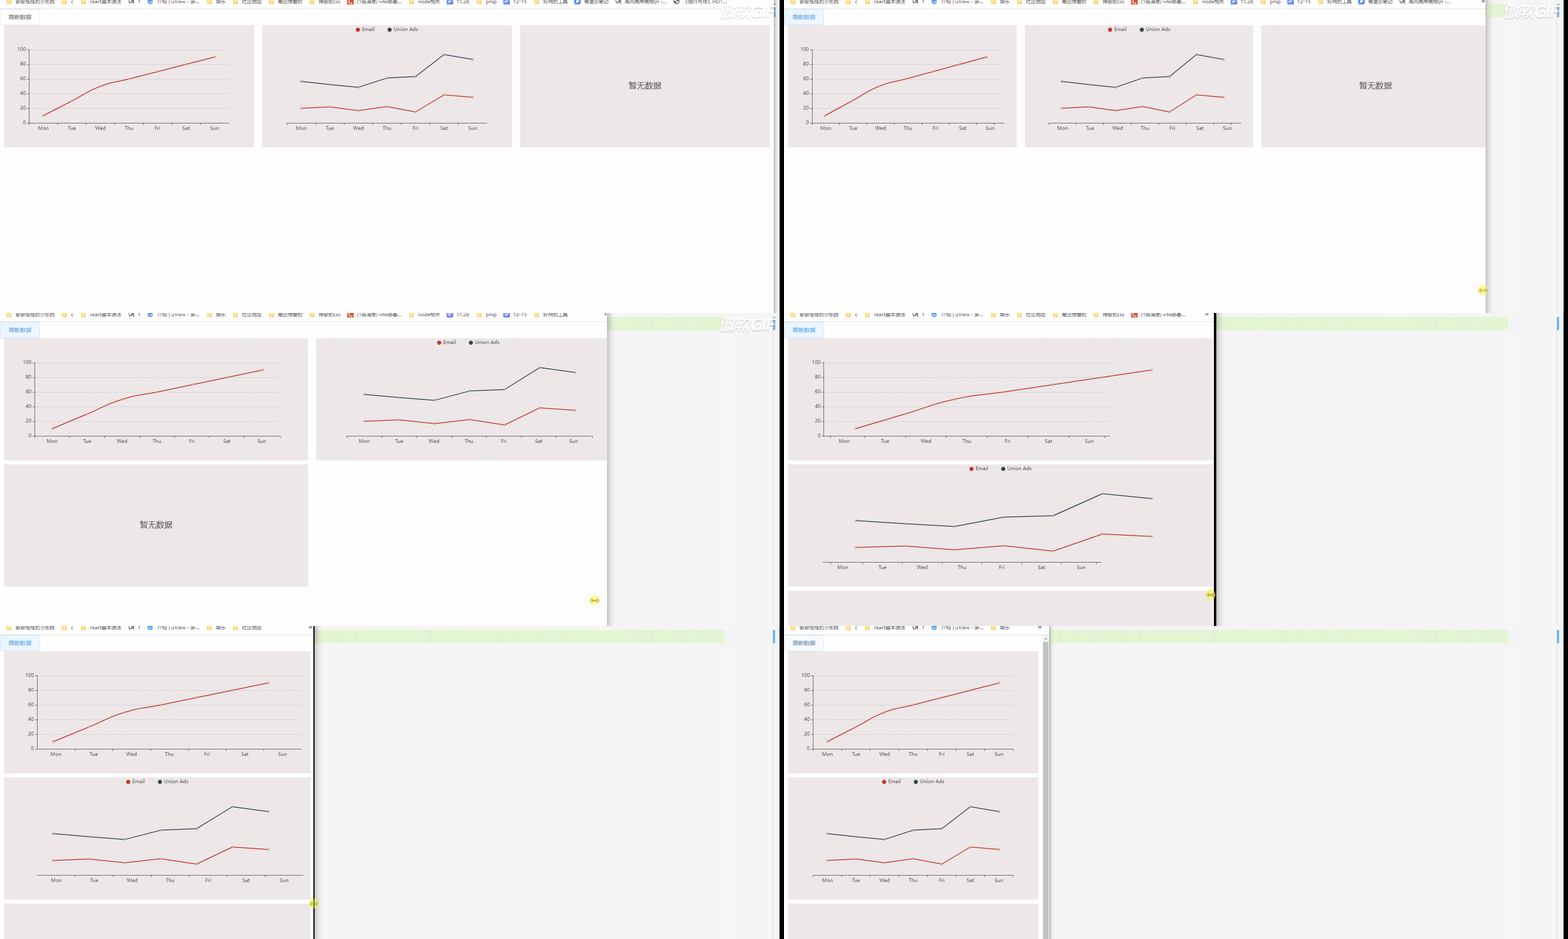
7.根據螢幕大小自動排列一行顯示多少個圖
8.echarts隨螢幕大小自動進行縮放
由於echarts的型別很多,我們這裡只對折線圖進行封裝
其他型別的圖,我們可以按照這個思路來就行。
父元件傳遞X軸和Y軸資料以及自動顯示暫無資料
1.父元件通過 echartsData 進行傳遞echarts各個座標的資料。
2.this.echartsData.Xdata 來判斷是否顯示暫無資料
3.通過ref來獲取dom節點。為什麼不使用 id來獲取echarts呢?
因為id重複的話將會導致echarts無法渲染。
<template>
  <div>
    <div class="box">
      <echartsLine v-for="(item,index) in listArr"
      :echartsData="item" :key="index"></echartsLine>
    </div>
  </div>
</template>
<script>
import echartsLine from "@/components/echarts/echarts-line.vue"
export default {
data() {
  return {
    // 父元件傳遞的資料
    listArr: [
      {
        Xdata: ['Mon', 'Tue', 'Wed', 'Thu', 'Fri', 'Sat', 'Sun'],
        Ydata: [10, 30, 50, 60, 70, 80, 90],
      },
      {
        Xdata: [], // 表示X橫座標的資料
        Ydata: [], // Y縱座標的資料
      }
    ]
  }
},
components: {
  echartsLine
}
}
</script>
子元件
<template>
  <div>
    <div class="chart"  ref="demo"></div>
  </div>
</template>
<script>
import echarts from 'echarts'
export default {
  props: {
    echartsData: { // 接受父元件傳遞過來的引數
      type: Object,
      default: () => {
        return  {
          Xdata:[],
          Ydata: [],
        }
      }
    }
  },
  data() {
    return {
      // echarts的dom節點範例
      char: null
    }
  },
  mounted() {
   this.showEcharts()
  },
  methods:{
    showEcharts(){
    // 獲取dom節點,
    let demo = this.$refs.demo
    // 初始化echarts
    this.char = echarts.init(demo);
    // 在渲染之前清空範例
    this.char.clear()
    let option = {}
    // 如果無資料的話,將展示暫無資料
    if (this.echartsData.Xdata && this.echartsData.Xdata.length == 0) {
      option = {
        title: {
          text: '暫無資料',
          x: 'center',
          y: 'center',
          textStyle: {
            fontSize: 20,
            fontWeight: 'normal',
          }
        }
      }
    } else {
      option = {
        xAxis: {
          type: 'category',
          data: this.echartsData.Xdata
        },
        yAxis: {
          type: 'value'
        },
        series: [
          {
            data: this.echartsData.Ydata,
            type: 'line',
            smooth: true
          }
        ]
      };
    }
    this.char.setOption(option);
    }
  }
}
</script>

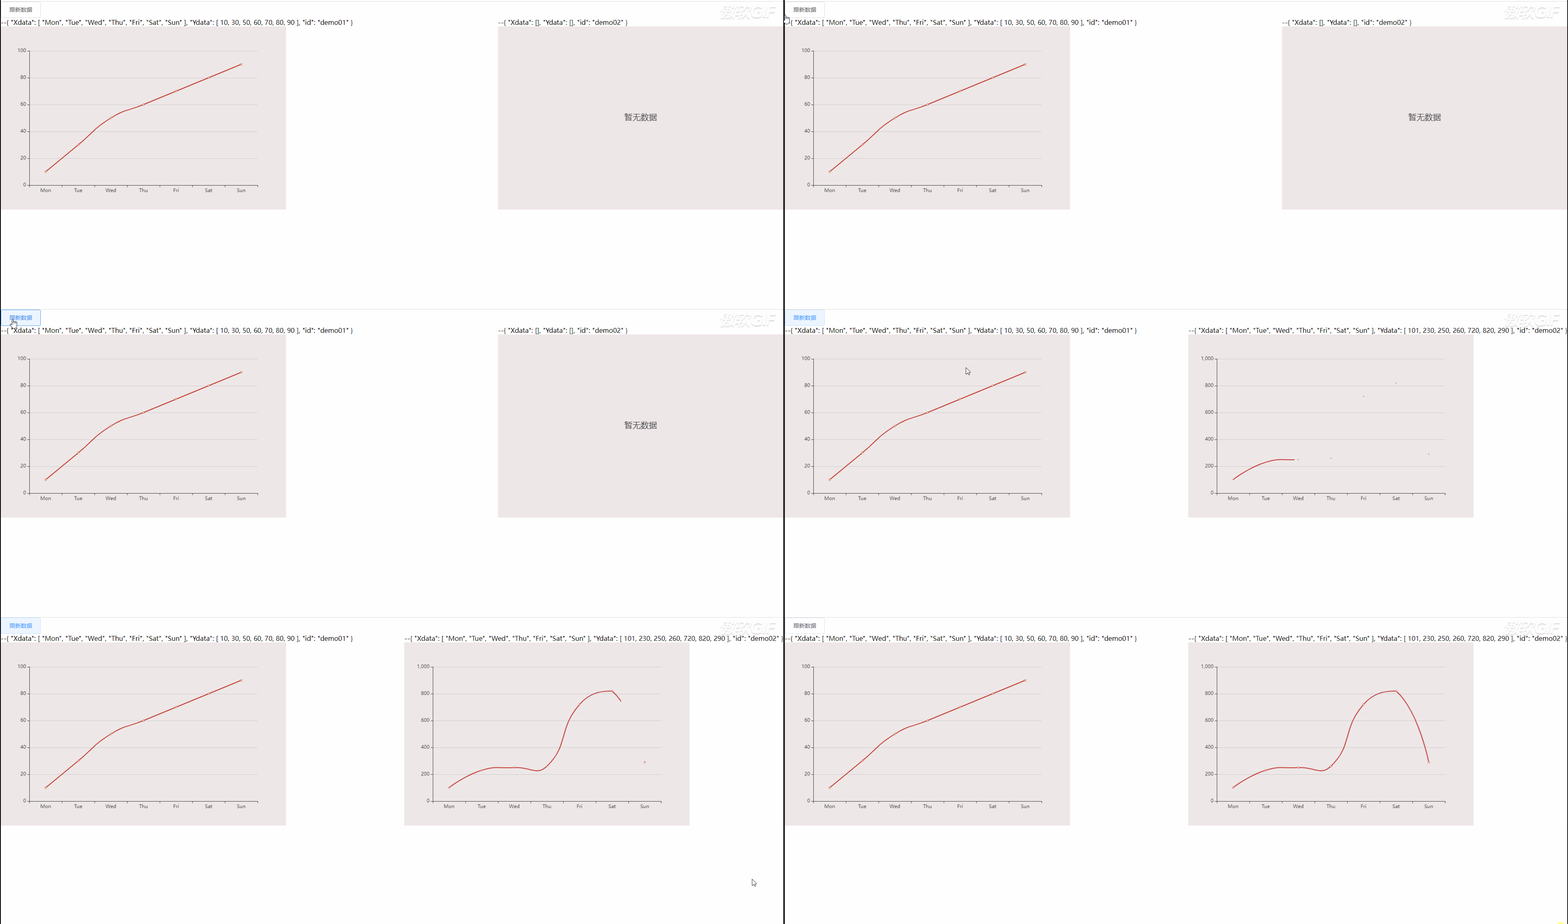
props中的資料更新後為什麼檢視沒有重新渲染?
如果按照上面這樣的寫法,我們新增一個點選按鈕跟新資料,。
echarts圖表是不會變化的。
因為在子元件中渲染是在mounted中被觸發的,一個圖表只會觸發一次。
即使後面我們更新了資料,子元件中的 mounted 不會被執行。
所以不會在重新更新檢視。
我們可以使用wachtch來解決這個問題

watch來解決資料變化後檢視立即更新
<!-- 父元件更新資料updateHandler  -->
<template>
  <div>
    <el-button @click="updateHandler">跟新資料</el-button>
    <div class="box">
      <echartsLine v-for="(item,index) in listArr"
        :echartsData="item" :key="index">
      </echartsLine>
    </div>
  </div>
</template>

data() {
  return {
    listArr: [
      {
        Xdata: ['Mon', 'Tue', 'Wed', 'Thu', 'Fri', 'Sat', 'Sun'],
        Ydata: [10, 30, 50, 60, 70, 80, 90],
        id:'demo01'
      },
      {
        Xdata: [],
        Ydata: [],
        id: 'demo02'
      }
    ]
  }
},
methods: {
  updateHandler() {
    this.listArr[1].Xdata=['Mon', 'Tue', 'Wed', 'Thu', 'Fri', 'Sat', 'Sun']
    this.listArr[1].Ydata = [101, 230, 250, 260, 720, 820, 290]
  }
}
<!-- 子元件使用watch進行監聽 關鍵程式碼-->
mounted() {
  this.showEcharts()
},
methods:{
  showEcharts(){
    // 渲染了 echarts
  }
},
watch: {
  // echartsData 是props中傳遞給echarts中需要渲染的資料
  // 通過watch監聽屬性去監視props 中echartsData資料的變化
  // 當屬性發生變化的時候,呼叫showEcharts方法重現渲染echarts圖表
  echartsData: {
    handler(newVal, oldVal) {
      this.showEcharts()
    },
    // 這裡的deep是深度監聽,因為我們傳遞過來的是一個物件
    deep: true,
  }
},
每個頁面可以單獨設定echarts的各個屬性
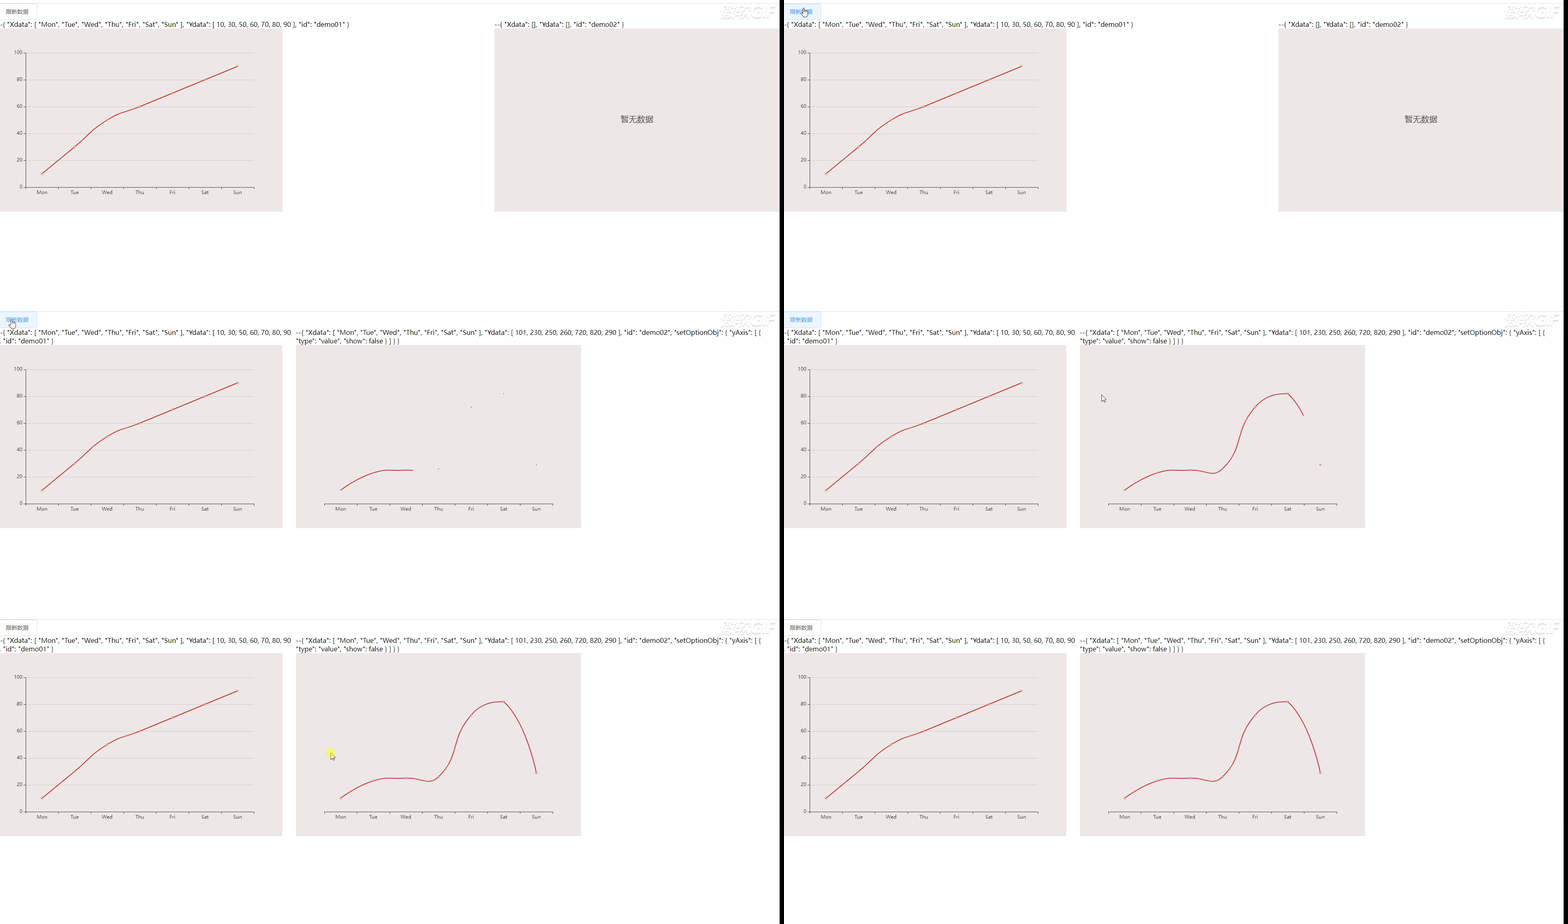
按照我們目前的寫法,父頁面無法對echarts圖表進行設定。
因為我們子元件中的設定項寫死了。
為了是元件更加的靈活,我們需要對子元件中的設定項進行修改。
讓它可以接收父頁面中的設定項哈,我們將使用 Object.assign 將它實現
// 父元件進行單獨設定某一個設定項
updateHandler() {
  this.listArr[1].Xdata = ['Mon', 'Tue', 'Wed', 'Thu', 'Fri', 'Sat', 'Sun']
  this.listArr[1].Ydata = [101, 230, 250, 260, 720, 820, 290]
  // 點選按鈕的時候,右邊的那個echarts 圖不顯示Y軸線
  this.listArr[1]['setOptionObj'] = {
    yAxis: [{
      type: 'value',
      show: false,// 是否顯示座標軸中的y軸
    }]
  }
}
// 子元件使用 Object.assign 對資料進行合併
props: {
  echartsData: {
    type: Object,
    default: function() {
      return  {
        Xdata:[],
        Ydata: [],
        setOptionObj: { }
      }
    }
  },
},
// xxxx 其他程式碼
option = {
    xAxis: {
      type: 'category',
      data: this.echartsData.Xdata
    },
    yAxis: {
      type: 'value'
    },
    series: [
      {
        data: this.echartsData.Ydata,
        type: 'line',
        smooth: true
      }
    ]
  };
// xxxx 其他程式碼
// 使用物件合併的方式讓父元件可以對設定項可以單獨設定
option= Object.assign(option, this.echartsData.setOptionObj)
// 設定 echats,在頁面上進行展示
this.char.setOption(option);
可以設定多條折線圖
按照我們目前的程式碼,是無法設定多條折線的。
多條折線 series 中有多條資料,單條只有一條
單條折線的 series: [{
  data: [820, 932, 901, 934, 1290, 1330, 1320],
  type: 'line',
  smooth: true
}]
多條折線 series: [{
  name: 'Email',
  type: 'line',
  stack: 'Total',
  data: [120, 132, 101, 134, 90, 230, 210]
},
{
  name: 'Union Ads',
  type: 'line',
  stack: 'Total',
  data: [220, 182, 191, 234, 290, 330, 310]
}]
所以我們只要判斷是否有series欄位,如果有說明是多條折線。
否者就是單條折線
優化一下子元件中的程式碼
// 父頁面
updateHandler() {
  this.listArr[1].Xdata = ['Mon', 'Tue', 'Wed', 'Thu', 'Fri', 'Sat', 'Sun']
  this.listArr[1].Ydata = [101, 230, 250, 260, 720, 820, 290]
  this.listArr[1]['setOptionObj'] = {
    yAxis: [{
      type: 'value',
      show: false,// 是否顯示座標軸中的y軸
    }]
  }
  // 設定多條折線
  this.listArr[1]['series'] = {
    data: [{
      name: 'Email',
      type: 'line',
      stack: 'Total',
      data: [120, 132, 101, 134, 90, 230, 210]
    },
    {
      name: 'Union Ads',
      type: 'line',
      stack: 'Total',
      data: [220, 182, 191, 234, 290, 330, 310]
    }]
  }
}
// 子元件
// xxxx 其他程式碼
option = {
  xAxis: {
    type: 'category',
    data: this.echartsData.Xdata
  },
  yAxis: {
    type: 'value'
  },
  series: []
};
// 如果父元件中有 series 這個欄位,我們渲染多條折線
if (this.echartsData.series
    && this.echartsData.series.data
    && this.echartsData.series.data.length){
    let legendArr =[]
    for (let i = 0; i < this.echartsData.series.data.length; i++){
      option.series.push(this.echartsData.series.data[i])
      legendArr.push(this.echartsData.series.data[i].name)
    }
    // 同時預設設定設定 legend, 當然父元件是可以到單獨設定的
    option.legend = {
      x: 'center',
      data: legendArr,
      icon: "circle", // 這個欄位控制形狀 型別包括 circle,rect ,roundRect,triangle,diamond,pin,arrow,none
      itemWidth: 10, // 設定寬度
      itemHeight: 10, // 設定高度
      itemGap: 32 // 設定間距
    }
  } else {
    // 否者就是單條折線
    option.series.push({
      data: this.echartsData.Ydata,
      type: 'line',
      smooth: true
    })
  }
  // 使用物件合併的方式讓父元件可以對設定項可以單獨設定
  option= Object.assign(option, this.echartsData.setOptionObj)
}
this.chart.setOption(option);

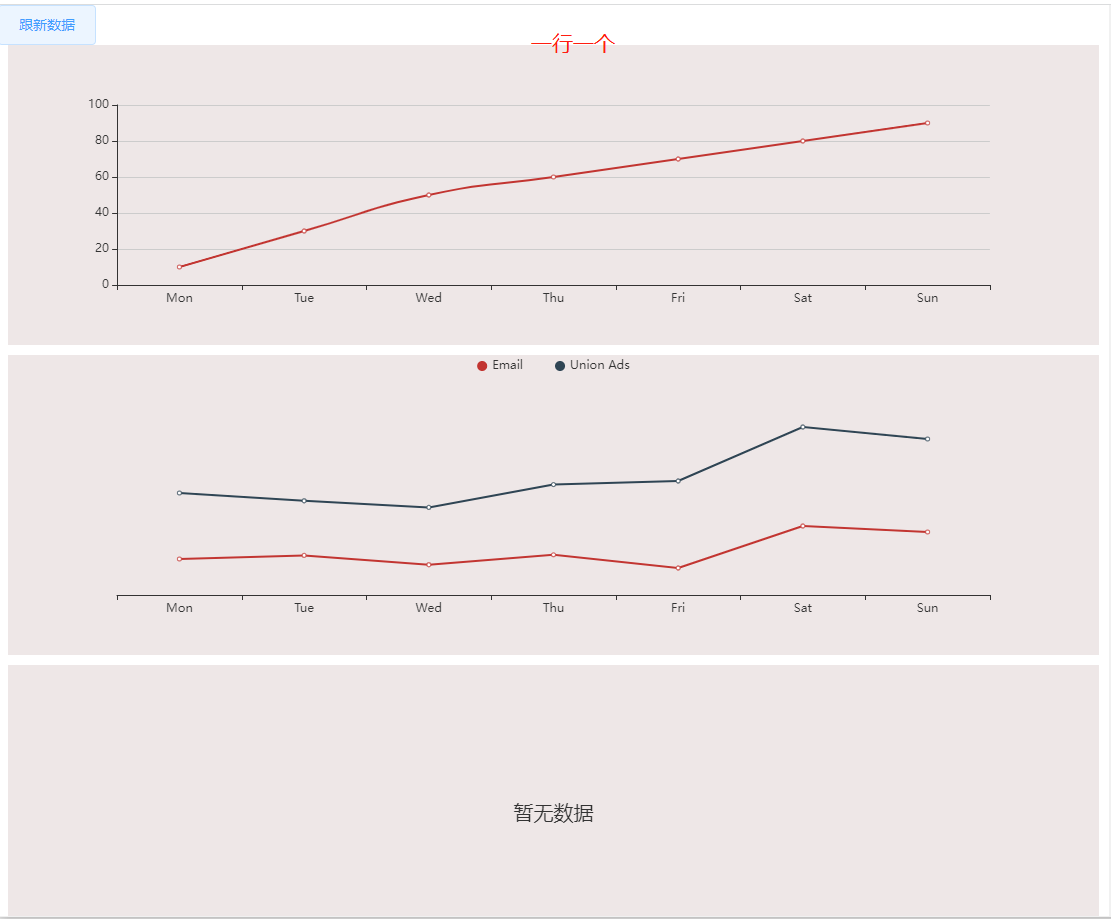
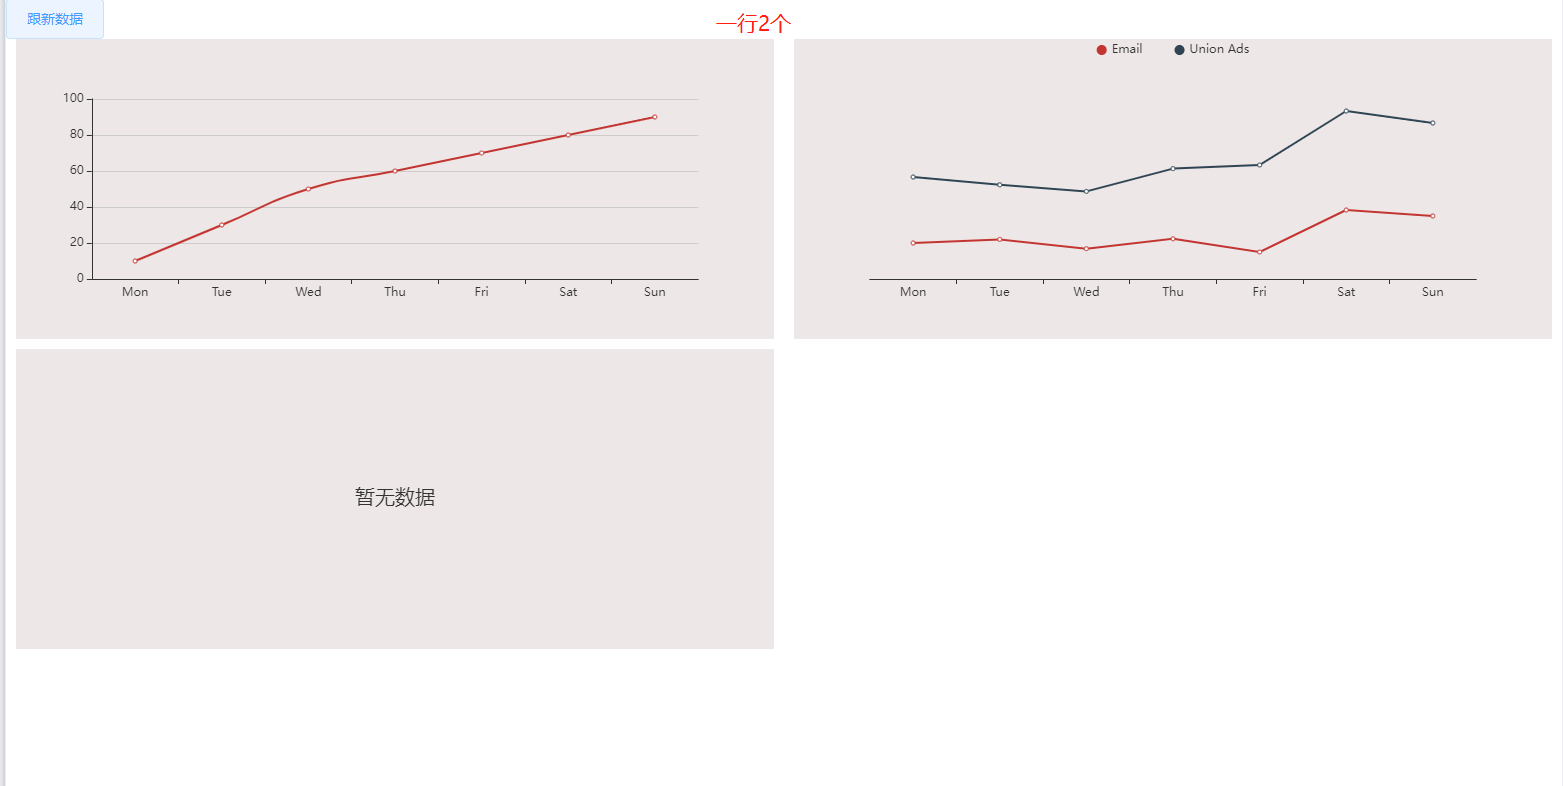
根據螢幕大小自動排列一行顯示多少個圖
由於使用者的裝置不同,有大有小。
所以我們需要對一行顯示多少個進行自動調整。
我們將使用 el-row 和 el-col 來實現
我們會獲取使用者的螢幕大小。
然後控制 el-col中的 span 的大小來決定一行顯示多少個
 <el-row :gutter="20" class="el-row-box">
  <el-col class="el-col-m" :span="gutterNum"
    v-for="(item, index) in listArr" :key="index">
    <div class="grid-content bg-purple">
      <echartsLine  :echartsData="item" ></echartsLine>
    </div>
  </el-col>
</el-row>

gutterNum:8, // 預設一行顯示3個圖

created() {
  // 獲取頁面的寬高可以在 created 函數中,
  // 如果獲取的是dom節點者【最早】需要在 mounted
  // 以前以為獲取頁面寬高需要在 mounted中
  this.getClientWidth()
},
// 註冊事件,進行監聽
mounted(){
  window.addEventListener('resize', this.getClientWidth)
},
beforeDestroy(){
  window.removeEventListener('resize', this.getClientWidth)
},
 methods: {
    getClientWidth() {
      // 獲取螢幕寬度按動態分配一行幾個圖
      let clientW = document.body.clientWidth;
      console.log('clientW', clientW)
      if (clientW >= 1680) {
        this.gutterNum = 8
      } else if(clientW >= 1200){
        this.gutterNum = 12
      } else if(clientW < 1200){
        this.gutterNum = 24
      }
    },
}

echarts隨螢幕大小自動進行縮放
我們將會使用echarts提供的 resize 方法來進行縮放螢幕的大小。
在mounted註冊監聽螢幕大小變化的事件,然後呼叫 resize
data() {
  return {
    char: null
  }
},

mounted() {
  console.log('有幾個echarts圖,mounted函數就會被執行幾次')
  this.showEcharts()
  window.addEventListener('resize', this.changeSize)
},
beforeDestroy() {
  console.log('有幾個echarts圖,beforeDestroy函數就會被執行幾次')
  window.removeEventListener('resize', this.changeSize)
},
methods: {
  changeSize() {
    console.log('這裡有可能是undefined為啥還可以正常縮放echarts', this.chart)
    this.char && this.char.resize()
  }
}

總結
1. 使用watch去監聽props中的物件,不能這樣寫
watch: {
   // echartsData假設為props中定義了的。
   echartsData: function (newValue,oldValue) {
    console.log('newValue', newValue);
    console.log('oldValue', oldValue);
  },
  deep: true,
}
上面這樣去監聽物件將無法觸發。上面這樣的只能夠監聽基本資料型別
我們應該改寫為:
watch: {
  echartsData: {
      handler() {
        this.showEcharts()
      },
      deep: true,
    }
}

2.子元件中 mounted 將會被多次渲染。
它的渲染次數取決於父頁面中需要顯示多少個echarts圖。
這也是為什麼echarts不會渲染出錯(A指標中資料不會被渲染到C指標中)
同理,由於子元件中mounted 將會被多次渲染,它會給每一個echarts註冊上縮放事件(resize)
離開的頁面的時候,beforeDestro也將會被多次觸發,依次移除監聽事件

3.獲取檔案中頁面的大小可以放在created。
以前看見其他小夥伴document.body.clientWidth 是寫在 mounted 中的。
不過獲取節點只能寫在 mounted 中

4.小夥伴可能發現了,this.char 也就是echarts的範例是undefined。
也可以正常的縮放成功呢?
這個問題我們下次可以講一下。
各位大佬,麻煩點個贊,收藏,評論
全部程式碼
父頁面
<template>
  <div class="page-echarts">
    <el-button @click="updateHandler">跟新資料</el-button>
    <el-row :gutter="20" class="el-row-box">
      <el-col class="el-col-m" :span="gutterNum" v-for="(item, index) in listArr" :key="index">
        <div class="grid-content bg-purple">
          <echartsLine  :echartsData="item" ></echartsLine>
        </div>
      </el-col>
    </el-row>
  </div>
</template>
<script>
import echartsLine from "@/components/echarts/echarts-line.vue"
export default {
  components: {
    echartsLine
  },
  data() {
    return {
      gutterNum:8,
      listArr: [
        {
          Xdata: ['Mon', 'Tue', 'Wed', 'Thu', 'Fri', 'Sat', 'Sun'],
          Ydata: [10, 30, 50, 60, 70, 80, 90],
          id:'demo01'
        },
        {
          Xdata: [],
          Ydata: [],
          id: 'demo02',
        },
        {
          Xdata: [],
          Ydata: [],
          id: 'demo03',
        },
      ]
    }
  },
  created() {
    // 獲取頁面的寬高可以在 created 函數中,
    // 如果獲取的是dom節點者【最早】需要在 mounted
    // 以前以為獲取頁面寬高需要在 mounted中
    this.getClientWidth()
  },
  mounted() {
    // 註冊事件,進行監聽
    window.addEventListener('resize', this.getClientWidth)
  },
  beforeDestroy(){
    window.removeEventListener('resize', this.getClientWidth)
  },
  methods: {
    getClientWidth() {
      // 獲取螢幕寬度按動態分配一行幾個圖
      let clientW = document.body.clientWidth;
      console.log('clientW', clientW)
      if (clientW >= 1680) {
        this.gutterNum = 8
      } else if(clientW >= 1200){
        this.gutterNum = 12
      } else if(clientW < 1200){
        this.gutterNum = 24
      }
    },
    updateHandler() {
      this.listArr[1].Xdata = ['Mon', 'Tue', 'Wed', 'Thu', 'Fri', 'Sat', 'Sun']
      this.listArr[1].Ydata = [101, 230, 250, 260, 720, 820, 290]
      this.listArr[1]['setOptionObj'] = {
        yAxis: [{
          type: 'value',
          show: false,// 是否顯示座標軸中的y軸
        }]
      }
      this.listArr[1]['series'] = {
        data: [{
          name: 'Email',
          type: 'line',
          stack: 'Total',
          data: [120, 132, 101, 134, 90, 230, 210]
        },
        {
          name: 'Union Ads',
          type: 'line',
          stack: 'Total',
          data: [220, 182, 191, 234, 290, 330, 310]
        }]
      }
    }
  }
}
</script>

<style lang="scss" scoped>
// 有些是否感覺 x軸有卷軸
.page-echarts{
  overflow: hidden;
}
.el-row-box{
  margin-left: 0px !important;
  margin-right: 0px !important;
}
.el-col-m{
  margin-bottom: 10px;
}
</style>
子元件
<template>
  <div class="echarts-box">
    <div :style="{ height:height}" class="chart" :id="echartsData.id" ref="demo"></div>
  </div>
</template>
<script>
import echarts from 'echarts'
export default {
  props: {
    height: {
      type: String,
      default:'300px'
    },
    echartsData: {
      type: Object,
      default: function() {
        return  {
          Xdata:[],
          Ydata: [],
          setOptionObj: { }
        }
      }
    },
    showData: {
      type: String,
    }
  },
  data() {
    return {
      char: null
    }
  },
  mounted() {
    console.log('有幾個echarts圖,mounted函數就會被執行幾次')
    this.showEcharts()
    window.addEventListener('resize', this.changeSize)
  },
  beforeDestroy() {
    console.log('有幾個echarts圖,beforeDestroy函數就會被執行幾次')
    window.removeEventListener('resize', this.changeSize)
  },
  watch: {
    // 通過watch監聽屬性去監視props 中echartsData資料的變化
    // 當屬性發生變化的時候,呼叫showEcharts方法重現渲染echarts圖表
    echartsData: {
      handler() {
        this.showEcharts()
      },
      // 這裡的deep是深度監聽,因為我們傳遞過來的是一個物件
      deep: true,
    }
  },
  methods: {
    changeSize() {
      console.log('這裡有可能是undefined為啥還可以正常縮放echarts', this.chart)
      this.char && this.char.resize()
    },
    showEcharts() {
      // 獲取dom節點,
      let demo=this.$refs.demo
      // 初始化echarts
      this.char = echarts.init(demo)
      this.char.clear()  // 在渲染之前清空範例
      let option = {}
      // 如果無資料的話,將展示暫無資料
      if (this.echartsData.Xdata && this.echartsData.Xdata.length == 0) {
        option = {
          title: {
            text: '暫無資料',
            x: 'center',
            y: 'center',
            textStyle: {
              fontSize: 20,
              fontWeight: 'normal',
            }
          }
        }
      } else {
        option = {
          xAxis: {
            type: 'category',
            data: this.echartsData.Xdata
          },
          yAxis: {
            type: 'value'
          },
          series: []
        };
        // 如果父元件中有 series 這個欄位,我們渲染多條折線
        if (this.echartsData.series && this.echartsData.series.data&& this.echartsData.series.data.length) {
          let legendArr =[]
          for (let i = 0; i < this.echartsData.series.data.length; i++){
            option.series.push(this.echartsData.series.data[i])
            legendArr.push(this.echartsData.series.data[i].name)
          }
          // 同時預設設定設定 legend, 當然父元件是可以到單獨設定的
          option.legend = {
            x: 'center',
            data: legendArr,
            icon: "circle", // 這個欄位控制形狀 型別包括 circle,rect ,roundRect,triangle,diamond,pin,arrow,none
            itemWidth: 10, // 設定寬度
            itemHeight: 10, // 設定高度
            itemGap: 32 // 設定間距
          }
        } else {
          // 否者就是單條折線
          option.series.push({
            data: this.echartsData.Ydata,
            type: 'line',
            smooth: true
          })
        }
        // 使用物件合併的方式讓父元件可以對設定項可以單獨設定
        option= Object.assign(option, this.echartsData.setOptionObj)
      }
      this.char.setOption(option);
    }
  }
}
</script>

<style scoped>
.echarts-box{
  width: 100%;
  height: 100%;
}
.chart {
  background: #eee7e7;
}
</style>
遇見問題,這是你成長的機會,如果你能夠解決,這就是收穫。
作者:晚來南風晚相識
出處:https://www.cnblogs.com/IwishIcould/

 本文版權歸作者所有,歡迎轉載,未經作者同意須保留此段宣告,在文章頁面明顯位置給出原文連線
如果文中有什麼錯誤,歡迎指出。以免更多的人被誤導。
出處:https://www.cnblogs.com/IwishIcould/
想問問題,打賞了卑微的博主,求求你備註一下的扣扣或者微信;這樣我好聯絡你;(っ•̀ω•́)っ✎⁾⁾!
如果覺得這篇文章對你有小小的幫助的話,記得在右下角點個「推薦」哦,或者關注博主,在此感謝!
萬水千山總是情,打賞5毛買辣條行不行,所以如果你心情還比較高興,也是可以掃碼打賞博主(っ•̀ω•́)っ✎⁾⁾!
想問問題,打賞了卑微的博主,求求你備註一下的扣扣或者微信;這樣我好聯絡你;(っ•̀ω•́)っ✎⁾⁾!

支付寶

微信
如果文中有什麼錯誤,歡迎指出。以免更多的人被誤導。