深度學習煉丹-資料標準化
前言
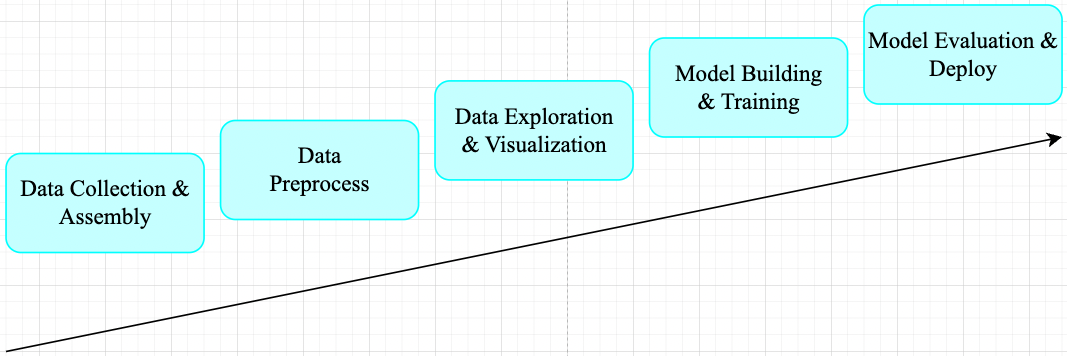
一般機器學習任務其工作流程可總結為如下所示 pipeline。
在工業界,資料預處理步驟對模型精度的提高的發揮著重要作用。對於機器學習任務來說,廣泛的資料預處理一般有四個階段(視覺任務一般只需 Data Transformation): 資料淨化(Data Cleaning)、資料整合(Data Integration)、資料轉換(Data Transformation)和資料縮減(Data Reduction)。
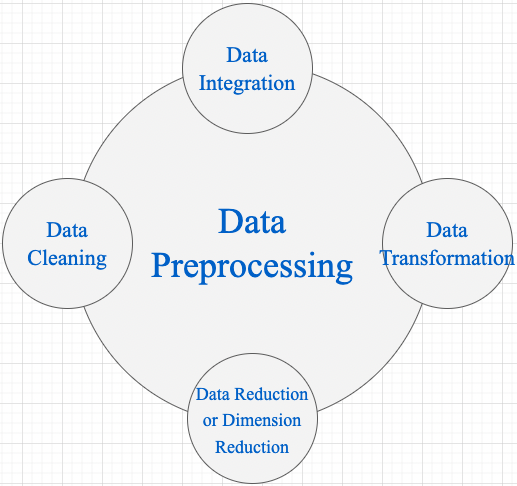
1,Data Cleaning: 資料清理是資料預處理步驟的一部分,通過填充缺失值、平滑噪聲資料、解決不一致和刪除異常值來清理資料。
2,Data Integration: 用於將存在於多個源中的資料合併到一個更大的資料儲存中,如資料倉儲。例如,將來自多個醫療節點的影象整合起來,形成一個更大的資料庫。
3,Data Transformation : 在完成 Data Cleaning 後,我們需要使用以下資料轉換策略更改資料的值、結構或格式。
Generalization: 使用概念層次結構將低階或粒度資料轉換為高階資訊。例如將城市等地址中的原始資料轉化為國家等更高層次的資訊。Normalization: 目的是將數位屬性按比例放大或縮小以適合指定範圍。Normalization常見方法:Min-max normalization:將資料對映到 \([0,1]\) 區間。Z-Score normalization:把每個特徵值中的所有資料,變成平均值為0,標準差為1的資料,最後為正態分佈。- Decimal scaling normalization
4,Data Reduction 資料倉儲中資料集的大小可能太大而無法通過資料分析和資料探勘演演算法進行處理。一種可能的解決方案是獲得資料集的縮減表示,該資料集的體積要小得多,但會產生相同質量的分析結果。常見的資料縮減策略如下:
Data cube aggregationDimensionality reduction: 降維技術用於執行特徵提取。資料集的維度是指資料的屬性或個體特徵。該技術旨在減少我們在機器學習演演算法中考慮的冗餘特徵的數量。降維可以使用主成分分析(PCA)等技術來完成。Data compression: 通過使用編碼技術,資料的大小可以顯著減小。Discretization: 資料離散化用於將具有連續性的屬性劃分為具有區間的資料。這樣做是因為連續特徵往往與目標變數相關的可能性較小。例如,屬性年齡可以離散化為 18 歲以下、18-44 歲、44-60 歲、60 歲以上等區間。
對於計算機視覺任務來說,在訓練 CNN 模型之前,對於輸入樣本特徵資料做標準化(normalization,也叫歸一化)預處理(data preprocessing)操作是最常見的步驟。
一,Normalization 概述
後續內容對 Normalization 不再使用中文翻譯,是因為目前中文翻譯有些歧義,根據我查閱的部落格資料,翻譯為「歸一化」比較多,但僅供可參考。
1.1,Normalization 定義
Normalization 操作被用於對資料屬性進行縮放,使其落在較小的範圍之內(即變化到某個固定區間中),比如 [-1,1] 和 [0, 1],簡單理解就是特徵縮放過程。很多機器學習演演算法都受益於 Normalization 操作,比如:
- 通常對分類演演算法有用。
- 在梯度下降等機器學習演演算法的核心中使用的優化演演算法很有用。
- 對於加權輸入的演演算法(如迴歸和神經網路)以及使用距離度量的演演算法(如 K 最近鄰)也很有用。
1.2,什麼情況需要 Normalization
當我們處理的資料具有不同尺度(範圍)(different scale)時,通常就需要進行 normalization 操作了。
資料具有不同尺度的情況會導致一個重要屬性(在較低尺度上)的有效性被稀釋,因為其他屬性可能具有更大範圍(尺度)的值,簡單點理解就是範圍(scale)大的屬性在模型當中更具優先順序,具體範例如下圖所示。
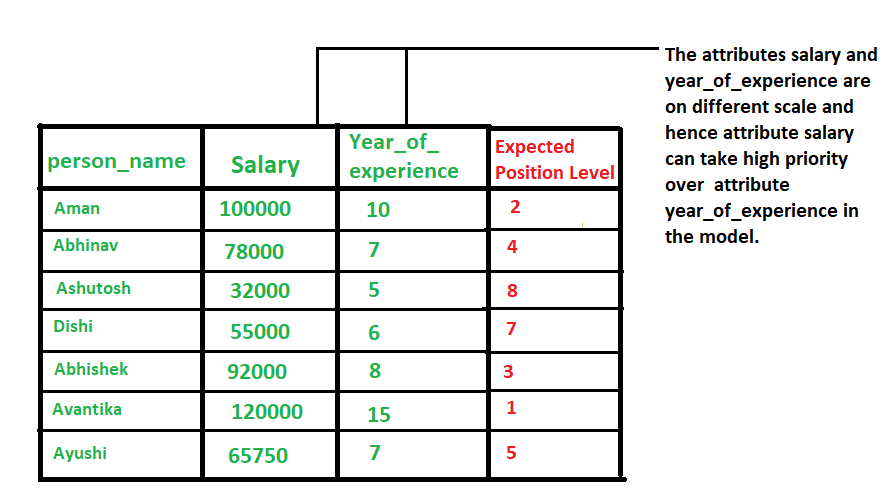
總結起來就是,當資料存在多個屬性但其值具有不同尺度(scale)時,這可能會導致我們在做資料探勘操作時資料模型表現不佳,因此這時候執行 normalization 操作將所有屬性置於相同的尺寸內是很有必要的。
1.3,為什麼要做 Normalization
-
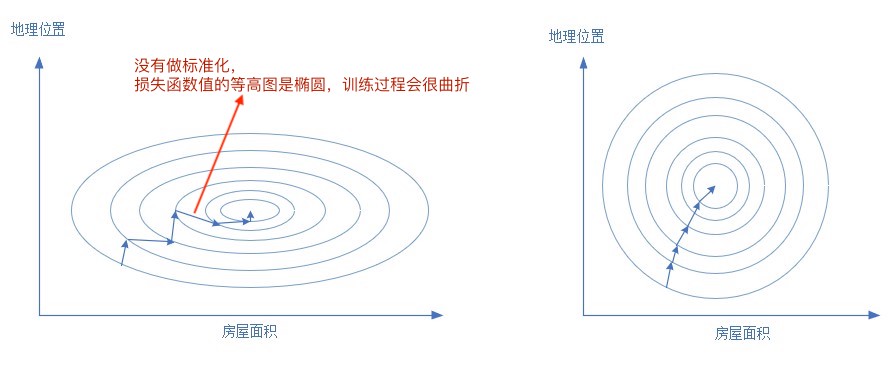
樣本的各個特徵的取值要符合概率分佈,即 \([0,1]\)(也可理解為降低模型訓練對特徵尺度的敏感度)。輸入資料特徵取值範圍和輸出標籤範圍一樣,從損失函數等高線圖來分析,不做 Normalization 的訓練過程會更曲折。
-
神經網路假設所有的輸入輸出資料都是標準差為1,均值為0,包括權重值的初始化,啟用函數的選擇,以及優化演演算法的設計。
-
避免一些不必要的數值問題。
因為啟用函數 sigmoid/tanh 的非線性區間大約在 [−1.7,1.7]。意味著要使神經元的啟用函數有效,線性計算輸出的值的數量級應該在1(1.7所在的數量級)左右。這時如果輸入較大,就意味著權值必須較小,一個較大,一個較小,兩者相乘,就引起數值問題了。
-
梯度更新。
若果輸出層的數量級很大,會引起損失函數的數量級很大,這樣做反向傳播時的梯度也就很大,這時會給梯度的更新帶來數值問題。
-
學習率。
特徵資料數值範圍不同,正確的梯度更新方向需要的學習率也會不同(如果梯度非常大,學習率就必須非常小),即不同神經元權重 \(w_1\)、\(w_2\) 所需的學習率也不同。因此,學習率(學習率初始值)的選擇需要參考輸入的範圍,這樣不如直接將資料標準化,這樣學習率就不必再根據資料範圍作調整。
1.4,Data Normalization 常用方法
1,z-Score Normalization
zero-mean Normalization,有時也稱為 standardization,將資料特徵縮放成均值為 0,方差為 1 的分佈,對應公式:
其中:
- \(x\):原始值
- \(mean(x)\):表示變數 \(x\) 的均值(有些地方用 \(\mu =\frac{1}{N}\sum_{i=1}^{N} x_i\))
- \(\sigma\): 表示變數的標準差(總體標準差數學定義 \(\sigma = \sqrt{\frac{1}{N} \sum_{i=1}^{N}(x_i - \mu)^2}\) )
- \({x}'\) 是資料縮放後的新值
經過 zero-mean Normalization 操作之後的資料正態分佈函數曲線圖會產生如下所示轉換。
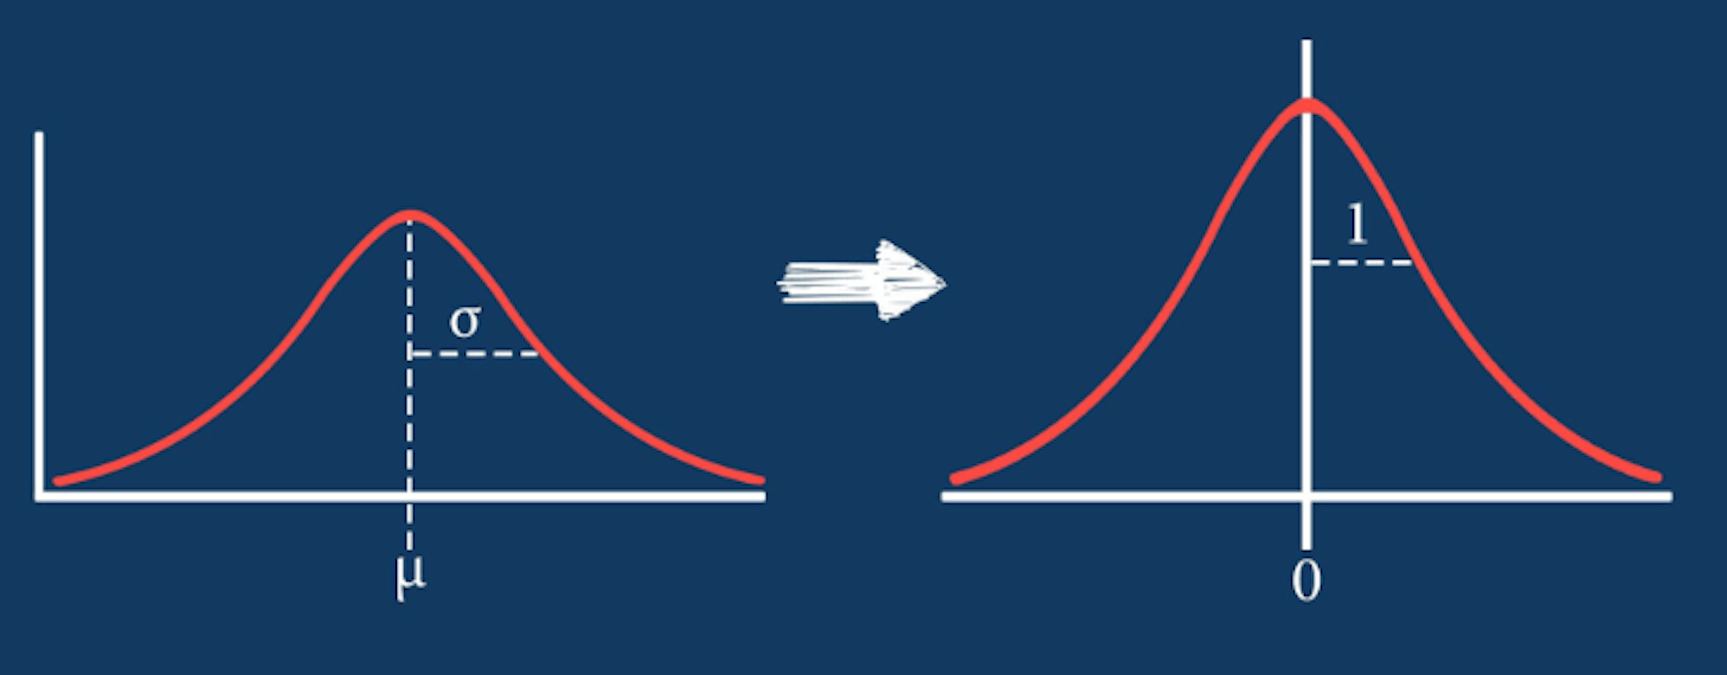
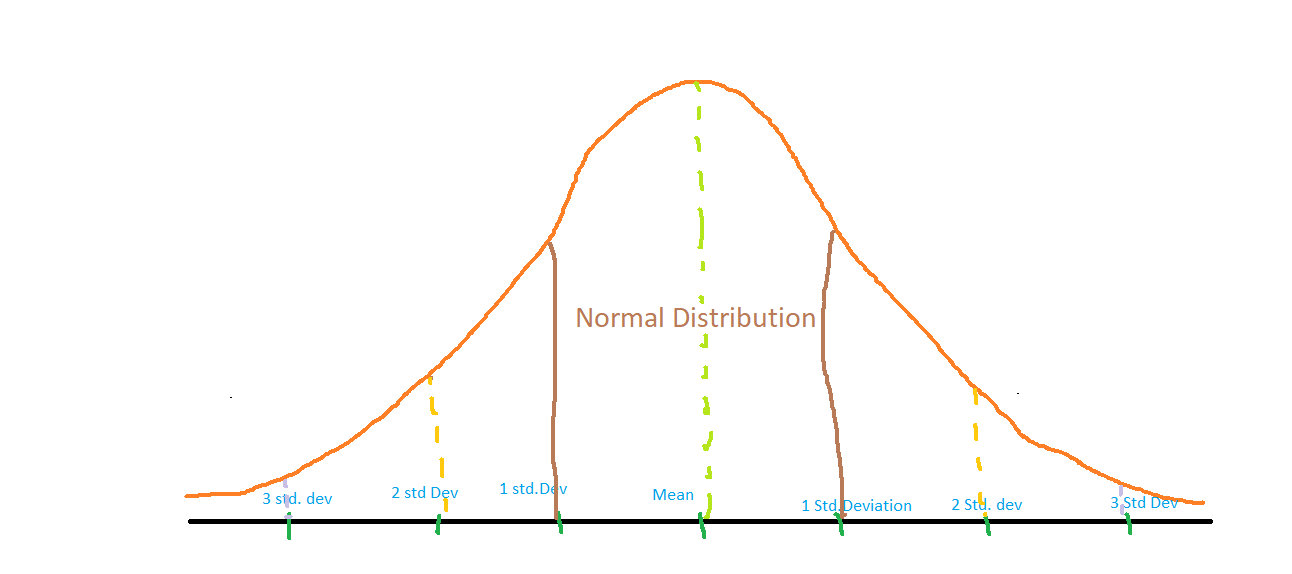
其中,正態分佈函數曲線中均值和標準差值的確定參考下圖。
2,Min-Max Normalization
執行線性操作,將資料範圍縮放到 \([0,1]\) 區間內,對應公式:
其中 \(max(x)\) 是變數最大值,\(min(x)\) 是變數最小值。
1.5,程式碼實現
z-Score Normalization 方法既可以呼叫相關 python 庫的 api 實現,也可以自己實現相關功能。
以下是使用 sklearn 相關類和基於 numpy 庫實現 z-Score Normalization 功能,並給出資料直方圖對比的範例程式碼。
程式碼不是特別規範,僅供參考,當作功能理解和實驗測試用。
## 輸出高清影象
%config InlineBackend.figure_format = 'retina'
%matplotlib inline
import numpy as np
from sklearn import preprocessing
import matplotlib.pyplot as plt
%matplotlib inline
import seaborn as sns

np.random.seed(42)

plt.figure(dpi = 200)
plt.figure(figsize=(20, 15))
# X_train = np.array([[ 10., -1.7,  21.4],
#                     [ 2.4,  0.,  0.6],
#                     [ 0.9,  1., -1.9]])
# 生成指定 size 和 範圍 [low,high) 的隨機浮點數
X_train = np.random.uniform(low=0.0, high=100.0, size = (100, 15))
# 1, 繪製原始資料的直方圖
plt.subplot(3, 1, 1)
plt.title("original data distribution")
sns.distplot(X_train, color='y')

# 2, 應用 sklearn 庫的 z-Score Normalization 類,並繪製直方圖
scaler = preprocessing.StandardScaler().fit(X_train)
X_scaled = scaler.transform(X_train)
plt.subplot(3, 1, 2)
plt.title("z-Score Normalization by sklearn")
sns.distplot(X_scaled, color='r')

# 3,利用 numpy 函數實現 z-Score Normalization,並繪製直方圖
def z_Score_Normalization(data):
    data_mat = np.array(data)
    data_z_np = (data_mat - np.mean(data_mat, axis=0)) / np.std(data_mat, axis=0)
    return data_z_np

data_scaled = z_Score_Normalization(X_train)
plt.subplot(3, 1, 3)
plt.title("z-Score Normalization by numpy")
sns.distplot(data_scaled, color='g')
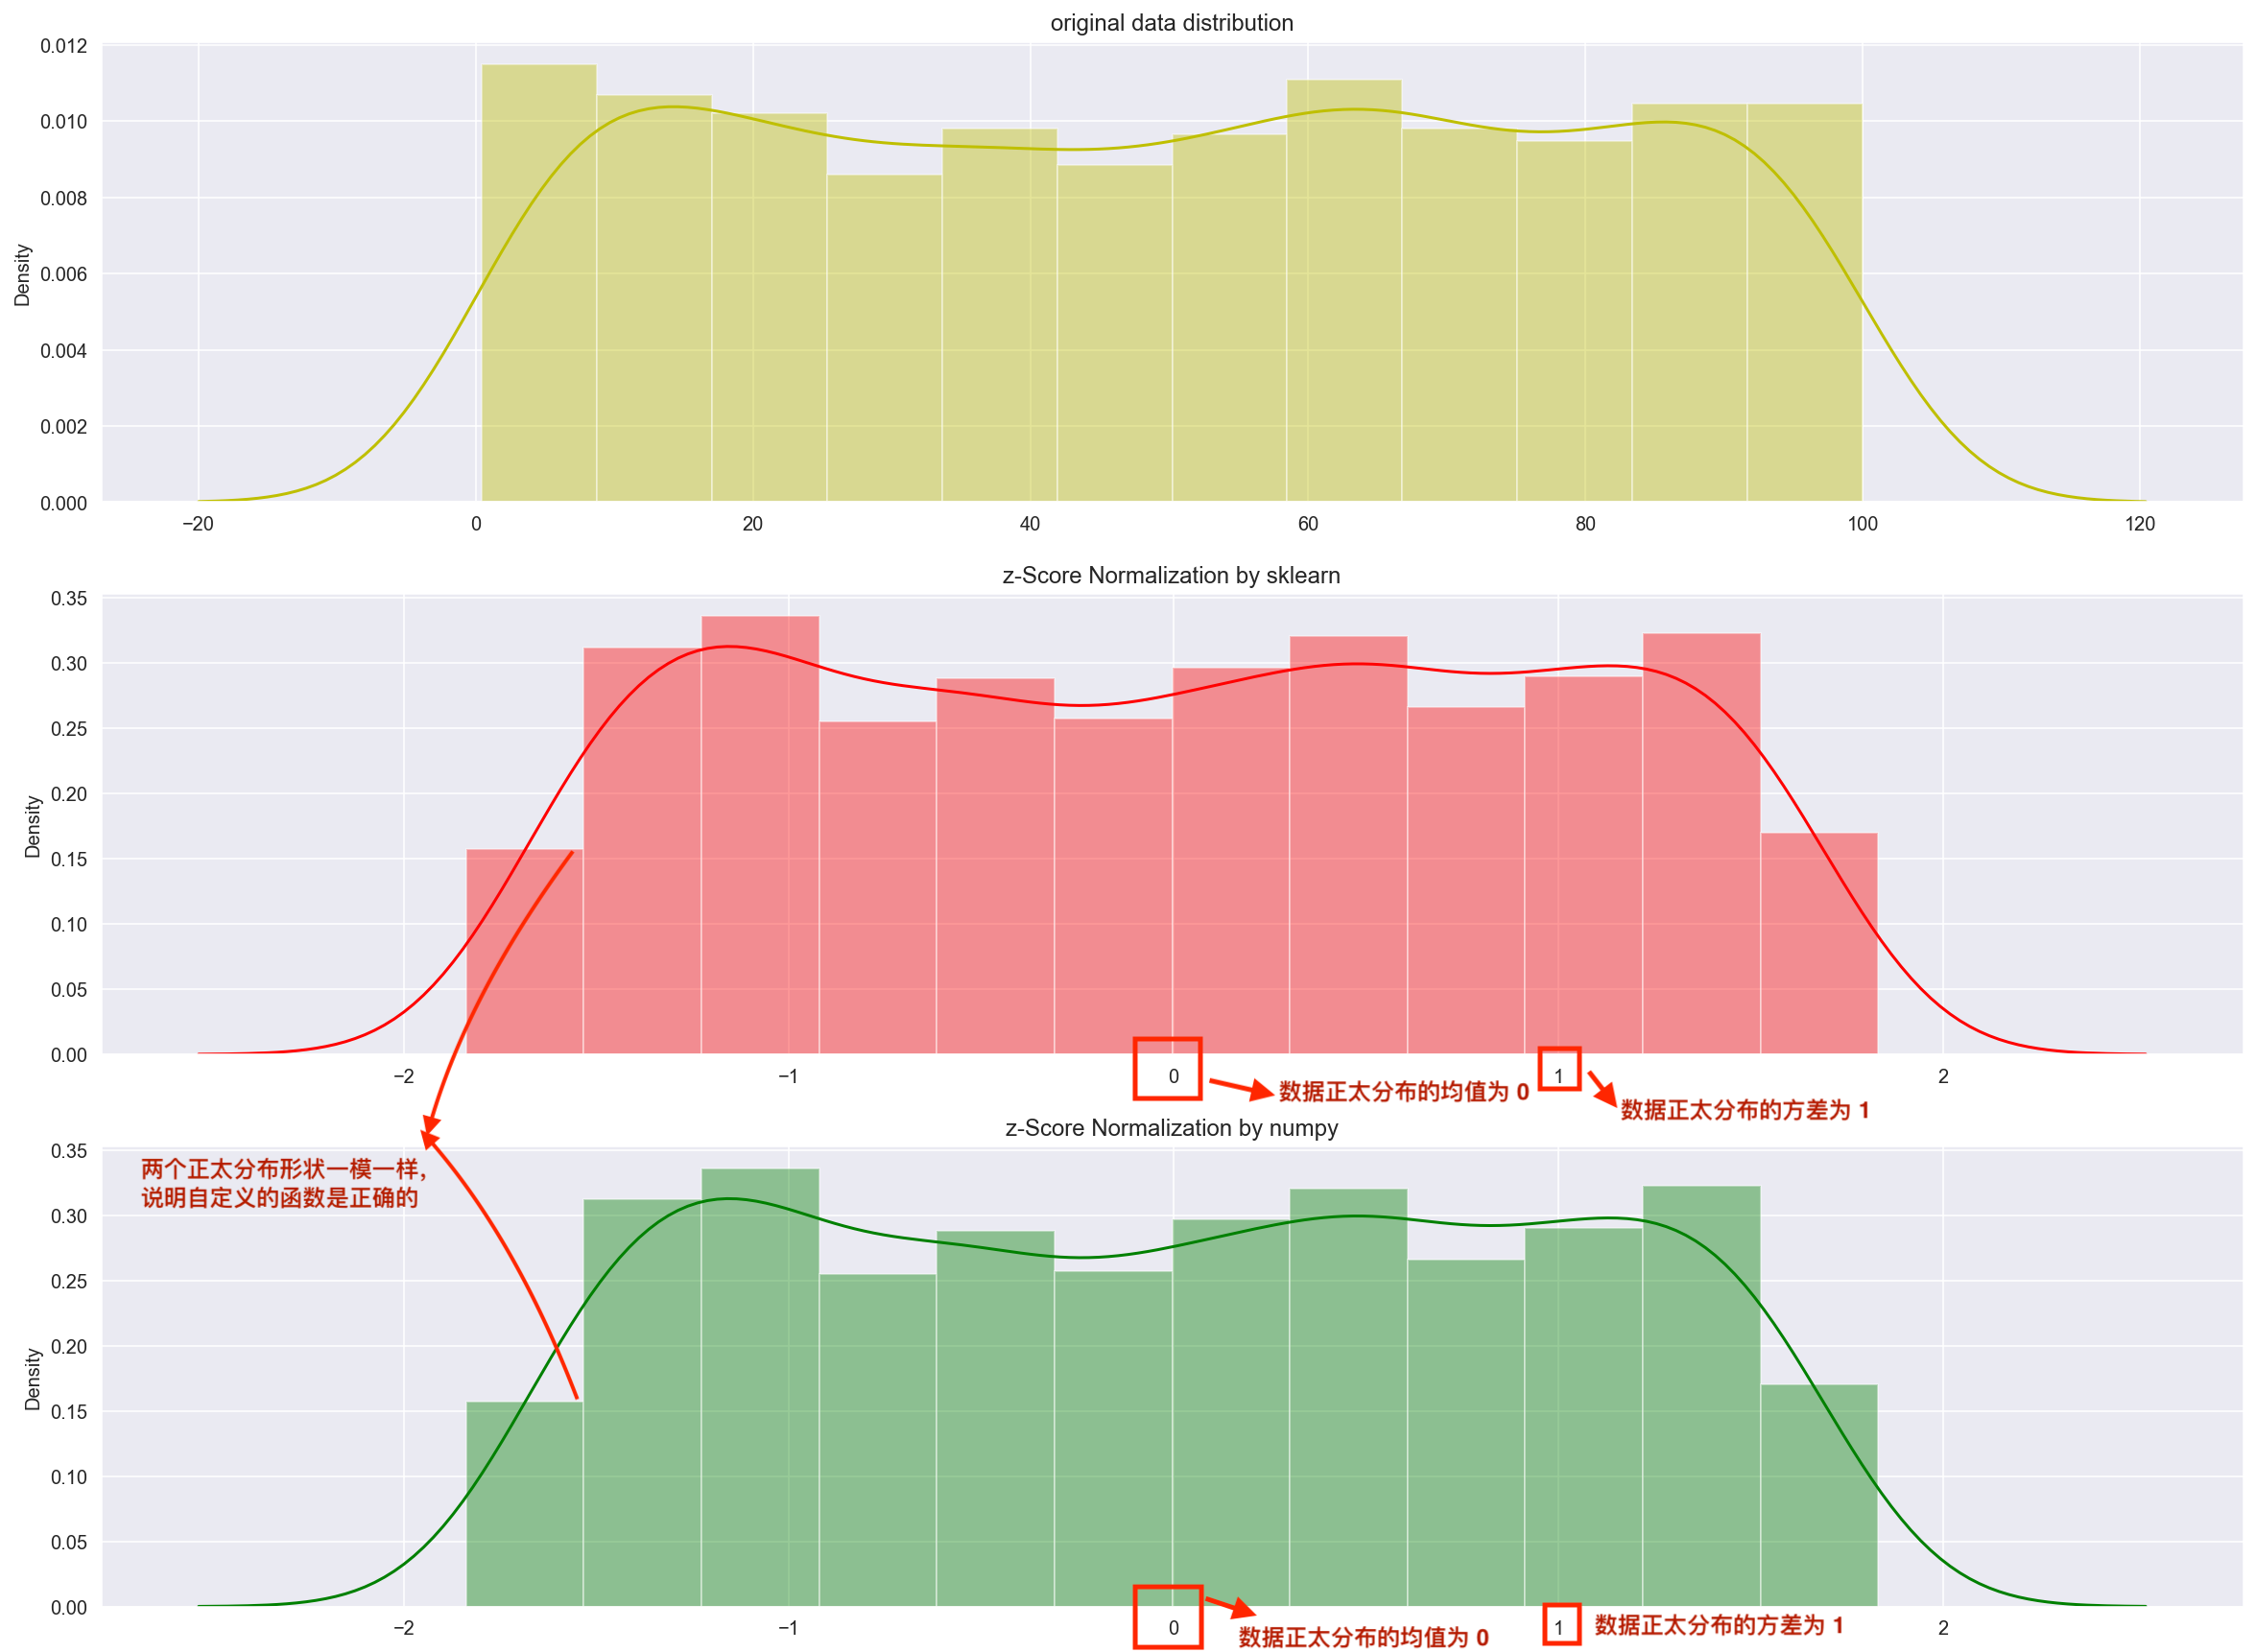
程式輸出結果如下。可以看出經過 z-Score Normalization 操作之後,原始資料的分佈轉化成平均值為 \(\mu=0\),標準差為 \(\sigma = 1\) 的正太分佈(稱為標準正態分佈)。
Min-Max Normalization 方法的實現比較簡單,以下是基於 numpy 庫實現 Min-Max Normalization 功能的範例程式碼:
# 匯入必要的庫
import numpy as np
# 定義資料集
X = np.array([[1, 2, 3], [4, 5, 6], [7, 8, 9]])
def Min_Max_Normalization(X):
    # 計算資料集的最小值和最大值
    Xmin = X.min()
    Xmax = X.max()
    # 計算最小-最大規範化
    X_norm = (X - Xmin) / (Xmax - Xmin)
    return X_norm
# 列印結果
print(Min_Max_Normalization(X))
程式輸出結果如下,可以看出原始陣列資料都被縮放到 \([0, 1]\) 範圍內了。

二,normalize images
2.1,影象 normalization 定義
當我們使用折積神經網路解決計算機視覺任務時,一般需要對輸入影象資料做 normalization 來完成預處理工作,常見的影象 normalization 方法有兩種: min-max normalization 和 zero-mean normalization。
1,以單張影象的 zero-mean Normalization 為例,它使得影象的均值和標準差分別變為 0.0 和 1.0。因為是多維資料,與純表格資料不同,它首先需要從每個輸入通道中減去通道平均值,然後將結果除以通道標準差。因此可定義兩種 normalization 形式如下所示:
# min-max Normalization
output[channel] = (input[channel] - min[channel]) / (max[channel] - min[channel])
# zero-mean Normalization
output[channel] = (input[channel] - mean[channel]) / std[channel]
2.2,影象 normalization 的好處
影象 normalization 有助於使資料處於一定範圍內並減少偏度(skewness),從而有助於模型更快更好地學習。歸一化還可以解決梯度遞減和爆炸的問題。
2.3,PyTorch 實踐影象 normalization
在 Pytorch 框架中,影象變換(image transformation)是指將影象畫素的原始值改變為新值的過程。其中常見的 transformation 操作是使用 torchvision.transforms.ToTensor() 方法將影象變換為 Pytorch 張量(tensor),它實現了將畫素範圍為 [0, 255] 的 PIL 影象轉換為形狀為(C,H,W)且範圍為 [0.0, 1.0] 的 Pytorch FloatTensor。另外,torchvision.transforms.normalize() 方法實現了逐 channel 的對影象進行標準化(均值變為 0,標準差變為 1)。總結如下:
min-max Normalization: 對應torchvision.transforms.ToTensor()方法zero-mean Normalization: 對應torchvision.transforms.Normalize()方法,利用用均值和標準差對張量影象進行 zero-mean Normalization。
ToTensor() 函數的語法如下:
"""
Convert a ``PIL Image`` or ``numpy.ndarray`` to tensor.
Converts a PIL Image or numpy.ndarray (H x W x C) in the range
[0, 255] to a torch.FloatTensor of shape (C x H x W) in the range [0.0, 1.0].

Args:
    pic (PIL Image or numpy.ndarray): Image to be converted to tensor.
Returns:
    Tensor: Converted image.
"""
Normalize() 函數的語法如下:
Syntax: torchvision.transforms.Normalize()

Parameter:
    * mean: Sequence of means for each channel.
    * std: Sequence of standard deviations for each channel.
    * inplace: Bool to make this operation in-place.
Returns: Normalized Tensor image.
torch.mean() 函數的語法如下(Tensor.mean() 和 torch.mean() 函數功能是一樣):
Syntax: torch.mean(input, dim, keepdim=False, *, dtype=None, out=None)

Parameters:
		* input(Tensor): the input tensor.
		* dim(int or tuple of ints): the dimension or dimensions to reduce.
		* keepdim (bool): whether the output tensor has dim retained or not.

Returns: the mean value of each row of the input tensor in the given dimension dim. If dim is a list of dimensions, reduce over all of them.

If keepdim is True, the output tensor is of the same size as input except in the dimension(s) dim where it is of size 1. Otherwise, dim is squeezed (see torch.squeeze()), resulting in the output tensor having 1 (or len(dim)) fewer dimension(s).
torch.mean() 函數實現返回給定維度 dim 中輸入張量的平均值。關於 dim 引數可以這麼理解,dim 就是返回的張量中會減少的 dim,不管 dim 是整數還是列表。如果輸入是 3 特徵資料張量,且 dim = (1,2),則表示求每個通道的平均值。範例程式碼如下:
import torch
x = torch.rand(3, 4, 8)
y1 = x.mean((1,2)) # 等效於 torch.mean(x, (1, 2))
y2 = x.mean(2)
print(y1.shape)
print(y2.shape)
"""
輸出結果:
	torch.Size([3])
	torch.Size([3, 4])
"""
在 PyTorch 中對影象執行 zero-mean Normalization 的步驟如下:
- 載入原影象;
- 使用 ToTensor() 函數將影象轉換為 Tensors;
- 計算 Tensors 的均值和方差;
- 使用 Normalize() 函數執行
zero-mean Normalization操作。
下面給出利用 PyTorch 實踐 Normalization 操作的詳細程式碼和輸出圖。
# import necessary libraries
from PIL import Image
import matplotlib.pyplot as plt
import numpy as np
import torchvision.transforms as transforms
import matplotlib.pyplot as plt

def show_images(imgs, num_rows, num_cols, titles=None, scale=8.5):
    """Plot a list of images.

    Defined in :numref:`sec_utils`"""
    figsize = (num_cols * scale, num_rows * scale)
    _, axes = plt.subplots(num_rows, num_cols, figsize=figsize)
    axes = axes.flatten()
    for i, (ax, img) in enumerate(zip(axes, imgs)):
        try:
            img = np.array(img)
        except:
            pass
        ax.imshow(img)
        ax.axes.get_xaxis().set_visible(False)
        ax.axes.get_yaxis().set_visible(False)
        if titles:
            ax.set_title(titles[i])
    return axes

def normalize_image(image_path):
    img = Image.open(img_path) # load the image
    # 1, use ToTensor function
    transform = transforms.Compose([
        transforms.ToTensor()
    ])
    img_tensor = transform(img) # transform the pIL image to tensor
    # 2, calculate mean and std by tensor's attributes
    mean, std = img_tensor.mean([1,2]), img_tensor.std([1,2])
    # 3, use Normalize function
    transform_norm = transforms.Compose([
        transforms.ToTensor(),
        transforms.Normalize(mean, std)
    ])
    img_normalized = transform_norm(img) # get normalized image

    img_np = np.array(img) # convert PIL image to numpy array
    # print array‘s shape mean and std
    print(img_np.shape) # (height, width, channel), (768, 1024, 3)
    print("mean and std before normalize:")
    print("Mean of the image:", mean)
    print("Std of the image:", std)
    return img_np, img_tensor, img_normalized

def convert_tensor_np(tensor):
    img_arr = np.array(tensor)
    img_tr = img_arr.transpose(1, 2, 0)
    return img_tr

if __name__ == '__main__':
    img_path = 'Koalainputimage.jpeg'
    img_np, img_tensor, img_normalized = normalize_image(img_path)
    # transpose tensor to numpy array and shape of (3,,) to shape of (,,3)
    img_normalized1 = convert_tensor_np(img_tensor)
    img_normalized2 = convert_tensor_np(img_normalized)
    show_images([img_np, img_normalized1, img_normalized2], 1, 3, titles=["orignal","min-max normalization", "zero-mean normalization"])
1,程式輸出和兩種 normalization 操作效果視覺化對比圖如下所示:

2,原圖和兩種 normalization 操作後的影象畫素值正太分佈視覺化對比圖如下所示:

畫素值分佈視覺化用的程式碼如下。
# plot the pixel values
plt.hist(img_np.ravel(), bins=50, density=True)
plt.xlabel("pixel values")
plt.ylabel("relative frequency")
plt.title("distribution of pixels")
參考資料
版權宣告 ©
本文作者:嵌入式視覺
本文連結:https://www.cnblogs.com/armcvai/p/17110367.html
版權宣告:本文為「嵌入式視覺」的原創文章,首發於 github ,遵循 CC BY-NC-ND 4.0 版權協定,著作權歸作者所有,轉載請註明出處!
鼓勵博主:如果您覺得文章對您有所幫助,可以點選文章右下角【推薦】一下。您的鼓勵就是博主最大的動力!