基於遺傳演演算法的地圖四色原理繪圖上色的Python程式碼
本文介紹利用Python語言,實現基於遺傳演演算法(GA)的地圖四色原理著色操作。
1 任務需求
首先,我們來明確一下本文所需實現的需求。
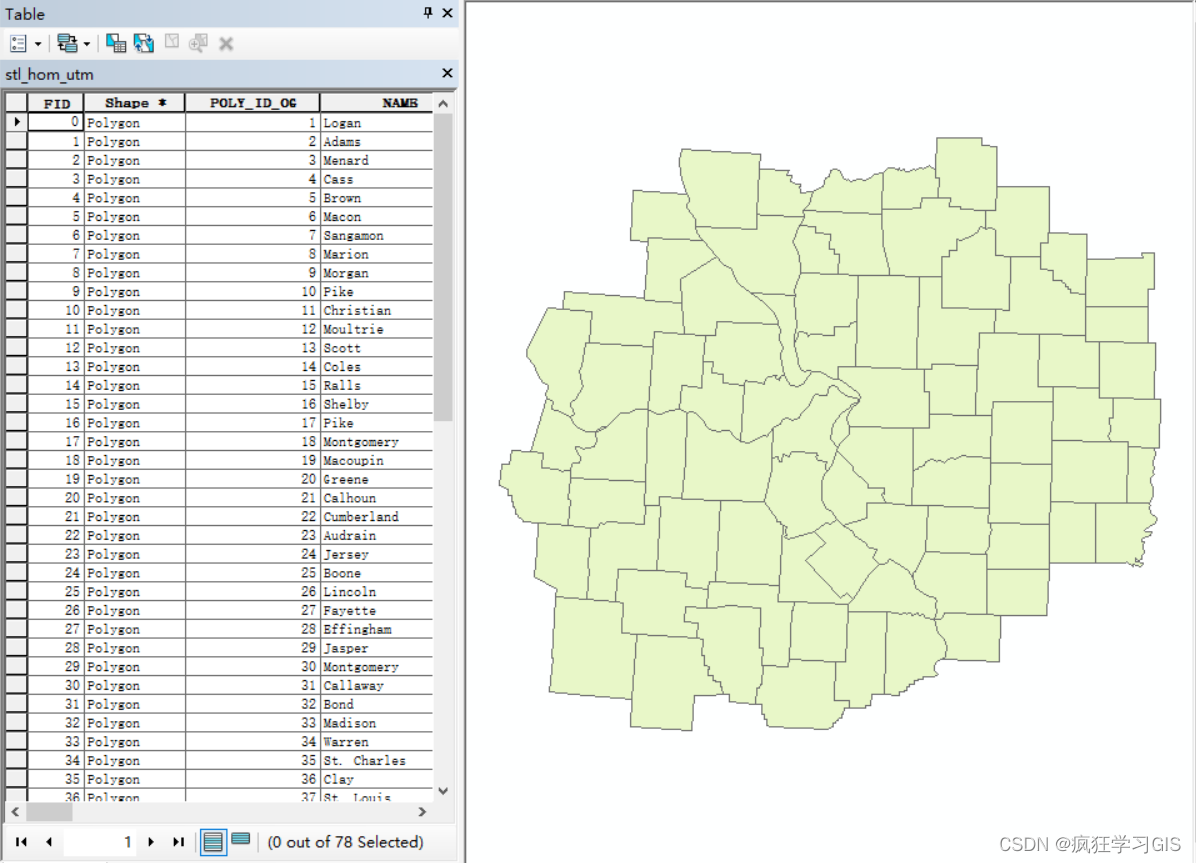
現有一個由多個小圖斑組成的向量圖層,如下圖所示。

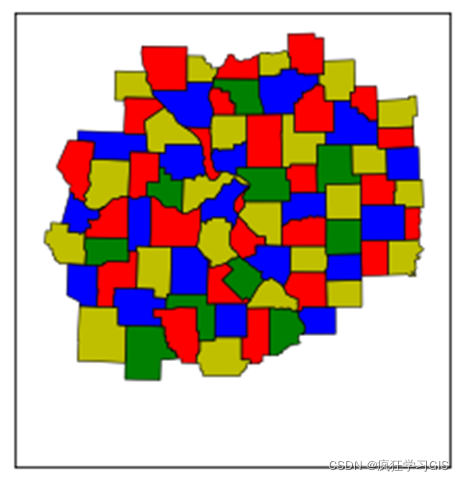
我們需要找到一種由4種顏色組成的配色方案,對該向量圖層各圖斑進行著色,使得各相鄰小圖斑間的顏色不一致,如下圖所示。

在這裡,我們用到了四色定理(Four Color Theorem),又稱四色地圖定理(Four Color Map Theorem):如果在平面上存在一些鄰接的有限區域,則至多僅用四種顏色來給這些不同的區域染色,就可以使得每兩個鄰接區域染的顏色都不一樣。
2 程式碼實現
明確了需求,我們就可以開始具體的程式碼編寫。目前國內各大部落格中,有很多關於Python實現地圖四色原理著色的程式碼,其中大多數是基於回溯法來實現的;而在一個英文部落格網頁中,看到了基於遺傳演演算法的地圖四色原理著色實現。那麼就以該程式碼為例,進行操作。在這裡,由於我本人對於遺傳演演算法的理解還並不深入,因此在程式碼介紹方面或多或少還存在著一定不足,希望大家多多批評指正。
2.1 基本思路
遺傳演演算法是一種用於解決最佳化問題的搜尋演演算法,屬於進化演演算法範疇。結合前述需求,首先可以將每一個區域的顏色作為一個基因,個體基因型則為全部地區(前述向量圖層共有78個小圖斑,即78個區域)顏色基因的彙總;通過構建Rule類,將空間意義上的「相鄰」轉換為可以被遺傳演演算法識別(即可以對個體基因改變加以約束)的資訊;隨後,結合子代的更替,找到滿足要求的基因組;最終將得到的基因組再轉換為空間意義上的顏色資訊,並輸出結果。
具體分步驟思路如下:
- 定義「規則」。「規則」用以將區域之間的空間連線情況轉換為遺傳演演算法可以識別的資訊;被「規則」連線的兩個區域在空間中是相鄰的。
- 定義區域空間連線情況檢查所需函數。這些函數用於檢查兩兩區域之間的連線性是否滿足邏輯;例如,若在「規則」中顯示區域
A與區域B連線,那麼區域B也必須在「規則」中顯示與區域A連線。 - 定義個體基因型。其中,各個體具有
78個基因,每一個基因表示一個區域的顏色。 - 個體更替與最優基因選擇。通過個體的不斷更迭,選擇出滿足「規則」要求的個體基因型。
- 基因型解釋。將得到的個體基因型進行解釋,相當於第一步的反過程,即將基因資訊轉換為空間連線情況。
- 結果檢查。檢查所得到的顏色與最優個體基因組中的各個基因是否一致。
2.2 程式碼講解
接下來,將完整程式碼進行介紹。其中,shapefile_path即為向量圖層的儲存路徑;"POLY_ID_OG"則為向量圖層的屬性表中的一個欄位,其代表每一個小圖斑的編號。
# -*- coding: utf-8 -*-
"""
Created on Sun Oct 31 19:22:33 2021

@author: Chutj
"""

import genetic
import unittest
import datetime
from libpysal.weights import Queen

shapefile_path="G:/Python_Home1/stl_hom_utm.shp"

weights=Queen.from_shapefile(shapefile_path,"POLY_ID_OG")
one_neighbor_other=weights.neighbors

# 定義「規則」,用以將區域之間的空間連線情況轉換為遺傳演演算法可以識別的資訊。被「規則」連線的兩個區域在空間中是相鄰的

class Rule:
    Item = None
    Other = None
    Stringified = None

    def __init__(self, item, other, stringified):
        self.Item = item
        self.Other = other
        self.Stringified = stringified

    def __eq__(self, another):
        return hasattr(another, 'Item') and \
               hasattr(another, 'Other') and \
               self.Item == another.Item and \
               self.Other == another.Other

    def __hash__(self):
        return hash(self.Item) * 397 ^ hash(self.Other)

    def __str__(self):
        return self.Stringified

# 定義區域空間連線情況檢查所需函數,用以確保區域兩兩之間相鄰情況的準確

def buildLookup(items):
    itemToIndex = {}
    index = 0
    for key in sorted(items):
        itemToIndex[key] = index
        index += 1
    return itemToIndex

def buildRules(items):
    itemToIndex = buildLookup(items.keys())
    rulesAdded = {}
    rules = []
    keys = sorted(list(items.keys()))

    for key in sorted(items.keys()):
        keyIndex = itemToIndex[key]
        adjacentKeys = items[key]
        for adjacentKey in adjacentKeys:
            if adjacentKey == '':
                continue
            adjacentIndex = itemToIndex[adjacentKey]
            temp = keyIndex
            if adjacentIndex < temp:
                temp, adjacentIndex = adjacentIndex, temp
            ruleKey = str(keys[temp]) + "->" + str(keys[adjacentIndex])
            rule = Rule(temp, adjacentIndex, ruleKey)
            if rule in rulesAdded:
                rulesAdded[rule] += 1
            else:
                rulesAdded[rule] = 1
                rules.append(rule)

    for k, v in rulesAdded.items():
        if v == 1:
            print("rule %s is not bidirectional" % k)

    return rules

# 定義顏色所代表的基因組

colors = ["Orange", "Yellow", "Green", "Blue"]
colorLookup = {}
for color in colors:
    colorLookup[color[0]] = color
geneset = list(colorLookup.keys())

# 定義個體基因型,其中各個體有78個基因,每一個基因代表一個區域。個體基因需要滿足「規則」中相鄰的區域具有不同的顏色

class GraphColoringTests(unittest.TestCase):
    def test(self):
        rules = buildRules(one_neighbor_other)
        colors = ["Orange", "Yellow", "Green", "Blue"]
        colorLookup = {}
        for color in colors:
            colorLookup[color[0]] = color
        geneset = list(colorLookup.keys())
        optimalValue = len(rules)
        startTime = datetime.datetime.now()
        fnDisplay = lambda candidate: display(candidate, startTime)
        fnGetFitness = lambda candidate: getFitness(candidate, rules)
        best = genetic.getBest(fnGetFitness, fnDisplay, len(one_neighbor_other), optimalValue, geneset)
        self.assertEqual(best.Fitness, optimalValue)

        keys = sorted(one_neighbor_other.keys())

        for index in range(len(one_neighbor_other)):
            print(keys[index]," is ",colorLookup[best.Genes[index]])

# 輸出各區域顏色

def display(candidate, startTime):
    timeDiff = datetime.datetime.now() - startTime
    print("%s\t%i\t%s" % (''.join(map(str, candidate.Genes)), candidate.Fitness, str(timeDiff)))

# 檢查各區域顏色是否與個體基因所代表的顏色一致

def getFitness(candidate, rules):
    rulesThatPass = 0
    for rule in rules:
        if candidate[rule.Item] != candidate[rule.Other]:
            rulesThatPass += 1

    return rulesThatPass

# 執行程式

GraphColoringTests().test()
2.3 結果展示
執行上述程式碼,即可得到結果。在這裡值得一提的是:這個程式碼不知道是其自身原因,還是我電腦的問題,執行起來非常慢——單次執行時間可能在5 ~ 6個小時左右,實在太慢了;大家如果感興趣,可以嘗試著能不能將程式碼的效率提升一下。
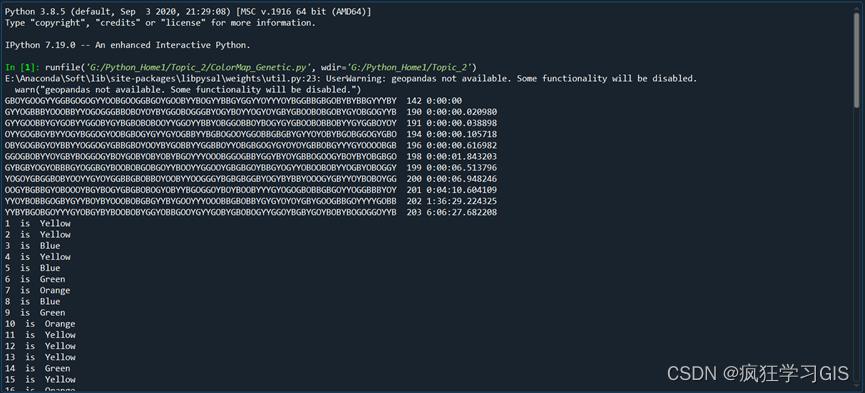
程式碼執行完畢後得到的結果是文字形式的,具體如下圖所示。

可以看到,通過203次迭代,找到了滿足要求的地圖配色方案,用時06小時06分鐘;程式碼執行結果除顯示出具體個體的整體基因型之外,還將分別顯示78個小區域(小圖斑)各自的具體顏色名稱(我上面那幅圖沒有截全,實際上是78個小區域的顏色都會輸出的)。
當然,大家也可以發現,這種文字表達的程式碼執行結果顯然不如直接來一幅如下所示的結果圖直觀。但是,由於程式碼單次執行時間實在是太久了,我也沒再騰出時間(其實是偷懶)對結果的視覺化加以修改。大家如果感興趣的話,可以嘗試對程式碼最終的結果呈現部分加以修改——例如,可以通過Matplotlib庫的拓展——Basemap庫將78個小區域的配色方案進行視覺化。

至此,大功告成。