視覺化—AntV G6 高亮相鄰節點的兩種方式
2022-12-28 21:03:05
通過官方檔案,可知高亮相鄰節點分為兩種方法,檔案描述並不是很清楚,對剛接觸這個庫的小白並不是很友好,慢慢總結慢慢來吧
內建的高亮節點
是通過內建的Behavior activate-relations來實現,Behavior 是 G6 提供的定義圖上互動事件的機制。與互動模式 Mode配合使用
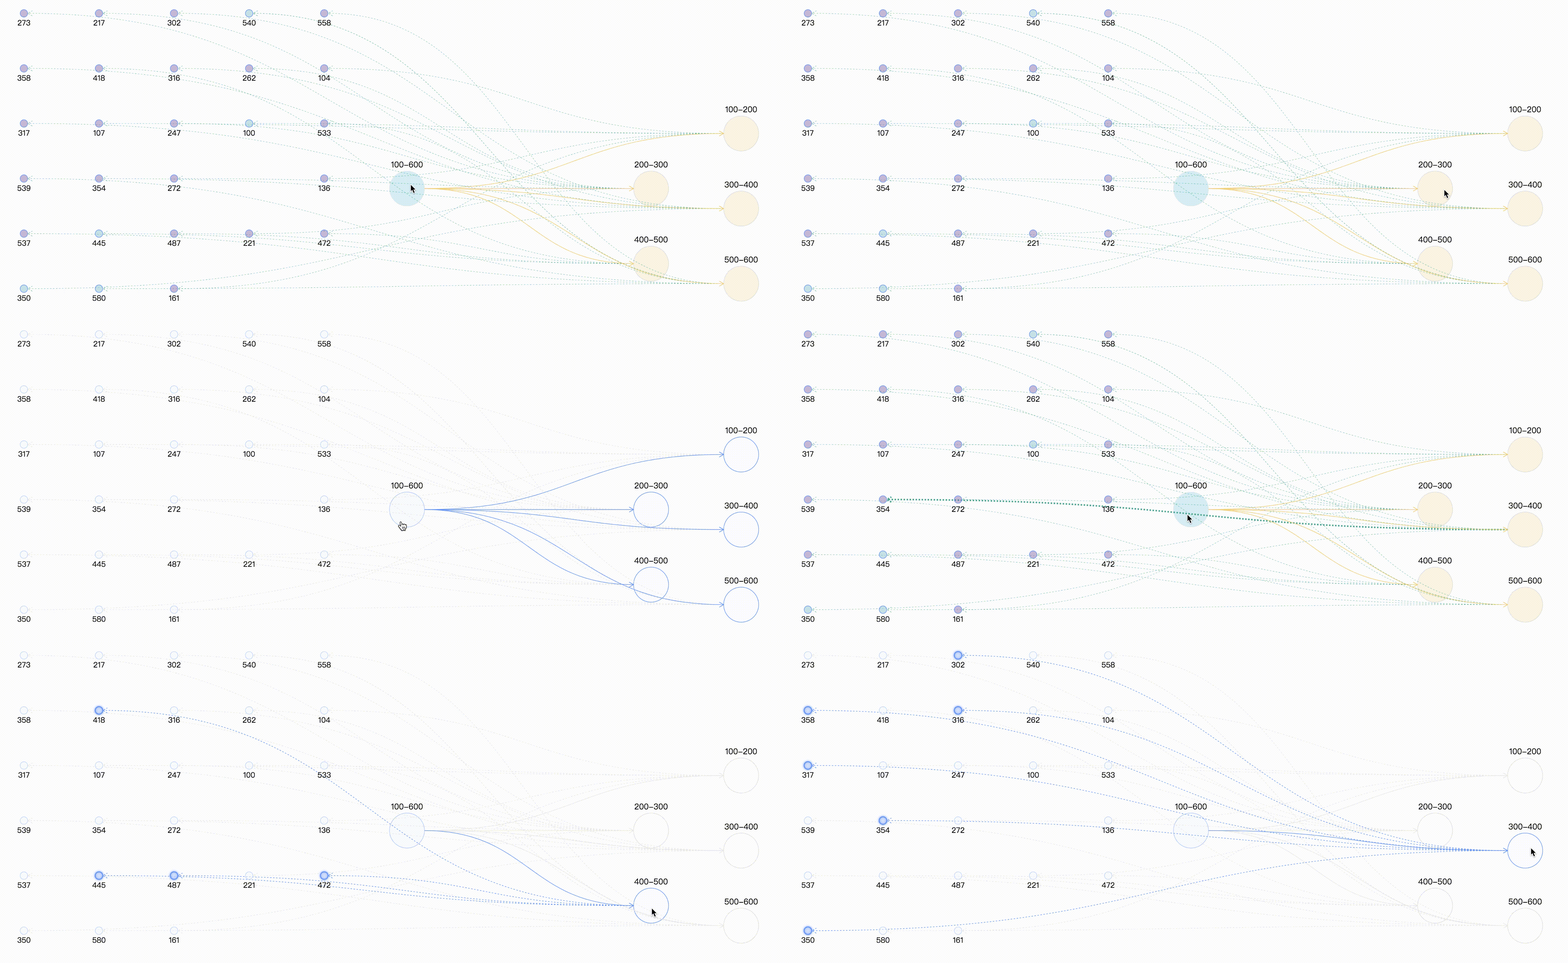
activate-relations:當滑鼠移到某節點時,突出顯示該節點以及與其直接關聯的節點和連線;
- 引數:
trigger: 'mouseenter'。表示出發機制,可以是mouseenter、click;activeState: 'active'。活躍節點狀態,預設為active,可以與 graph 範例的xxxStateStyles結合實現豐富的視覺效果。inactiveState: 'inactive'。非活躍節點狀態,預設值為inactive。同樣可以與 graph 範例的xxxStateStyles結合實現豐富的視覺效果。- 檔案上還提到了另外兩個引數,但是本案例中並未使用,暫不做說明 resetSelected、shouldUpdate(e)
- 具體用法
let drawGraph = document.getElementById("drawGraph");
this.graphWidth = drawGraph.scrollWidth;
this.graphHeight = drawGraph.scrollHeight || 1200;

graphG = new this.G6.Graph({
  container: "drawGraph",
  width: this.graphWidth,
  height: this.graphHeight,
  modes: {
    default: [
      { type: "activate-relations", activeState: 'active', inactiveState: 'inactive' },
    ],
    // default: ['activate-relations']  // 由於活躍節點及非活躍節點狀態均採用預設值,因此可以簡寫為這種形式
  },
  nodeStateStyles:{},    // 設定節點狀態樣式
  edgeStateStyles:{},    // 設定邊狀態樣式
  comboStateStyles:{},   // 設定分組狀態樣式
}
graphG.data(data);
graphG.render();
如果僅採用內建的高亮節點,會採用預設的樣式,最終的渲染效果為:

自定義高亮
這種方式是通過自定義狀態,在通過範例提供的setItemState、 clearItemStates設定和清除目標的狀態資訊,同樣需要與graph 範例的 xxxStateStyles 結合實現。
graphG = new this.G6.Graph({
  container: "drawGraph",
  width: this.graphWidth,
  height: this.graphHeight,
  nodeStateStyles:{  // 設定節點狀態樣式,此處就先寫一個,後續會有完整的案例分享
    highlight: {
        fill: "#db4437",
        shadowColor: '#fff',
        stroke: "#db4437",
        cursor: "pointer",
        'text-shape': {
          lineWidth: 1,
          fill: "#db4437",
          stroke: "#db4437",
        },
      },
  },
  edgeStateStyles:{},    // 設定邊狀態樣式
  comboStateStyles:{},   // 設定分組狀態樣式
}
graphG.data(data);
graphG.render();
graphG.on("combo:mouseenter", (e) => {
  let edgeItem = e.item
  graphG.setItemState(edgeItem, 'highlight', true)
  edgeItem.getEdges().forEach(edge => {
    graphG.setItemState(edge.getTarget(), 'highlight', true)
    graphG.setItemState(edge.getSource(), 'highlight', true)
    graphG.setItemState(edge, 'highlight', true)
  })
  graphG.paint()
  graphG.setAutoPaint(true)
});

graphG.on('combo:mouseleave', (e) => {
  graphG.setAutoPaint(false)
  graphG.getNodes().forEach(node => {
    graphG.clearItemStates(node)
  })
  graphG.getEdges().forEach(edge => {
    graphG.clearItemStates(edge)
  })
  graphG.getCombos().forEach(combo => {
    graphG.clearItemStates(combo)
  })
  graphG.paint()
  graphG.setAutoPaint(true)
})
如果僅採用自定義高亮節點,最終的渲染效果為:

自定義高亮時保持原始顏色
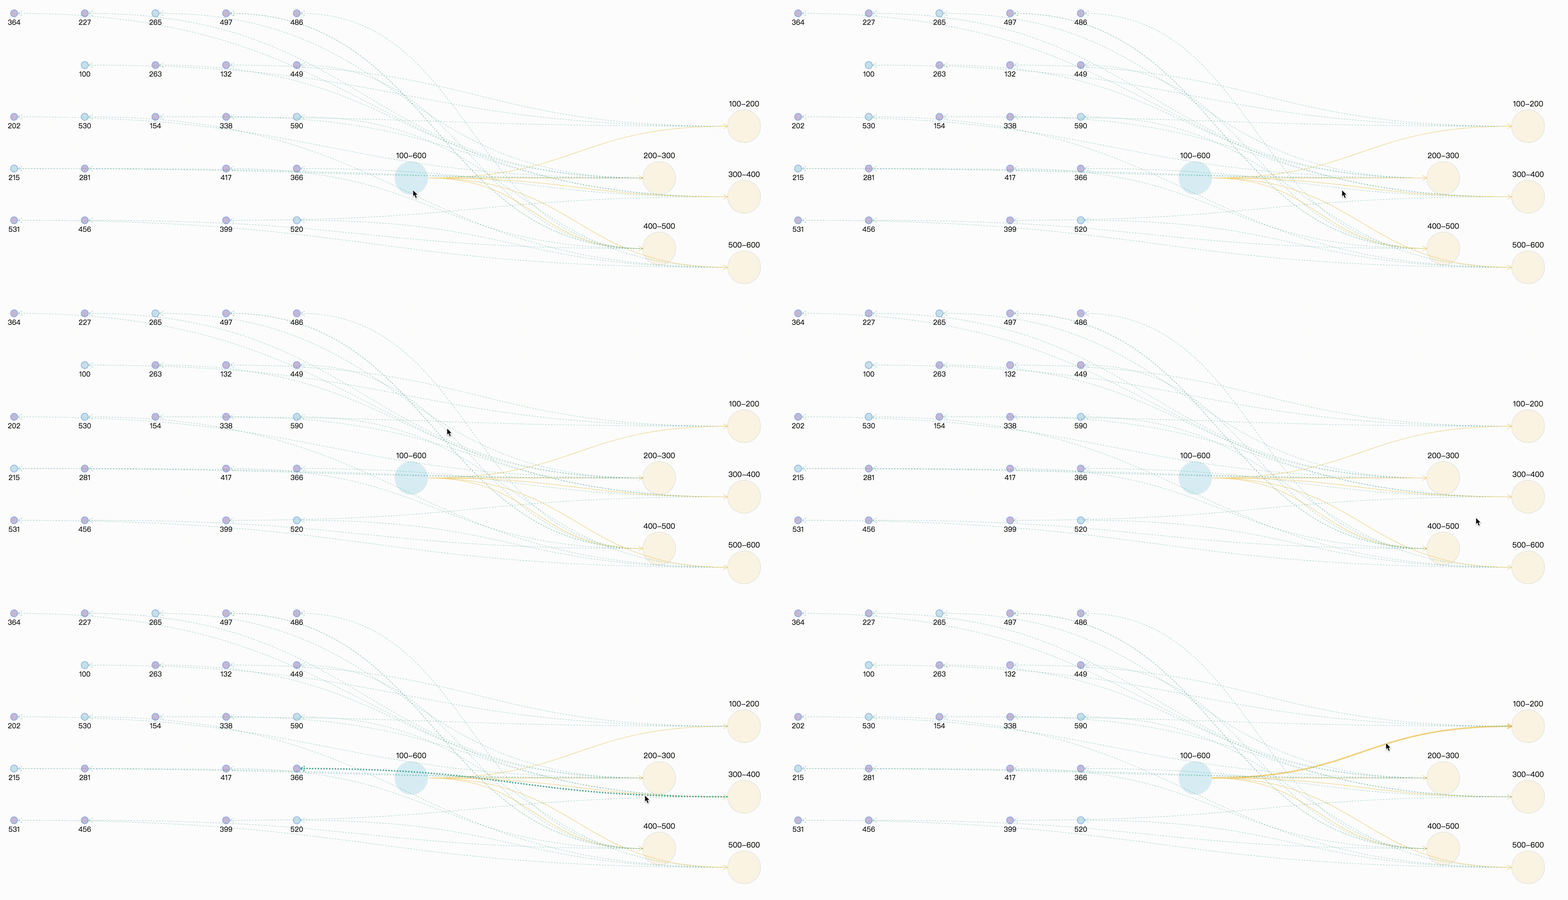
通過上面的案例,可以看出,combo:mouseenter時相關聯的邊和點全部高亮,並且統一了連線的顏色,此時可能會與我們的需求相違背,可能連線還是想要保持原來的顏色,因為不同的顏色描述兩點之間的不同型別的指向關係。那麼此時在處理滑鼠事件時,需要獲取要節點和連線 原始樣式。
graphG.on("combo:mouseenter", (e) => {
        let comboItem = e.item;
        const originStyle = comboItem._cfg.originStyle["circle-combo"].fill;
        comboItem._cfg.styles.highlight.fill = originStyle;
        graphG.setItemState(comboItem, "highlight", true);
        comboItem.getEdges().forEach((edge) => {
          const originStyle = edge._cfg.originStyle["edge-shape"].stroke; // 獲取邊edge 原始顏色
          edge._cfg.styles.highlight.stroke = originStyle;
          let edgeSource = edge.getSource();
          let edgeTarget = edge.getTarget();

          if ( edgeSource._cfg.type === "combo" && edgeSource._cfg.model.id =="100-600" ) {
            const originStyle = edgeSource._cfg.originStyle["circle-combo"].fill; // 獲取分組combo 原始顏色
            edgeSource._cfg.styles.highlight.fill = originStyle;
          }
          if ( edgeTarget._cfg.type === "combo" && edgeTarget._cfg.model.id =="100-600" ) {
            const originStyle = edgeTarget._cfg.originStyle["circle-combo"].fill;
            edgeTarget._cfg.styles.highlight.fill = originStyle;
          }
          graphG.setItemState(edgeSource, "highlight", true);
          graphG.setItemState(edgeTarget, "highlight", true);
          graphG.setItemState(edge, "highlight", true);
        });
      });
那麼此時最終的效果為:

總結
其實兩種方法與異曲同工之妙,都是進行狀態的處理,只不過一個是幫我們處理了一部分狀態與樣式,可以直接拿來用,但往往內建的樣式與我們實際使用時不相符,因此可以使用兩者結合的方式,最終效果及完整demo,採用亂數來模擬實體與關係。
案例完整程式碼
<template>
  <div>
    <div id="drawGraph"></div>
  </div>
</template>

<script>
let graphG = null
export default {
  mounted() {
    this.initData();
  },
  methods: {
    initData() {
      let combos = [
        { id: '100-600', label: '100-600' },
        { id: '100-200', label: '100-200' },
        { id: '200-300', label: '200-300' },
        { id: '300-400', label: '300-400' },
        { id: '400-500', label: '400-500' },
        { id: '500-600', label: '500-600' },
      ]
      let edges = [
        { source: '100-600', target: '100-200' },
        { source: '100-600', target: '200-300' },
        { source: '100-600', target: '300-400' },
        { source: '100-600', target: '400-500' },
        { source: '100-600', target: '500-600' },
      ]
      // 生成(20-30)亂數 模擬節點node
      let randomCount = Math.floor(Math.random() * 10) + 20;
      let row_clo = Math.floor(Math.sqrt(randomCount));
      let origin = [-150, 50], row = 110, clo = 150;
      let nodes = []
      for (let i = 0; i < randomCount; i++) {
        let randomNum = String(Math.floor(Math.random() * 500) + 100);    // 生成100-600之間的亂數,並與combo進行連線
        let rowindex = Math.floor(i / row_clo);
        let cloindex = i % row_clo;
        let x = origin[0] + clo * cloindex
        let y = origin[1] + row * rowindex
        let node = {
          label: randomNum,
          id: randomNum,
          x,
          y,
          style: {
            fillOpacity: 0.5,
            cursor: "pointer",
            fill: randomNum % 5 == 0 ? "#81C7D4" : "#986DB2"
          }
        }
        let index = Math.floor(randomNum / 100)
        let edge = {
          source: combos[index].id,
          target: randomNum,
          lineWidth: 1,
          style: {
            lineDash: [3, 3],
            lineWidth: 0.5,
            stroke: "#00AA90"
          }
        }
        nodes.push(node)
        edges.push(edge)
      }
      let data = { combos, edges, nodes }
      console.log(data);
      this.makeRelationData(data);
    },
    // 分組 點 連線處理
    makeRelationData(data) {
      if (graphG) {
        graphG.destroy();
      }
      let drawGraph = document.getElementById("drawGraph");
      this.graphWidth = drawGraph.scrollWidth;
      this.graphHeight = drawGraph.scrollHeight || 1200;
      let origin = [this.graphWidth / 2, 100];
      let row = 150, clo = 180;
      let combos = data.combos
      let row_clo = Math.floor(Math.sqrt(combos.length));
      for (let i = 0; i < combos.length; i++) {
        let rowindex = Math.floor(i / row_clo) + 1;
        let cloindex = (i % row_clo) + 1;
        // 分組預設樣式設定
        if (i === 0) {
          combos[i].x = this.graphWidth / 3
          combos[i].y = this.graphHeight / 3
          combos[i].style = {
            fill: "#a5e4f0",
            opacity: 0.5,
            cursor: "pointer",
          };
        } else {
          // 分組定位
          combos[i].x = origin[0] + clo * cloindex;
          combos[i].y = origin[1] + row * rowindex;
          if (i % 2 === 1) {
            combos[i].y += 40;
          }
          combos[i].style = {
            fill: "#f6cd6b",
            fillOpacity: 0.2,
          }
        }
      }
      this.drawQfast(data)
    },
    drawQfast(data) {
      graphG = new this.G6.Graph({
        container: "drawGraph",
        width: this.graphWidth,
        height: this.graphHeight,
        modes: {
          default: [
            { type: "zoom-canvas", enableOptimize: true, optimizeZoom: 0.2 },
            { type: "drag-canvas", enableOptimize: true },
            { type: "drag-node", enableOptimize: true, onlyChangeComboSize: true },
            { type: "drag-combo", enableOptimize: true, onlyChangeComboSize: true },
            { type: "activate-relations", activeState: 'active', inactiveState: 'inactive' },
          ],
        },
        defaultEdge: {
          type: 'cubic-horizontal',
          lineWidth: 1,
          style: {
            endArrow: true,
            stroke: "#FAD069",
          },
        },
       defaultNode: {
          type: "circle",
          size: 15,
          labelCfg: {
            position: "bottom",
            style: {
              fontSize: 15,
            },
          },
        },
        defaultCombo: {
          cursor: "pointer",
          opacity: 0,
          type: "circle",
          lineWidth: 1,
          collapsed: true,
          labelCfg: {
            position: "top",
            refY: 5,
            style: {
              fontSize: 16,
            },
          },
        },
        nodeStateStyles: {
          highlight: {
            fill: "#db4437",
            shadowColor: '#fff',
            stroke: "#db4437",
            cursor: "pointer",
            'text-shape': {
              lineWidth: 1,
              fill: "#db4437",
              stroke: "#db4437",
            },
          },
          inactive: {
            stroke: '#eee',
            lineWidth: 1,
            'text-shape': {
              fill: "#eee",
              stroke: "#eee",
            },
          },
        },
        edgeStateStyles: {
          hover: {
            lineWidth: 3,
          },
          highlight: {
            stroke: '#00AA90',
            lineWidth: 3,
          },
        },
        comboStateStyles: {
          highlight: {
            fill: "#f6cd6b",
            opacity: 0.7,
            cursor: "pointer",
            'text-shape': {
              fill: "#A5E4F0",
              stroke: "#A5E4F0",
              lineWidth: 1,
            },
          },
          inactive: {
            stroke: '#eee',
            lineWidth: 1,
            'text-shape': {
              fill: "#eee",
              stroke: "#eee",
            },
          },
        },
      });
      graphG.data(data);
      graphG.render(); // 渲染圖

      graphG.on("edge:mouseenter", (e) => {
        graphG.setItemState(e.item, "hover", true);
      });

      graphG.on("edge:mouseleave", (e) => {
        graphG.setItemState(e.item, "hover", false);
      });
       graphG.on("combo:mouseenter", (e) => {
        let comboItem = e.item;
        const originStyle = comboItem._cfg.originStyle["circle-combo"].fill;
        comboItem._cfg.styles.highlight.fill = originStyle;
        graphG.setItemState(comboItem, "highlight", true);
        comboItem.getEdges().forEach((edge) => {
          const originStyle = edge._cfg.originStyle["edge-shape"].stroke; // 獲取邊edge 原始顏色
          edge._cfg.styles.highlight.stroke = originStyle;
          let edgeSource = edge.getSource();
          let edgeTarget = edge.getTarget();

          if ( edgeSource._cfg.type === "combo" && edgeSource._cfg.model.id =="100-600" ) {
            const originStyle = edgeSource._cfg.originStyle["circle-combo"].fill; // 獲取分組combo 原始顏色
            edgeSource._cfg.styles.highlight.fill = originStyle;
          }
          if ( edgeTarget._cfg.type === "combo" && edgeTarget._cfg.model.id =="100-600" ) {
            const originStyle = edgeTarget._cfg.originStyle["circle-combo"].fill;
            edgeTarget._cfg.styles.highlight.fill = originStyle;
          }
          graphG.setItemState(edgeSource, "highlight", true);
          graphG.setItemState(edgeTarget, "highlight", true);
          graphG.setItemState(edge, "highlight", true);
        });
      });


      graphG.on('combo:mouseleave', () => {
        graphG.setAutoPaint(false)
        graphG.getNodes().forEach(node => {
          graphG.clearItemStates(node)
        })
        graphG.getEdges().forEach(edge => {
          graphG.clearItemStates(edge)
        })
        graphG.getCombos().forEach(combo => {
          graphG.clearItemStates(combo)
        })
        graphG.paint()
        graphG.setAutoPaint(true)
      })

    },
  }
};
</script>