Flask 框架:運用Echarts繪製圖形
2022-10-05 21:00:36
echarts是百度推出的一款開源的基於JavaScript的視覺化圖表庫,該開發庫目前發展非常不錯,且支援各類圖形的繪製可客製化程度高,Echarts繪相簿同樣可以與Flask結合,前臺使用echart繪相簿進行圖形的生成與展示,後臺則是Flask通過render_template方法返回一串JSON資料集,前臺收到後將其應用到繪相簿上,實現動態展示Web服務紀錄檔狀態功能。
如下演示案例中,將分別展示運用該繪相簿如何前後端互動繪製(餅狀圖,柱狀圖,折線圖)這三種最基本的圖形。
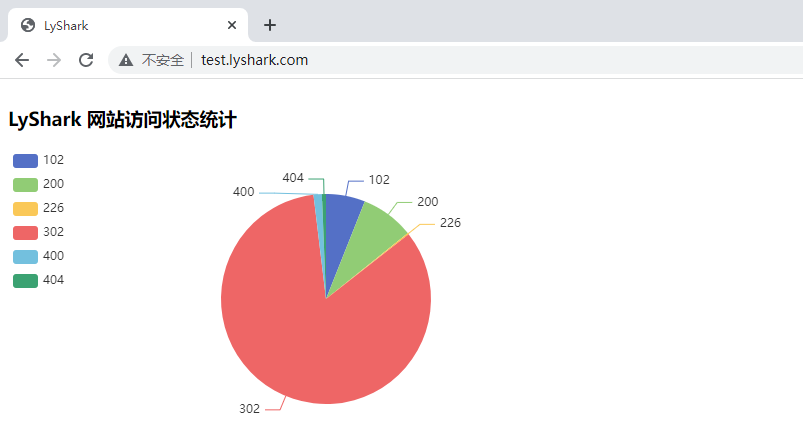
實現繪製餅狀圖: 用於模擬統計Web容器的紀錄檔資料,通過餅狀圖將存取狀態統計出來。
前端部分/templates/index.html程式碼如下:
<html>
	<head>
		<meta charset="UTF-8">
		<title>LyShark</title>
		<script src="https://cdn.lyshark.com/javascript/jquery/3.5.1/jquery.min.js"></script>
		<script src="https://cdn.lyshark.com/javascript/echarts/5.0.0/echarts.min.js"></script>
	</head>

	<body>
		<div class="panel panel-primary" style="width: 40%;height: 30%; float: left">
		<div class="panel-heading">
			<h3 class="panel-title">LyShark 網站存取狀態統計</h3>
		</div>
		<div class="panel-body">
			<div id="main" style="width:100%; height: 300px"></div>
		</div>
		</div>
	</body>

	<script type="text/javascript" charset="UTF-8">
		var kv = new Array();
		kv = {{ data | safe }}
		var test = new Array();
		for(var logkey in kv){
			test.push( {value:kv[logkey], name:logkey} )
		}
		var display = function(){
			var main = echarts.init(document.getElementById("main"));
			var option = {
				legend: {
					orient: 'vertical',
					left: 'left',
				},
				series: [
					{
						type: 'pie',
						radius: '70%',
						center: ['50%', '50%'],
						detail: {formatter:'{value}'},
						data: test
					}
				]
			};
			main.setOption(option,true);
		};
		display();
	</script>
</html>
後端程式碼如下通過模擬render_template返回一些資料。
from flask import Flask,render_template,request
import json

app = Flask(import_name=__name__,
            static_url_path='/python',   # 設定靜態檔案的存取url字首
            static_folder='static',      # 設定靜態檔案的資料夾
            template_folder='templates') # 設定模板檔案的資料夾

def Count_Flag_And_Flow(file):
    list = []
    flag = {}
    with open(file) as f:
        contexts = f.readlines()
    for line in contexts:
        it = line.split()[8]
        list.append(it)
    list_num = set(list)
    for item in list_num:
        num = list.count(item)
        flag[item] = num
    return flag

@app.route('/', methods=["GET"])
def index():
    Address = {'226': 4, '404': 12, '200': 159, '400': 25, '102': 117, '302': 1625}
    # Address = Count_Flag_And_Flow("d://access_log")
    return render_template("index.html",data = json.dumps(Address))

if __name__ == '__main__':
    app.run(host="127.0.0.1", port=80, debug=False)
執行後存取自定義域名,輸出如下效果的餅狀圖:

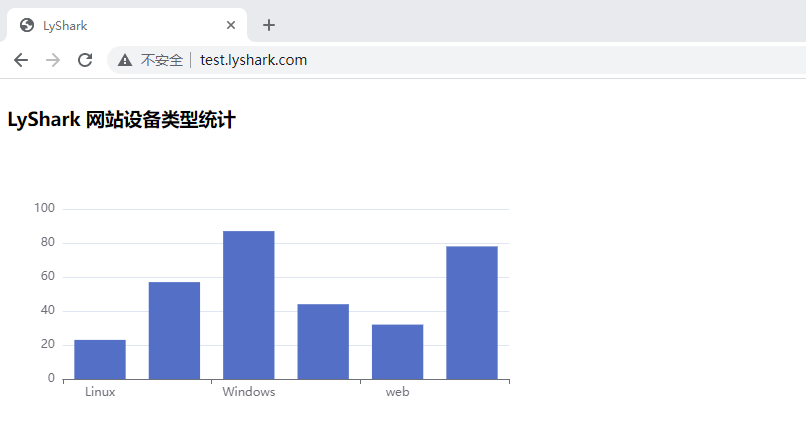
實現繪製柱狀圖: 統計存取了本站的所有ID地址並將地址數大於2的全部顯示出來.
前端index.html程式碼如下
<html>
	<head>
		<meta charset="UTF-8">
		<title>LyShark</title>
		<script src="https://cdn.lyshark.com/javascript/jquery/3.5.1/jquery.min.js"></script>
		<script src="https://cdn.lyshark.com/javascript/echarts/5.0.0/echarts.min.js"></script>
	</head>

	<body>
		<div class="panel panel-primary" style="width: 58%;height: 30%; float: left">
			<div class="panel-heading">
				<h3 class="panel-title">LyShark 網站裝置型別統計</h3>
			</div>
			<div class="panel-body">
				<div id="main1" style="width:100%; height: 300px"></div>
			</div>
		</div>
	</body>

	<script type="text/javascript" charset="UTF-8">
			var kv = new Array();
			var keys = new Array();
			var values = new Array();
			kv = {{ data | safe }}

			for(var logkey in kv){
				keys.push(logkey);
				values.push(kv[logkey]);
			}
			var display = function() {
				var main1 = echarts.init(document.getElementById("main1"));
				var option = {
					xAxis: {
						type: 'category',
						data: keys
					},
					yAxis: {
						type: 'value'
					},
					series: [{
						data: values,
						type: 'bar'
					}]
				};
				main1.setOption(option,true);
			};
		display();
	</script>
</html>
後端程式碼如下,路由曾則只保留一個index對映
from flask import Flask,render_template,request
import json

app = Flask(import_name=__name__,
            static_url_path='/python',   # 設定靜態檔案的存取url字首
            static_folder='static',      # 設定靜態檔案的資料夾
            template_folder='templates') # 設定模板檔案的資料夾

def Count_Flag_And_Type(file):
    list = []
    flag = {}
    with open(file) as f:
        contexts = f.readlines()
    for line in contexts:
        addr = line.split()[0].replace("(","").replace(")","")
        if addr != "::1":
            list.append(addr)

    # 去重並將其轉為字典
    list_num = set(list)
    for item in list_num:
        num = list.count(item)
        # 如果地址只有一次則忽略
        if num > 1:
            flag[item] = num
    return flag

@app.route('/', methods=["GET"])
def index():
    Types = {'Linux': 23, 'studies': 57, 'Windows': 87, 'compatible': 44, 'web': 32, 'X11': 78}
    # Types = Count_Flag_And_Type("d://access_log")
    return render_template("index.html",data = json.dumps(Types))

if __name__ == '__main__':
    app.run(host="127.0.0.1", port=80, debug=False)
柱狀圖繪製效果如下:

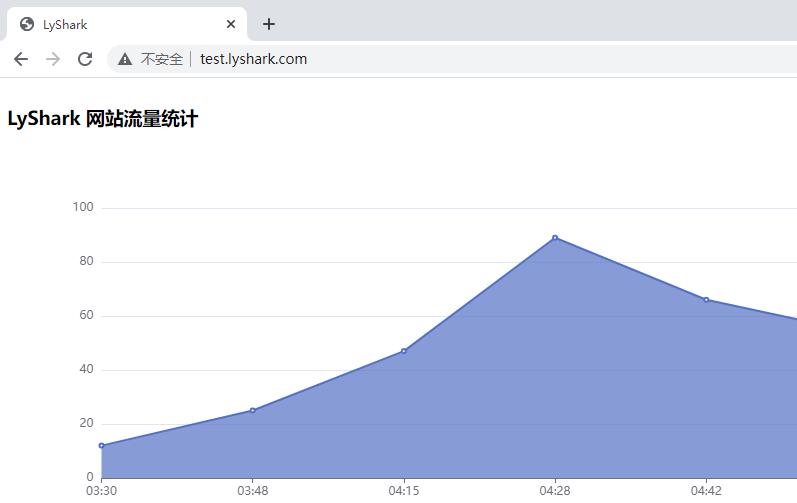
實現繪製折線圖: 統計指定的時間段內的存取流量資料.
前端index.html程式碼如下
<html>
	<head>
		<meta charset="UTF-8">
		<title>LyShark</title>
		<script src="https://cdn.lyshark.com/javascript/jquery/3.5.1/jquery.min.js"></script>
		<script src="https://cdn.lyshark.com/javascript/echarts/5.0.0/echarts.min.js"></script>
	</head>

	<body>
		<div class="panel panel-primary" style="width: 100%;height: 30%; float: left">
			<div class="panel-heading">
				<h3 class="panel-title">LyShark 網站流量統計</h3>
			</div>
			<div class="panel-body">
				<div id="main" style="width:100%; height: 400px"></div>
			</div>
		</div>
	</body>

	<script type="text/javascript" charset="UTF-8">
			var kv = new Array();
			var keys = new Array();
			var values = new Array();
			kv = {{ data | safe }};
			for(var logkey in kv){
				keys.push(logkey);
				values.push(kv[logkey]);
			}

			var display = function() {
				var main = echarts.init(document.getElementById("main"));
				var option = {
					xAxis: {
						type: 'category',
						boundaryGap: false,
						data: keys
					},
					yAxis: {
						type: 'value'
					},
					series: [{
						data: values,
						type: 'line',
						areaStyle: {},
					}]
				};
				main.setOption(option,true);
			};
		display();
	</script>
</html>
後端程式碼如下,路由曾則只保留一個index對映
from flask import Flask,render_template,request
import json

app = Flask(import_name=__name__,
            static_url_path='/python',   # 設定靜態檔案的存取url字首
            static_folder='static',      # 設定靜態檔案的資料夾
            template_folder='templates') # 設定模板檔案的資料夾

def Count_Time_And_Flow(file):
    times = {}  # key 儲存當前時間資訊
    flow = {}   # value 當前時間流量總和
    Count= 0    # 針對IP地址的計數器
    with open(file) as f:
        contexts = f.readlines()
    for line in contexts:
        if line.split()[9] != "-" and line.split()[9] != '"-"':
            size = line.split()[9]
        temp = line.split()[3]
        ip_attr = temp.split(":")[1] + ":" + temp.split(":")[2]
        Count = int(size) + Count
        if ip_attr in times.keys():
            flow[ip_attr] = flow[ip_attr] + int(size)
        else:
            times[ip_attr] = 1
            flow[ip_attr] = int(size)
    return flow

@app.route('/', methods=["GET"])
def index():
    OutFlow = {'03:30': 12, '03:48': 25, '04:15': 47, '04:28': 89, '04:42': 66, '04:51': 54}
    # OutFlow = Count_Time_And_Flow("d://access_log")
    return render_template("index.html",data = json.dumps(OutFlow))

if __name__ == '__main__':
    app.run(host="127.0.0.1", port=80, debug=False)
折現圖繪製效果如下:

如上是三種常用圖形的繪製方式,其他圖形同理可以參考如上方程式碼中的寫法,我們可以將這三個圖形合併在一起,主要是前端對其進行排版即可。
<!DOCTYPE html>
<html lang="en">
<head>
    <meta charset="UTF-8">
    <link rel="stylesheet" href="https://cdn.lyshark.com/javascript/bootstrap/3.3.7/css/bootstrap.min.css">
    <script type="text/javascript" src="https://cdn.lyshark.com/javascript/jquery/3.5.1/jquery.min.js"></script>
    <script type="text/javascript" src="https://cdn.lyshark.com/javascript/echarts/5.0.0/echarts.min.js"></script>
</head>
<body>

    <!--餅狀圖繪製方法-->
    <div class="panel panel-primary" style="width: 40%;height: 30%;float: left">
        <div class="panel-heading">
            <h3 class="panel-title">餅狀圖繪製</h3>
        </div>
        <div class="panel-body">
            <div id="PieChart" style="width:100%; height: 300px"></div>
        </div>
    </div>

    <!--柱狀圖繪製方法-->
    <div class="panel panel-primary" style="width: 58%;height: 30%; float: right">
        <div class="panel-heading">
            <h3 class="panel-title">柱狀圖繪製</h3>
        </div>
        <div class="panel-body">
            <div id="HistogramChart" style="width:100%; height: 300px"></div>
        </div>
    </div>

    <!--折線圖繪製方法-->
    <div class="panel panel-primary" style="width: 100%;height: 40%; float: left">
        <div class="panel-heading">
            <h3 class="panel-title">折線圖繪製</h3>
        </div>
        <div class="panel-body">
            <div id="Linechart" style="width:100%; height: 460px"></div>
        </div>
    </div>

    <!--餅狀圖繪製方法-->
    <script type="text/javascript" charset="UTF-8">
        var kv = new Array();
        kv = {{ Address | safe }}
        var test = new Array();
        for(var logkey in kv){
            test.push( {value:kv[logkey], name:logkey} )
        }
        var display = function(){
            var echo = echarts.init(document.getElementById("PieChart"));
            var option = {
                legend: {
                    orient: 'vertical',
                    left: 'left',
                },
                series: [
                    {
                        type: 'pie',
                        radius: '70%',
                        center: ['50%', '50%'],
                        detail: {formatter:'{value}'},
                        data: test
                    }
                ]
            };
            echo.setOption(option,true);
        };
        display();
    </script>

    <!--柱狀圖繪製方法-->
    <script type="text/javascript" charset="UTF-8">
        var kv = new Array();
        var keys = new Array();
        var values = new Array();
        kv = {{ Types | safe }}

        for(var logkey in kv){
            keys.push(logkey);
            values.push(kv[logkey]);
        }
        var display = function() {
            var echo = echarts.init(document.getElementById("HistogramChart"));
            var option = {
                tooltip: {
                    trigger: 'axis',
                    axisPointer: {
                      type: 'shadow'
                    }
                },
                grid: {
                    left: '3%',
                    right: '4%',
                    bottom: '3%',
                    containLabel: true
                },
                xAxis: {
                    type: 'category',
                    data: keys
                },
                yAxis: {
                    type: 'value'
                },
                series: [{
                    data: values,
                    type: 'bar'
                }]
            };
            echo.setOption(option,true);
        };
        display();
    </script>

    <!--折線圖繪製方法-->
    <script type="text/javascript" charset="UTF-8">

        // 函數主要用於將傳入的字典分解成key,value格式並返回
        var get_key_value = function(kv)
        {
            var keys = new Array();
            var values = new Array();

            for(var logkey in kv)
            {
                keys.push(logkey);
                values.push(kv[logkey]);
            }
            return [keys,values];
        }

        // 輸出1分鐘負載
        var kv = new Array();
        kv = {{ x | safe }};
        var x = get_key_value(kv);

        // 輸出5分鐘負載
        var kv = new Array();
        kv = {{ y | safe }};
        var y = get_key_value(kv);

        // 輸出15分鐘負載
        var kv = new Array();
        kv = {{ z | safe }};
        var z = get_key_value(kv);

        // 顯示利用率
        var display = function() {
            var echo = echarts.init(document.getElementById("Linechart"));
            var option = {
                title: {
                    left: 'left',
                    text: 'CPU 利用表',
                },
                // 調節大小
                grid: {
                    left: '3%',
                    right: '4%',
                    bottom: '3%',
                    containLabel: true
                },
                // tooltip 滑鼠放上去之後會自動出現座標
                tooltip: {
                    trigger: 'axis',
                    axisPointer: {
                        type: 'cross',
                        label: {
                            backgroundColor: '#6a7985'
                        }
                    }
                },
            legend: {
                data: ['1分鐘負載', '5分鐘負載', '15分鐘負載']
            },

            xAxis: {
                type: 'category',
                // data: ['Mon', 'Tue', 'Wed', 'Thu', 'Fri', 'Sat', 'Sun']
                data: x[0]
            },
            yAxis: {
                type: 'value'
            },
            series:
            [
                {
                    name: "1分鐘負載",
                    stack: "總量",
                    //data: [10, 25, 99, 87, 54, 66, 2],
                    data: x[1],
                    type: 'line'
                },
                {
                    name: "5分鐘負載",
                    stack: "總量",
                    //data: [89, 57, 85, 44, 25, 4, 54],
                    data: y[1],
                    type: 'line'
                },
                {
                    name: "15分鐘負載",
                    stack: "總量",
                    //data: [1, 43, 2, 12, 5, 4, 7],
                    data: z[1],
                    type: 'line'
                }
            ]
            };
            echo.setOption(option,true);
        };
        display();
    </script>
</body>
後端程式碼如下,其中的引數可以從資料庫內提取也可以從檔案中讀入。
from flask import Flask,render_template,request
import json

app = Flask(import_name=__name__,
            static_url_path='/python',   # 設定靜態檔案的存取url字首
            static_folder='static',      # 設定靜態檔案的資料夾
            template_folder='templates') # 設定模板檔案的資料夾

@app.route('/', methods=["GET"])
def index():
    Address = {'226': 4, '404': 12, '200': 159, '400': 25, '102': 117, '302': 1625}
    Types = {'Linux': 23, 'studies': 57, 'Windows': 87, 'compatible': 44, 'web': 32, 'X11': 78}
    x = {'03:30': 12, '03:48': 25, '04:15': 47, '04:28': 89, '04:42': 66, '04:51': 54}
    y = {'05:22': 55, '07:48': 29, '07:15': 98, '08:54': 11, '08:41': 61, '06:51': 5}
    z = {'07:30': 1, '09:48': 5, '06:15': 24, '08:28': 59, '2:42': 11, '08:51': 22}

    return render_template("index.html",Address = json.dumps(Address), Types= json.dumps(Types), x = json.dumps(x), y = json.dumps(y), z = json.dumps(z))

if __name__ == '__main__':
    app.run(host="127.0.0.1", port=80, debug=False)
輸出效果如下:

文章作者:lyshark (王瑞)
文章出處:https://www.cnblogs.com/LyShark/p/16755896.html
版權宣告:本部落格文章與程式碼均為學習時整理的筆記,文章 [均為原創] 作品,轉載請 [新增出處] ,您新增出處是我創作的動力!
轉載文章請遵守《中華人民共和國著作權法》相關規定或遵守《署名CC BY-ND 4.0國際》禁止演繹規範,合理合規攜帶原創出處轉載。
文章出處:https://www.cnblogs.com/LyShark/p/16755896.html
版權宣告:本部落格文章與程式碼均為學習時整理的筆記,文章 [均為原創] 作品,轉載請 [新增出處] ,您新增出處是我創作的動力!
轉載文章請遵守《中華人民共和國著作權法》相關規定或遵守《署名CC BY-ND 4.0國際》禁止演繹規範,合理合規攜帶原創出處轉載。