主流前沿的開源監控和報警系統Prometheus+Grafana入門之旅
Prometheus概述
定義
Prometheus 官網地址 https://prometheus.io/
Prometheus 官網檔案地址 https://prometheus.io/docs/introduction/overview/
Prometheus GitHub地址 https://github.com/prometheus/prometheus
Prometheus是一個開源的系統監控和警報工具包,最初由SoundCloud開發的,社群活躍,2016年加入了雲原生計算基金會成為繼Kubernetes之後的第二個託管專案;普羅米修斯以時間序列資料的形式收集並儲存度量值;大部分模組由Go語言編寫的。最新版本v2.37.0
特性
- 多維資料模型,時間序列資料由指標名稱和鍵/值對標識。
- PromQL靈活的查詢語言。
- 不依賴於分散式儲存,單個節點自治。
- 時間序列收集通過拉模型基於HTTP。
- 基於閘道器實現採集監控指標資料的推播。
- 目標通過服務發現或靜態設定。
- 多種模式的圖形化和儀表板支援。
- 支援分層和水平聯合。
元件
- Prometheus伺服器:用於抓取和儲存時間序列資料。
- Prometheus本身是一個以程序方式啟動,之後多程序和多執行緒實現監控資料收集,計算,查詢,更新,儲存的咋樣一個C/S模型執行模式。
- Prometheus採用的是time-series(時間序列)的方式以一種自定義的格式儲存在本地硬碟上。
- Prometheus的本地T-S(time-series)資料庫以每兩小時為間隔來分block(塊)儲存,每一個塊中又分為多個chunk檔案,chunk檔案是用來存放採集過來的T-S資料,metadata和索引檔案(index)。
- index檔案,是對metrics(Prometheus中一次K/V採集資料,叫做一個metric)和labels(標籤)進行索引,之後儲存在chunk中,chuunk是作為儲存的基本單位,index and metadata是作為子集。
- Prometheus平時是將採集過來的資料,先都存放在記憶體之中(Prometheus對記憶體的消耗還是不小的),以類似快取的方式,用於加快搜尋和存取
當出現宕機時,Prometheus有一種保護機制叫做WAL,可以將資料定期存入硬碟中,以chunk來表示,並在重新啟動時,用以恢復進入記憶體。
- 使用者端庫:編寫自定義收集器從其他系統提取指標,並將指標公開給普羅米修斯。
- Pushgateway:閘道器,支援短週期的監控指標推播。
- exporters:用於HAProxy, StatsD, Graphite等服務的特殊用途採集。
- alertmanager:處理各種警報支援工具。
架構
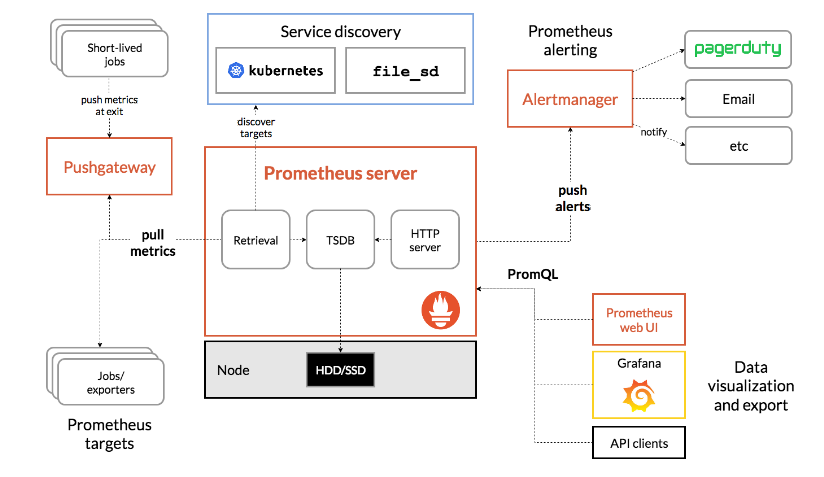
Prometheus可以通過exporters直接拉取監控指標,或者通過Pushgateway獲取短期任務推播監控資料,資料儲存在Prometheus伺服器端本地,基於儲存時間序列的資料上執行分析、聚合、生成警報。可以使用Grafana或其他API消費者對收集的資料進行視覺化。普羅米修斯可以很好地記錄任何純數位的時間序列,它既適合以機器為中心的監視,也適合高度動態的面向服務的體系結構的監視,特別擅長於微服務和容器下多維資料收集和查詢。也適合對可靠性要求高場景,每個Prometheus伺服器都是獨立的,不依賴於網路儲存或其他遠端服務。
優勢
- 相比其他老款監控的不可被替代的巨大優勢,功能更加強大
- 監控資料的精細程度高,可以精確到1~5秒的採集精度,是其他監控系統無法企及的。
- 叢集部署的速度,監控指令碼的製作(指的是熟練之後)非常快速,大大縮短監控的搭建時間成本,周邊外掛很豐富大多數都不需要自己開發了。
- 本身基於數學計算模型,大量的實用函數可以實現很複雜規則的業務邏輯監控(例如QPs的曲線彎曲凸起下跌的比例等等模糊概念)。
- 可以嵌入很多開源工具的內部進行監控資料更準時更可信(其他監控很難做到這一點)。
- 本身是開源的,更新速度快,bug修復快·支援N多種語言做本身和外掛的二次開發。
- 圖形很高大上很美觀老闆特別喜歡看這種業務圖(主要是指跟 Grafana的結合)。
對運維要求
- 要求對作業系統有很深入紮實的瞭解,不能只是浮在表面。
- 對資料思維有一定的要求,因為它基本的核心就是數學公式。
- 對監控的經驗有很高的要求,很多時候,監控項需要很細的客製化。
資料模型(DATA MODEL)
從根本上說,Prometheus將所有資料儲存為時間序列:帶有時間戳的資料流屬於同一度量標準和同一組標記維度。除了儲存的時間序列,Prometheus還可以生成臨時的派生時間序列作為查詢的結果。
- 度量名稱和標籤(Metric names and labels):每個時間序列由其度量名稱和可選的鍵值對(稱為標籤)唯一標識。
- 樣本(Samples):樣本構成實際的時間序列資料。每個樣本包括,float64值和毫秒精度的時間戳。
- 標記(Notation):給定一個度量名稱和一組標籤,時間序列經常使用以下符號來標識。
工作和範例(JOBS AND INSTANCES)
在Prometheus術語中,可以抓取的端點稱為範例,通常對應於單個程序。具有相同目的的範例集合,例如為了可伸縮性或可靠性而複製的程序,稱為作業。
例如一個有四個複製範例的API伺服器作業
- job:api-server
- instance 1:
1.2.3.4:5670 - instance 2:
1.2.3.4:5671 - instance 3:
5.6.7.8:5670 - instance 4:
5.6.7.8:5671
- instance 1:
自動生成標籤和時間序列,當Prometheus抓取目標時,它會自動在抓取的時間序列上附加一些標籤,用於識別被抓取的目標:
- job:設定的目標所屬的作業名稱。
- instance:被抓取的目標URL的
: 部分。
指標度量(metrics)
Prometheus監控中,對於採集過來的資料,統一成為metrics資料,metrics已經相信大家都已耳熟,當我們需要為某個系統某個服務做監控、做統計,就需要用到metrics。metrics是一種對採集資料的總稱(metrics並不代表某一種具體的資料格式,是一種對於度量計算單位的抽象)
Prometheus使用者端庫提供了四種核心度量型別;目前僅在使用者端庫(以支援針對特定型別的使用進行客製化的api)和連線協定中區分這些型別。Prometheus伺服器還沒有使用型別資訊,並將所有資料扁平化為無型別的時間序列;常見使用的就是counter、gauges和histogram
- Gauges
- 最簡單的度量指標,只有一個簡單的返回值,或者叫瞬間狀態,舉個例子:要監控硬碟容量或者記憶體的使用量,那麼就應該使用Gauges的metrics格式來度量。
- 因為硬碟的容量或者記憶體的使用量是隨著時間的推移,不過的瞬時變化這種變化沒有規律,當前是多少採集回來就是多少,既不能肯定是一直持續增長,也不能肯定是一直降低,這種就是Gauges使用型別的代表。
- Counter
- Counter計數器,從資料量0開始累積計算,在理想狀態下,只能是永遠的增長,不會降低(一些特殊情況另說).舉個例子:比如對使用者存取量的取樣資料,產品被使用者存取一次就是1,過了10分鐘後,累積到100過一天後,累積到20000一週後,積累到100000。
- Histograms
- Histogram統計資料的分佈情況,比如最小值,最大值,中間值,還有中位數,75百分位,90百分位,95百分位,98百分位,99百分位,和99.9百分位的值(percentiles)。這是一種特殊的Metrics資料型別,代表的是一種近似的百分比估算數值。
- 可以通過Histogram型別(prometheus中,其實提供了一個基於histogram演演算法的函數,可以直接使用)可以分別統計出,全部使用者的響應時間中~=0.05秒的量有多少 0 ~ 0.05秒的有多少, > 2秒的有多少 > 10 秒的有多少 = 1%多少處於速度極快的使用者,多少處於慢請求或者有問題的請求。
- Summary
- 與直方圖類似,摘要取樣觀察結果(通常是像請求持續時間和響應大小這樣的東西)。雖然它還提供了觀測的總數和所有觀測值的總和,但它在滑動時間視窗中計算可設定的分位數。
函數
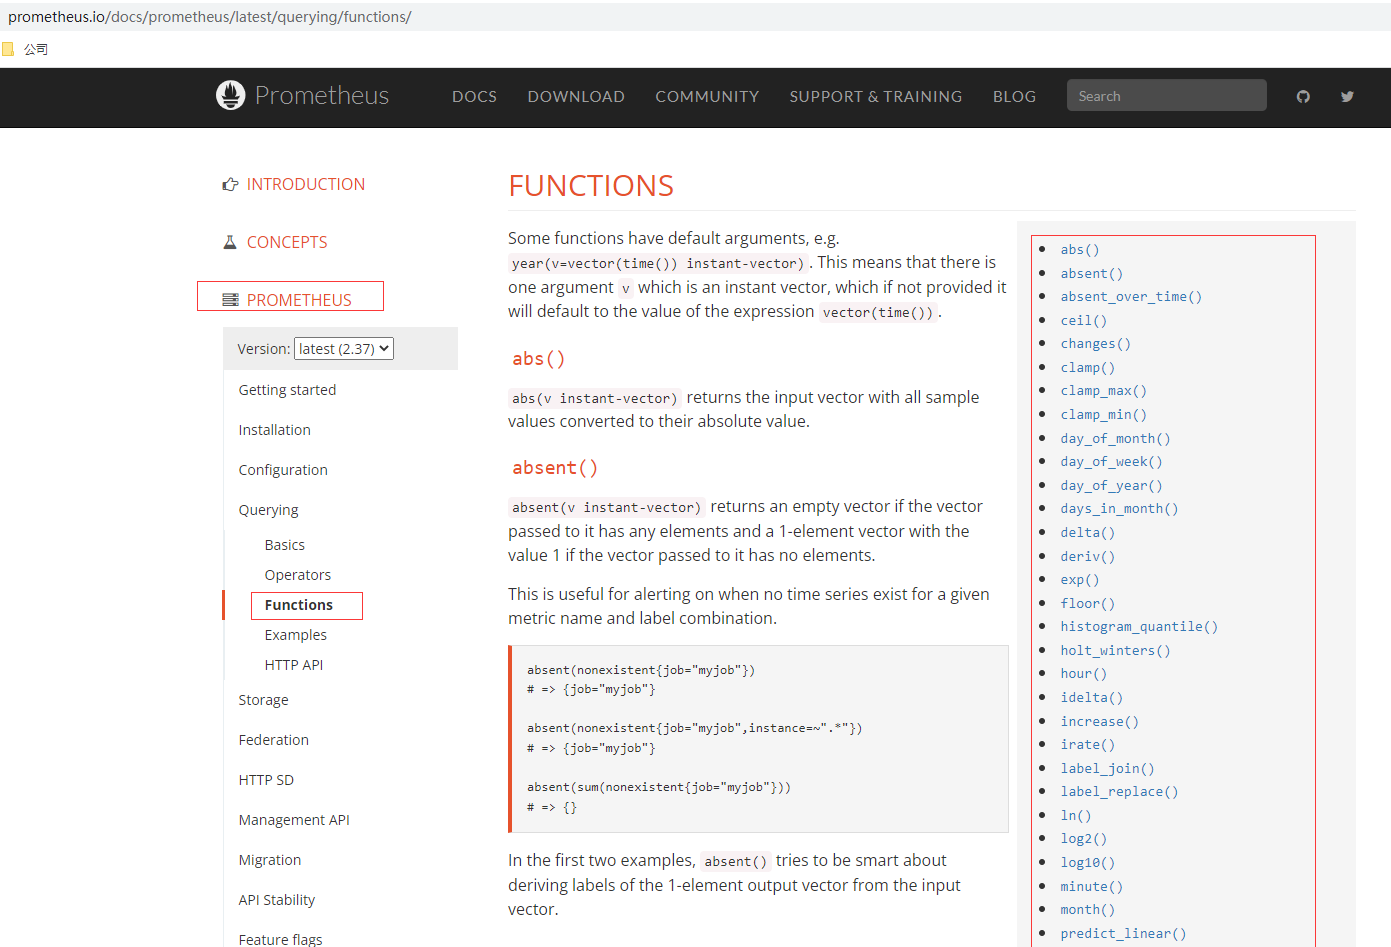
Prometheus的查詢提供很多內建的函數,這些函數後續在實戰使用到再說,可以在使用查閱官網檔案說明,比如
- rate() 函數:就是是專門搭配counter型別資料使⽤的函數,它的功能是按照設定⼀個時間段,取counter在這個時間段中的平均每秒的增量。
- increase():increase 函數 在promethes中,是⽤來 針對Counter 這種持續增長的數值,擷取其中⼀段時間的增量。
Prometheus部署
Docker部署
# 掛載組態檔方式部署,準備prometheus.yml檔案,可以從二進位制檔案拷貝,預設設定無需修改,或者從github中獲取,這裡暴露埠我改為9080,本機已有9090的服務
docker run \
    -p 9080:9090 \
    -v /home/commons/prometheus/config/prometheus.yml:/etc/prometheus/prometheus.yml \
    prom/prometheus
# 掛載設定目錄方式部署
docker run \
    -p 9090:9090 \
    -v //home/commons/prometheus/config:/etc/prometheus \
    prom/prometheus
檢視docker容器程序

存取http://192.168.50.95:9080/ 出現prometheus的控制檯頁面

二進位制部署
# 下載最新版本v2.37.0的prometheus server
wget https://github.com/prometheus/prometheus/releases/download/v2.37.0/prometheus-2.37.0.linux-amd64.tar.gz
# 解壓檔案
tar -xvf prometheus-2.37.0.linux-amd64.tar.gz
# 進入目錄
cd prometheus-2.37.0.linux-amd64
# 後臺執行prometheus server,可通過nohup &之類或後臺執行管理工具如daemonize、screen
nohup ./prometheus > prometheus.log 2>&1 &
預設情況下無需修改prometheus根目錄下的prometheus.yml組態檔就可啟動
# my global config
global:
  scrape_interval: 15s # Set the scrape interval to every 15 seconds. Default is every 1 minute.
  evaluation_interval: 15s # Evaluate rules every 15 seconds. The default is every 1 minute.
  # scrape_timeout is set to the global default (10s).

# scrape_interval. 抓取採詳資料的時間間隔,預設每15秒去被監控機上採詳一次,這個就是我們所說的Prometheus的自定義資料採集頻率
# evaluation_interval. 監控資料規則的評估頻率,預設為15秒,這個引數是Prometheus多長時間會進行一次監控規則的評估,假如設定當記憶體使用量 > 70%時,發出報警,這麼一條rule(規則),那麼Prometheus會預設每15秒來執行一次這個規則,檢查記憶體的情況。

# Alertmanager configuration 這個是Alertmanager是Prometheus的一個用於管理和發出報警的外掛
alerting:
  alertmanagers:
    - static_configs:
        - targets:
          # - alertmanager:9093

# Load rules once and periodically evaluate them according to the global 'evaluation_interval'.
rule_files:
  # - "first_rules.yml"
  # - "second_rules.yml"

# A scrape configuration containing exactly one endpoint to scrape:
# Here it's Prometheus itself.
# 在這個Jobs 的名字下面,具體來定義,要被監控的節點,以及節點上具體的埠資訊等等,如果Prometheus配合,例如consul這種服務發現軟體,Prometheus的組態檔,就不在需要人工去手工定義出來,而是能自動發現叢集中,有哪些新機器以及新機器上出現了哪些新服務可以被監控
scrape_configs:
  # The job name is added as a label `job=<job_name>` to any timeseries scraped from this config.
  - job_name: "prometheus"

    # metrics_path defaults to '/metrics'
    # scheme defaults to 'http'.

    static_configs:
      - targets: ["localhost:9090"]
存取http://192.168.5.52:9090/ 出現prometheus的控制檯頁面,無賬號密碼驗證(如果希望加上驗證,可以使用apache httpass方式新增)
存取http://192.168.5.52:9090/ 出現prometheus的控制檯頁面,無賬號密碼驗證(如果希望加上驗證,可以使用apache httpass方式新增)

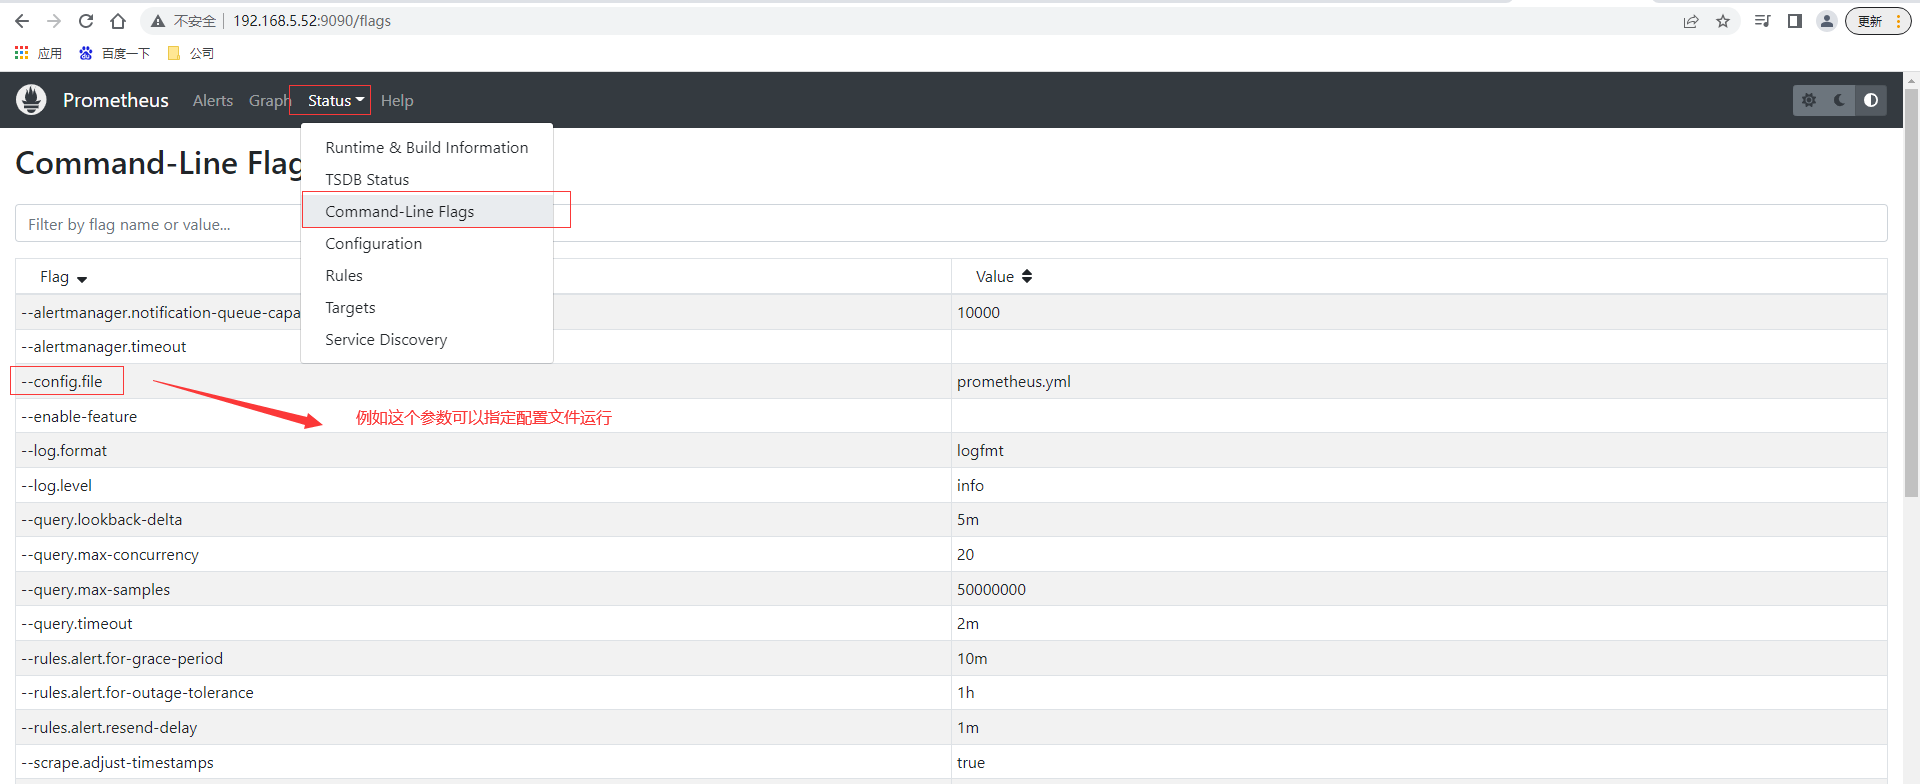
命令列支援引數可以查閱控制檯頁面http://192.168.5.52:9090/flags ,也可以直接通過控制檯頁面查詢prometheus.yml的設定內容
通過上面scrape_configs設定可以知道預設情況下設定了對prometheus的監控,查詢控制檯頁面prometheus的範例節點也是UP狀態

prometheus資料存放在data目錄下,其中長串字母的是歷史資料保留,⽽當前近期資料實際上保留在記憶體中,並且按照⼀定間隔存放在 wal / ⽬錄中防⽌突然斷電或者重啟以⽤來恢復記憶體中的資料。
監控基礎
監控對運維重要性
- 運維是什麼?
- 說白了就是管理伺服器,保證伺服器給線上產品提供穩定執行的服務環境。
- 監控是什麼?
- 說白了就是用一種形式去盯著觀察伺服器把伺服器的各種行為表現都顯示出來用以發現問題和不足。
- 報警是什麼?
- 監控和報警這兩個詞一定要分開說分開理解!監控是監控,報警是報警。監控是把行為表現展示出來,用來觀察的。報警則是當監控獲取的資料發生異常並且到達了某個臨界點的時候,採用各種途徑來通知使用者通知管理員通知運維人員甚至通知老闆。
- 很多時候總是把監控和報警混在一起說這是不正確的需要糾正,報警跟監控 嚴格來說 是需要分開對待的。
- 因為報警也有專門的報警系統。
- 報警系統包括⼏種主要的展現形式 : 簡訊報警,郵件報警,電話報警(語⾳播報), 通訊軟體。
- 不像監控系統 ⽐較成型的報警系統 ⽬前⼤多數都是收費的 商業化。
- 報警系統中 最重要的⼀個概念之⼀ 就是對報警閾值的理解,閾值(Trigger Value) ,是監控系統中 對資料到達某⼀個臨界值的定義;例如: 通過監控發現,當前某⼀臺機器的CPU突然升⾼,到達了 99%的使⽤率,99 就是作為⼀次報警的 觸發閾值。
監控理論基礎
-
監控重要性
- 監控在企業中扮演著重要的監督者的⾓⾊,任何⼀個地⽅出現問題都需要及時的知道,很多情況下企業對某種型別的監控需要⾮常的敏感(採集的精度),例如⽤戶正常存取這種業務級別的監控⼀旦出現了問題需要在秒級時間知道,(時間=錢)不然就是毀滅性的災難和損失由其是針對哪些⼤規模的企業。
-
監控運維基礎⼯作
- 基礎運維(系列第⼀階段)⼀線 主要扮演著 ⼀個處理⽇常任務,及時救⽕這樣的⾓⾊。
- 監控的搭建 和 資料採集的⼯作 很多時候 需要依賴於 運維開發的協助(開發 創新),不管是哪⼀種運維(哪怕你是運維架構師 運維專家)在緊急的時候 ⼈⼈都要扮演起 救⽕英雄的⾓⾊⽽救⽕ 指的是 及時的發現和解決線上出現的各種故障 問題那麼為了要做到 及時的發現問題,那麼⼀個好的完善的監控系統 就很⾃然的作為運維⼯作中的第⼀優先任務。
-
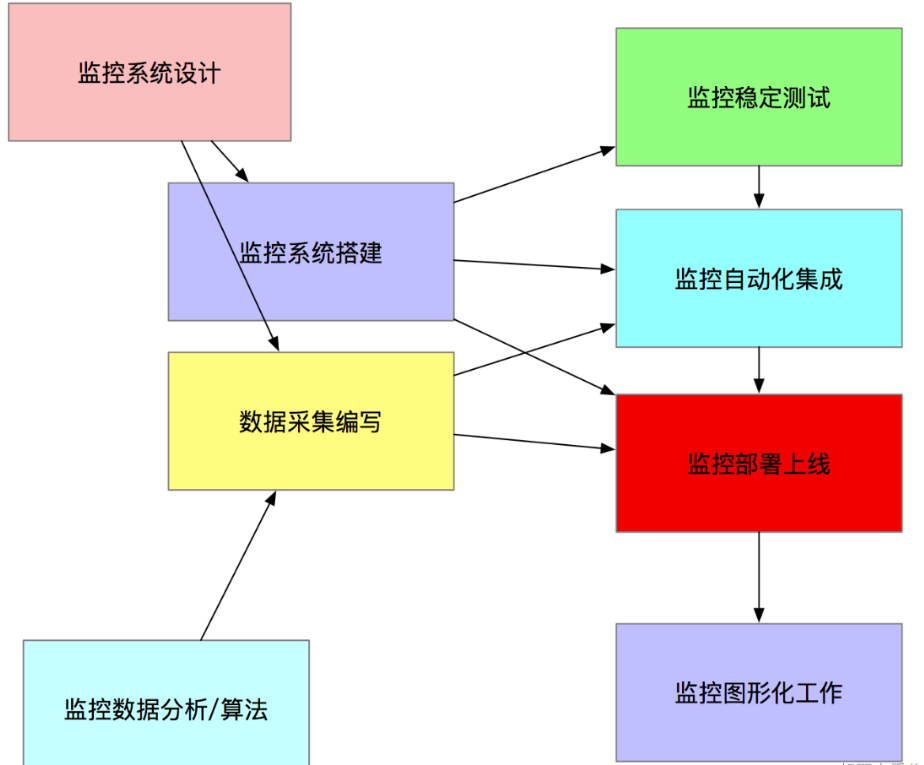
監控系統設計
- 評估系統的業務流程 業務種類 架構體系,各個企業的產品不同,業務⽅向不同,程式程式碼不同,系統架構更不同,對於各個地⽅的細節 都需要有⼀定程度的認知 才可以開起設計的源頭
- 分類出所需的監控項種類,⼀般可分為 : 業務級別監控 / 系統級別監控 / ⽹絡監控 / 程式程式碼監控/ ⽇志監控 / ⽤戶⾏為分析監控/ 其它種類監控⼤的分類 還有更多的細⼩分類。
-
監控系統實施總體過程
- 監控系統搭建
- 單點伺服器端的搭建(prometheus)
- 單點使用者端的部署
- 單點使用者端伺服器測試
- 採集程式單點部署
- 採集程式批次部署
- 監控伺服器端HA / cloud
- 監控資料圖形化搭建(Grafana)
- 報警系統測試(如Pagerduty)
- 報警規則測試
- 監控+報警聯合測試
- 正式上線監控
- 資料採集編寫
- shell / python / awk / lua (Nginx 安全控制,功能分類)/ php / perl/ go,作為監控資料採集, ⾸推 shell + python , 如果說 資料採集選取的模式 對效能/後臺/界⾯ 不依賴, 那麼shell速度最快 成本最低。
- ⼀次性採集和後臺採集。
- 監控資料分析/演演算法
- 監控的資料分析和演演算法 其實⾮常依賴 運維架構師對Linux作業系統的各種底層知識的掌握
- 監控穩定測試
- 穩定性測試 就是通過⼀段時間的單點部署觀察 對線上有沒有任何影響
- 監控自動化
- 如監控使用者端的批次部署,監控伺服器端的HA再安裝,監控項⽬的修改,監控項⽬的監控叢集變化的自動化, Puppet(設定⽂件部署),Jenkins(CI 持續整合部署) , CMDB(設定管理資料庫)
- 監控圖形化
- 採集的資料 和 準備好的監控演演算法,最終需要⼀個好的圖形展⽰ 才能發揮最好的作⽤
- 監控系統搭建
監控面臨問題
- 監控自動化依然不夠
- 很少能和CMDB完善的結合起來
- 監控依然需要大量人工
- 監控的準確性和真實性 提⾼的緩慢
- 監控工具和方案的制定較為潦草
- 對監控本身的重視程度依然有待提高
Prometheus部署
資料採集
概述
Prometheus主要有兩種方式採集:pull 主動拉取的形式和push 被動推播的形式。
pull : 指的是使用者端(被監控機器)先安裝各類已有exporters(由社群組織或企業開發的監控使用者端外掛)在系統上之後,exporters以守護行程的模式執行,並開始採集資料,exporter本身也是一個http_server可以對http請求作出響應返回資料,Prometheus用pull這種主動拉取的方式(HTTP get)去存取每個節點上exporter並採集回需要的資料。
push: 指的是在使用者端(或伺服器端)安裝官方提供的pushgateway外掛,然後使用我們運維自行開發的各種指令碼,把監控資料組織成K/V的形式metrics形式,傳送給pushgateway之後pushgateway會在推播給Prometheus,這種是一種被動的資料採集模式。
exporter的使用
官網提供提供多種獨立常用的exporter,這些exporter分別使用不同的開發語言開發
- prometheus
- alertmanager
- blackbox_exporter
- consul_exporter
- graphite_exporter
- haproxy_exporter
- memcached_exporter
- mysqld_exporter
- node_exporter
- pushgateway
- statsd_exporter
比如最常用的 node_exporter就非常強大,幾乎可以把Linux系統中和系統自身相關的監控資料全抓出來(很多引數)
# 下載最新版本v1.4.0node_exporter
wget https://github.com/prometheus/node_exporter/releases/download/v1.4.0-rc.0/node_exporter-1.4.0-rc.0.linux-amd64.tar.gz
# 解壓
tar -xvf node_exporter-1.4.0-rc.0.linux-amd64.tar.gz
# 進入目錄
cd node_exporter-1.4.0-rc.0.linux-amd64
# 啟動node_exporter
nohup ./node_exporter > node_exporter.log 2>&1 &
node_exporter預設工作在9100埠,可以響應Prometheus_server發過來的HTTP_GET請求,也可以響應其它方式的HTTP_GET請求,測試下請求
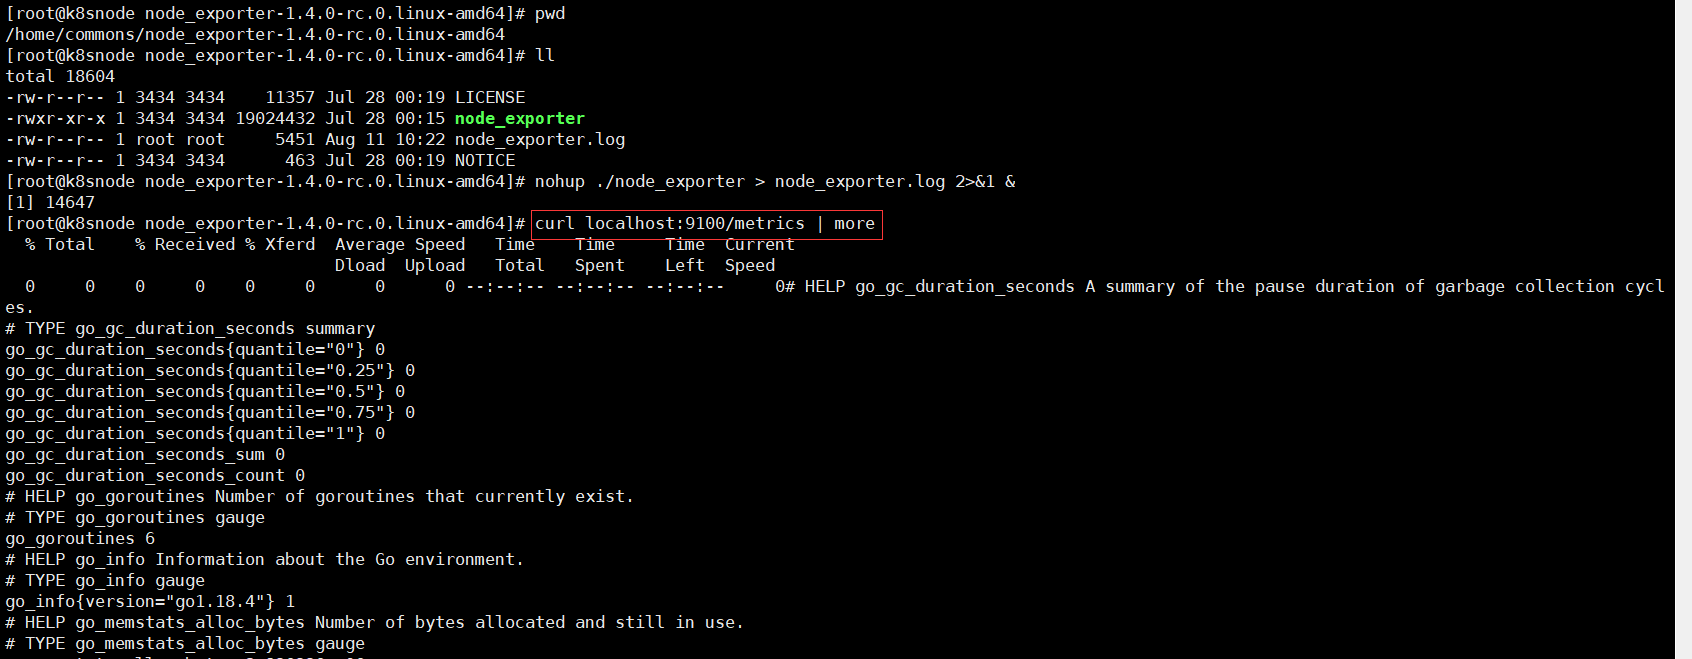
執行curl之後,可以看到node_exporter返回了大量的metrics型別的K/V資料,這些返回的K/V資料,其中的Key名稱,可以直接複製到Prometheus的查詢命令列來檢視結果。將剛才node_exporter部署節點的通過檔案設定發現的加入Prometheus的監控中,在Prometheus的prometheus.yml組態檔內scrape_configs設定節點中增加job_name: "node_exporter"的設定資訊
scrape_configs:
  - job_name: "node_exporter"
    static_configs:
      # targets可以並行寫入多個節點,用逗號隔開,機器名或者IP+埠號,埠號:通常用的就是exporter的埠,這裡9100其實是node_exporter的預設埠
      - targets: ["192.168.50.95:9100"]
重新啟動prometheus,prometheus就可以通過組態檔識別監控的節點,持續開始採集資料。檢視監控目標頁面已經有加進來的node_exporter節點了
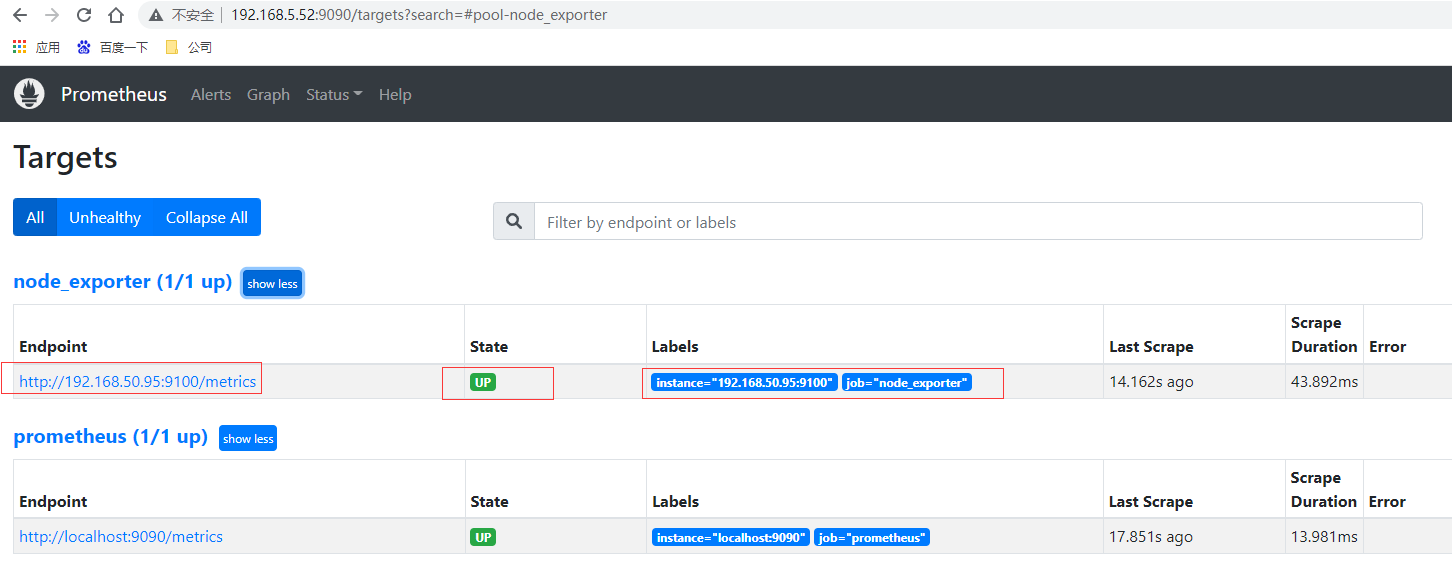
# 先通過http請求檢視剛部署的node_exporter節點的記憶體資訊
curl localhost:9100/metrics | grep node_memory_MemFree

本⾝node_exporter提供的 keys 實在太多了 (因為 都是從Linux系統中的底層各種挖掘資料回來),找到key為node_memory_MemFree_bytes後直接複製在prometheus的Graph頁面中檢視,已經可以看到查詢的資料

還可以切換到圖檢視最近15分鐘的資料曲線趨勢圖
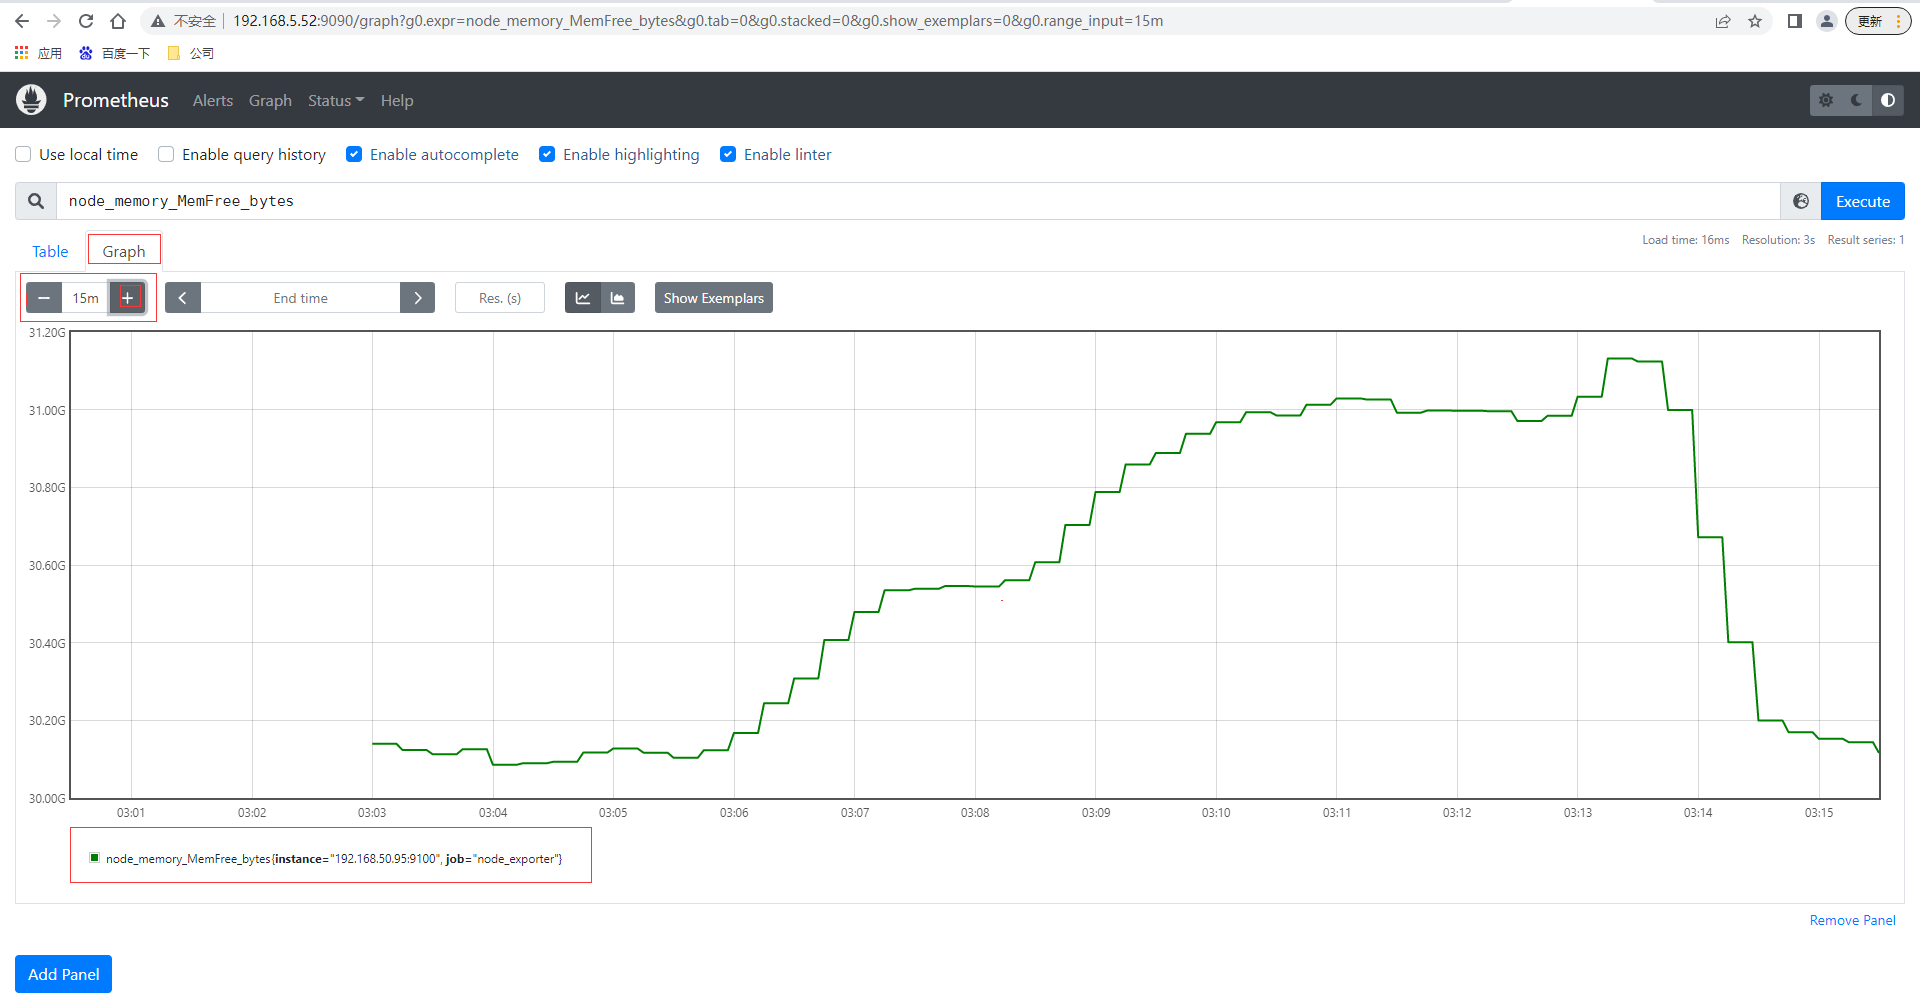
pushgateway使用
部署
pushgateway 是另⼀種採⽤被動推播的⽅式(⽽不是exporter主動獲取)獲取監控資料的prometheus 外掛,它是可以單獨運⾏在 任何節點上的外掛(並不⼀定要在被監控使用者端),然後通過⽤戶⾃定義開發指令碼把需要監控的資料傳送給pushgateway,然後pushgateway再把資料推播給prometheus server。
pushgateway的安裝以及執行和設定,pushgateway 跟 prometheus和 exporter ⼀樣。
# 下載最新版本v1.4.0node_exporter
wget https://github.com/prometheus/pushgateway/releases/download/v1.4.3/pushgateway-1.4.3.linux-amd64.tar.gz
# 解壓
tar -xvf pushgateway-1.4.3.linux-amd64.tar.gz
# 進入目錄
cd pushgateway-1.4.3.linux-amd64/
# 啟動pushgateway
nohup ./pushgateway > pushgateway.log 2>&1 &

從上面可以看到pushgateway預設的埠為9091,接下來 在prometheus.yml 設定⽂件中, 單獨定義⼀個job設定target 指向到pushgateway運⾏所在的機器名和pushgateway運⾏的埠即可
  - job_name: "pushgateway"
    static_configs:
      # targets可以並行寫入多個節點,用逗號隔開,機器名或者IP+埠號,埠號:通常用的就是pushgateway的埠,這裡9091其實是pushgateway的預設埠
      - targets: ["192.168.50.94:9091"]
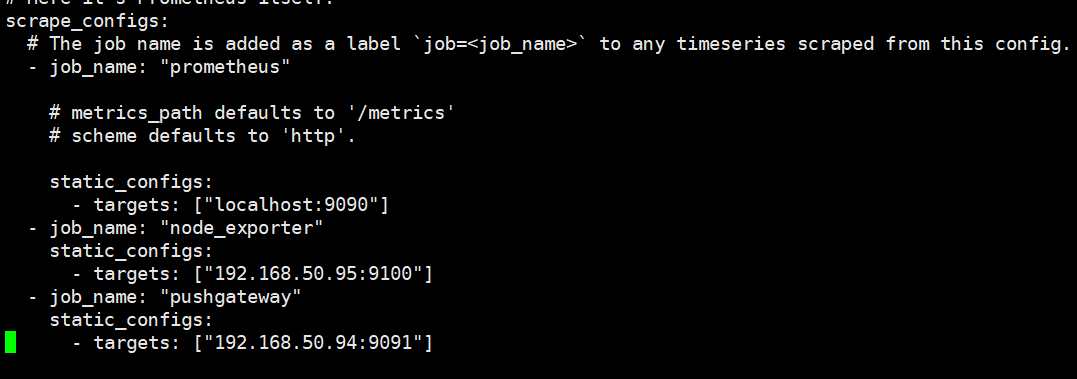
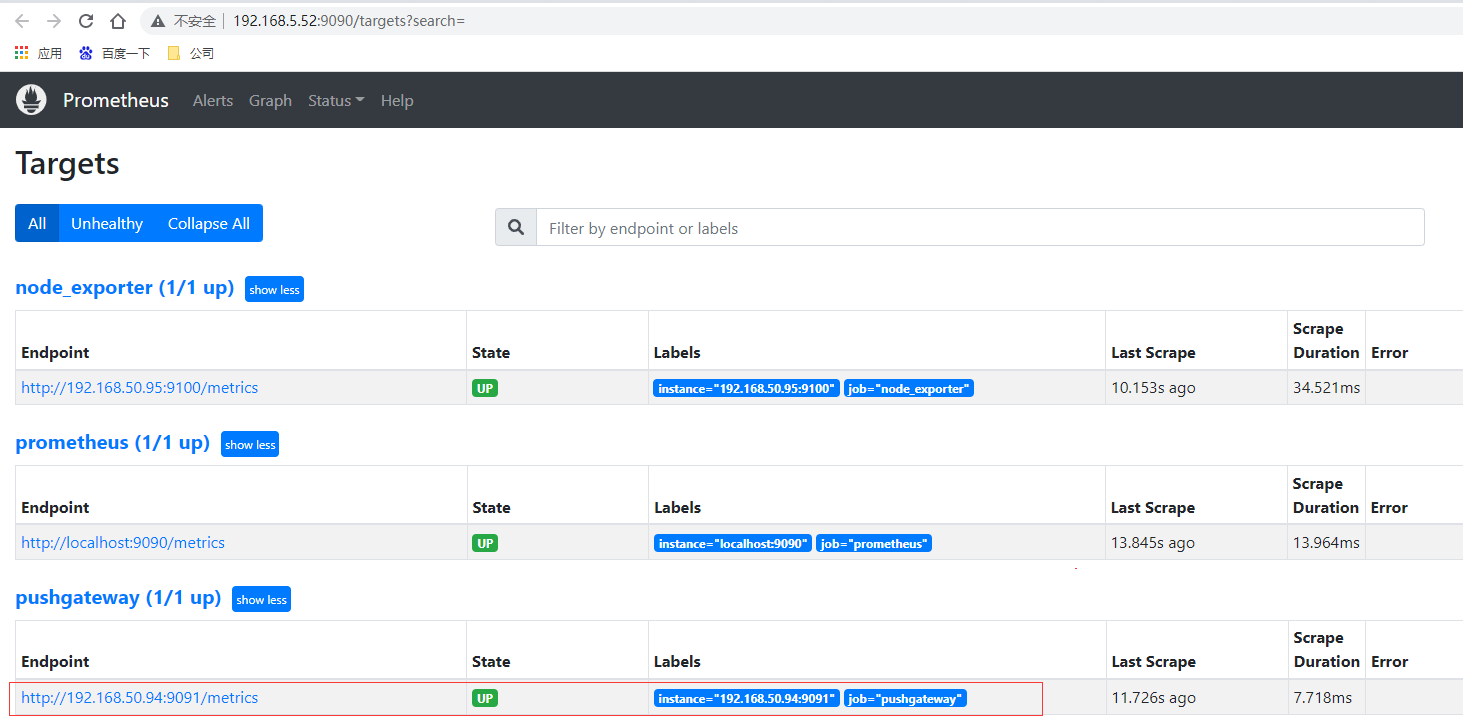
重新啟動prometheus,檢視監控目標頁面已經有加進來的pushgateway節點了
指令碼測試
pushgateway 本⾝是沒有任何抓取監控資料的功能的 它只是被動的等待推播過來,pushgateway 程式設計指令碼的寫法,這裡使⽤shell 編寫的 pushgateway指令碼⽤於抓取 TCP waiting_connection 瞬時數量,編寫monitor.sh如下
#!/bin/bash
instance_name=`hostname -f | cut -d'.' -f1` #本機機器名變數於之後的 標籤
if [ $instance_name == "localhost" ];then # 要求機器名不能是localhost不然標籤就沒有區分了
echo "Must FQDN hostname"
exit 1
fi

# For waitting connections
label="count_netstat_wait_connections" # 定義個新的 key
# 定義1個新的數值 netstat中 wait 的數量,通過Linux命令⾏ 就簡單的獲取到了需要監控的資料 TCP_WAIT數
count_netstat_wait_connections=`netstat -an | grep -i wait | wc -l`
echo "$label : $count_netstat_wait_connections"
# 把 key & value 推播給 pushgatway
echo "$label $count_netstat_wait_connections" | curl --data-binary
@- http://192.168.50.94:9091/metrics/job/pushgateway/instance/$instance_name
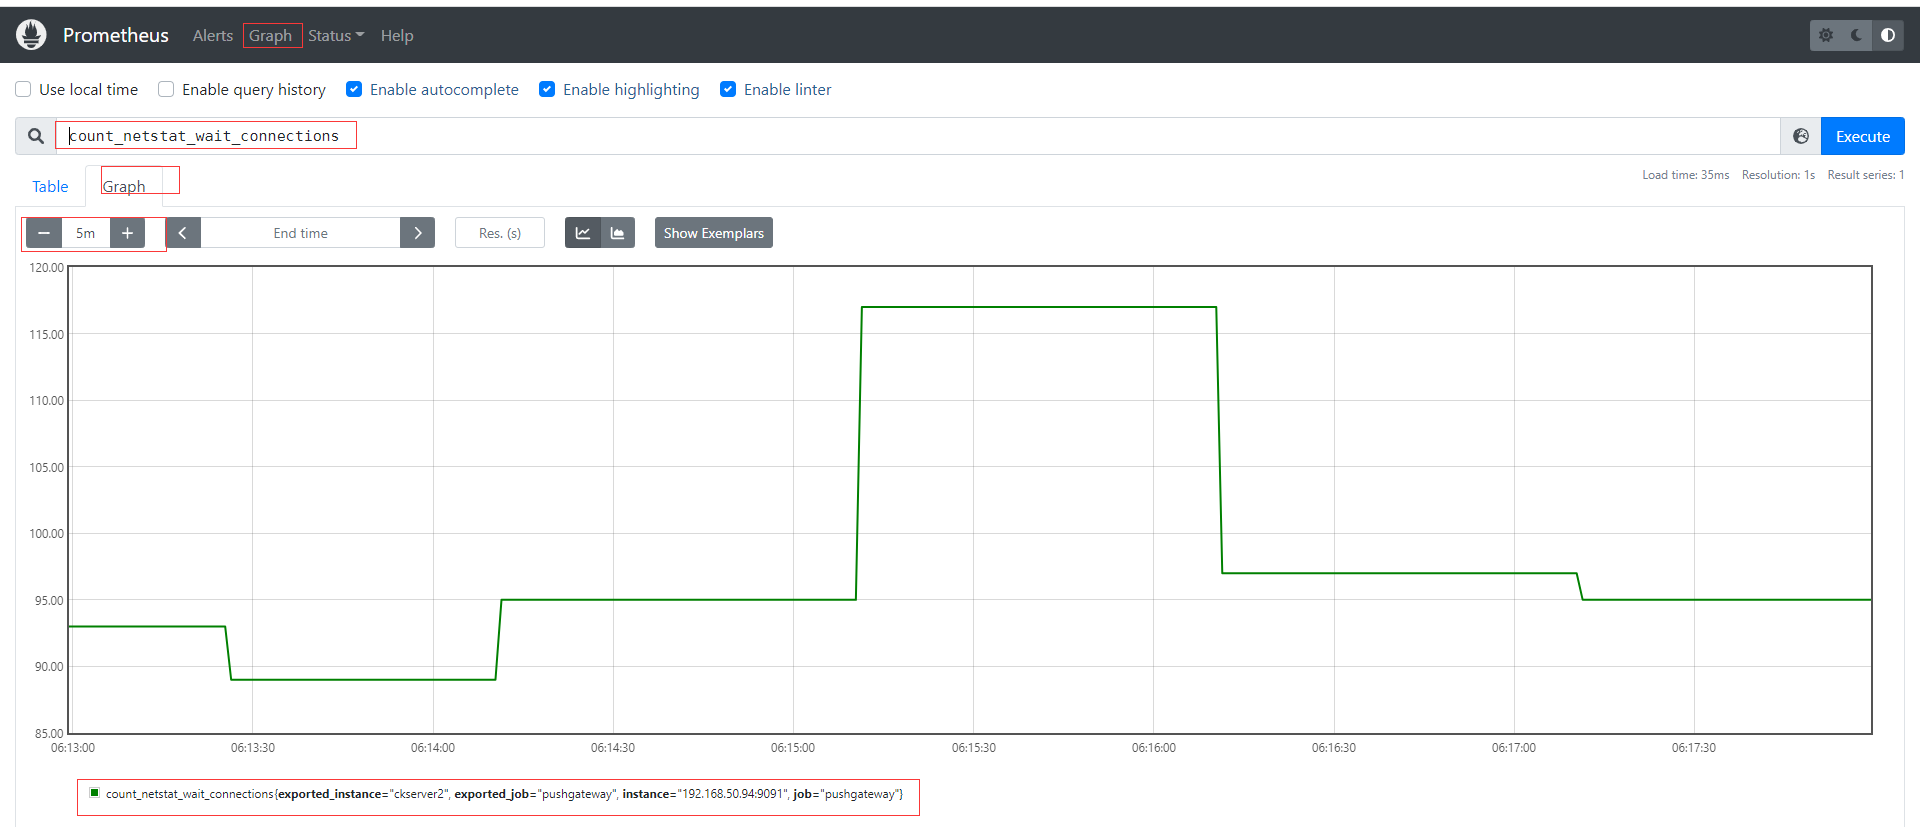
如果是每分鐘推播一次則可以結合crontab,如* * * * * sh /home/commons/script/monitor.sh,如果是短於一分鐘也可以shell指令碼通過迴圈使用sleep實現;再到頁面上檢視剛才自定義的key,已經有采集到資料。
其他種類的監控資料我們都可以通過類似的形式直接寫指令碼傳送實現自定義採集。
優缺點
pushgateway這種⾃定義的採集⽅式⾮常的快速⽽且極其靈活⼏乎不收到任何約束,⾮常希望 使⽤pushgateway來獲取監控資料的,各類的exporters雖然玲琅滿⽬⽽且預設提供的資料很多了已經,⼀般情況下企業中只安裝 node_exporter 和 DB_exporter兩個,其他種類的 監控資料傾向於全部使⽤pushgateway的⽅式採集 (要的就是快速~ 靈活~)。官網在最佳實踐章節也有說明何時使用pushgateway,Pushgateway是一箇中介服務,它允許你從無法抓取的工作中推播指標。
- pushgateway 會形成⼀個單點瓶頸,假如好多個指令碼同時傳送給 ⼀個pushgateway的程序如果這個程序沒了,那麼監控資料也就沒了。
- pushgateway 並不能對傳送過來的指令碼採集資料進⾏更智慧的判斷,假如指令碼中間採集出問題了那麼有問題的資料pushgateway⼀樣照單全收傳送給Prometheus。
CPU使用率監控範例
# 通過node_cpu關鍵字檢視關於cpu的監控項
curl localhost:9100/metrics | grep node_cpu
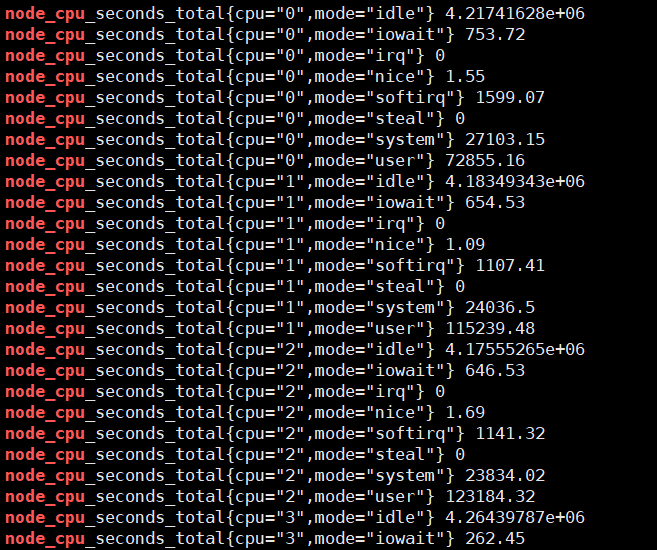
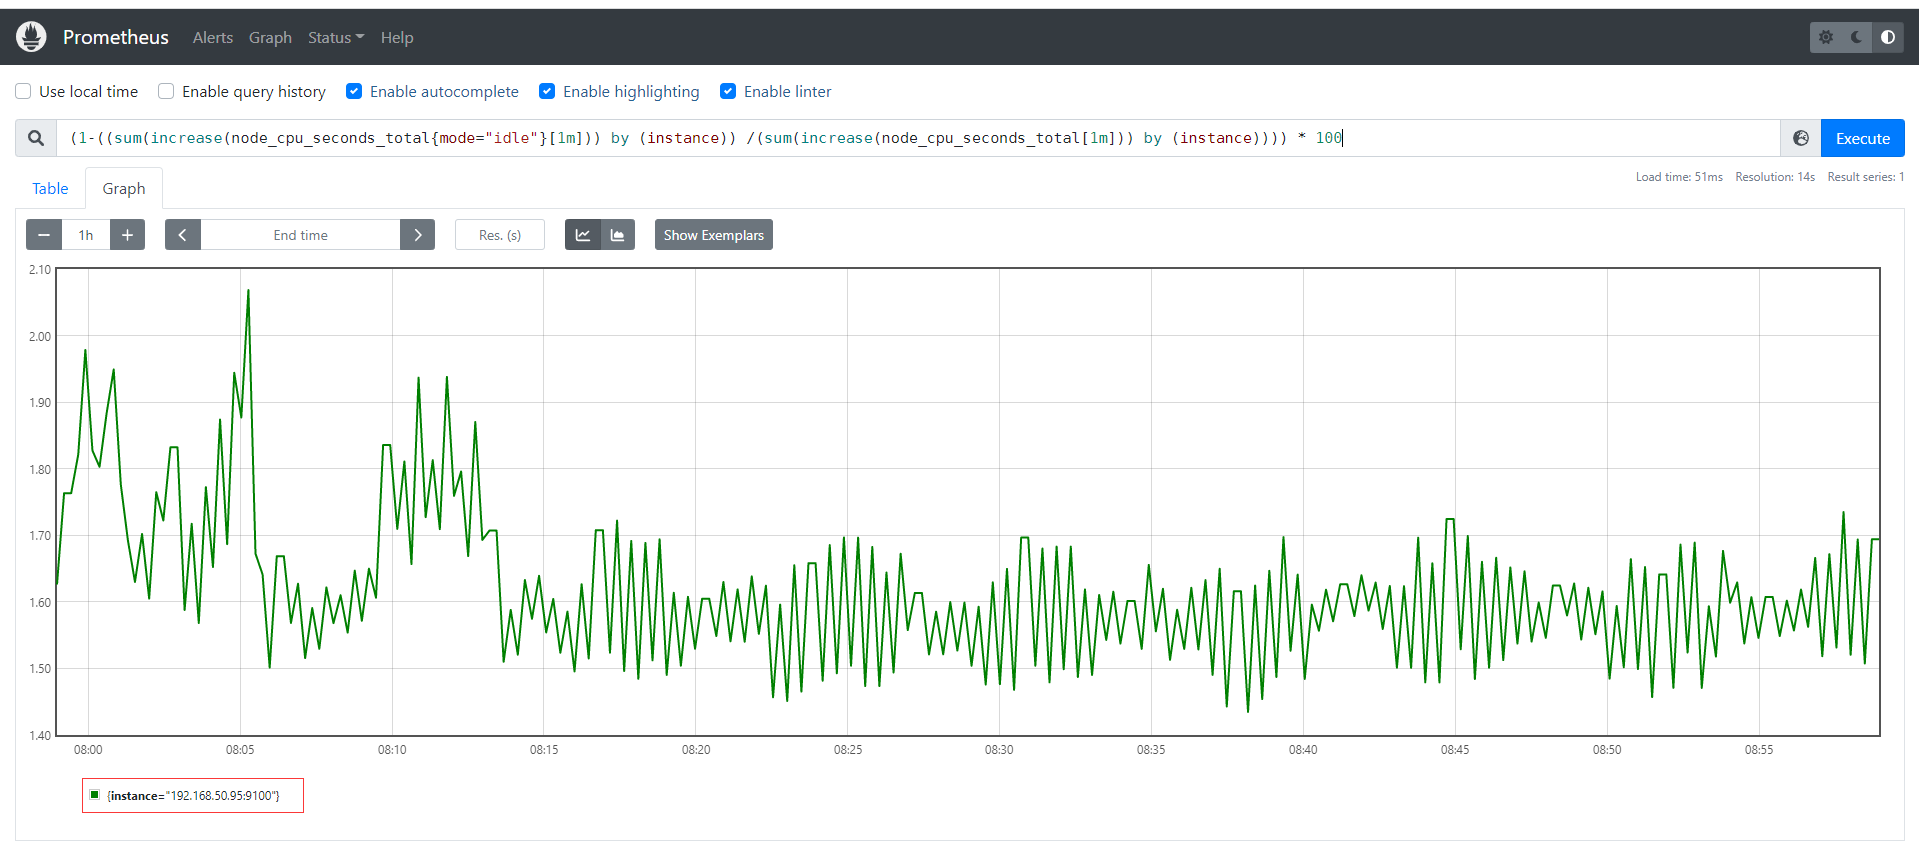
輸入查詢之後,可以看到結果,這個值是CPU各個核各個狀態下從開機開始一直累積下來的CPU使用時間的累計值,但我們理解的CPU應該是使用率,類似百分50%和80%這樣的資料才更好理解。
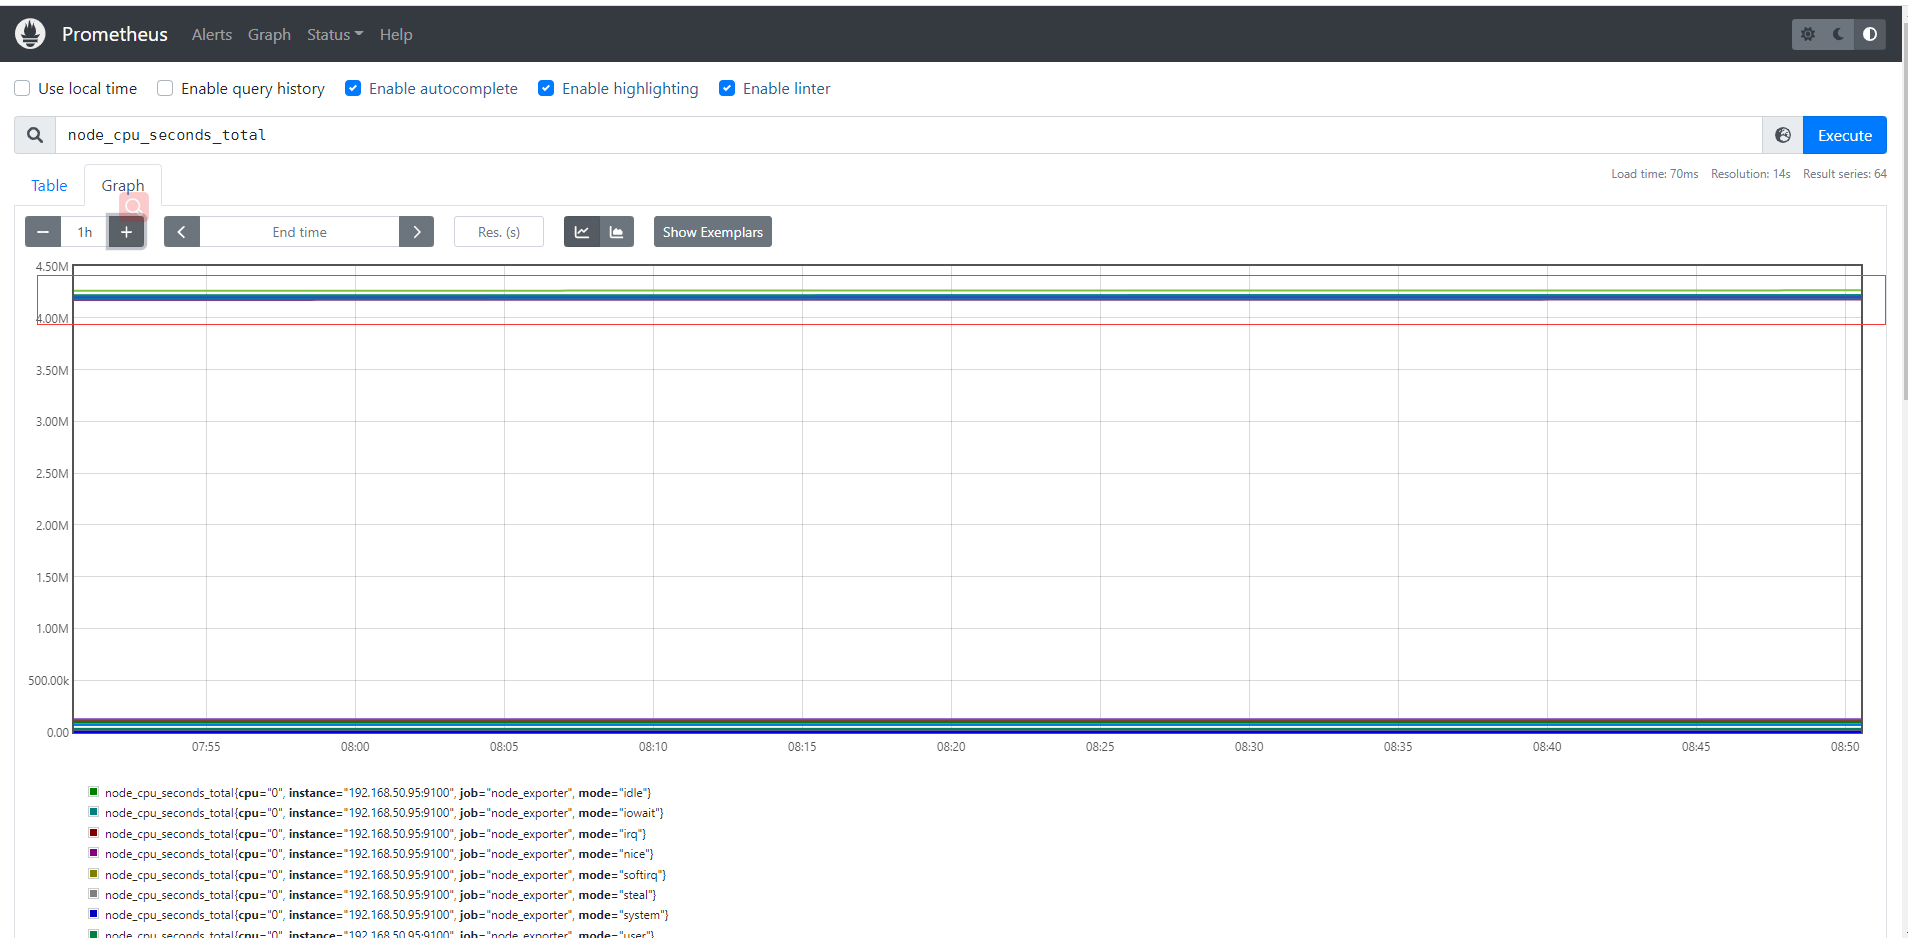
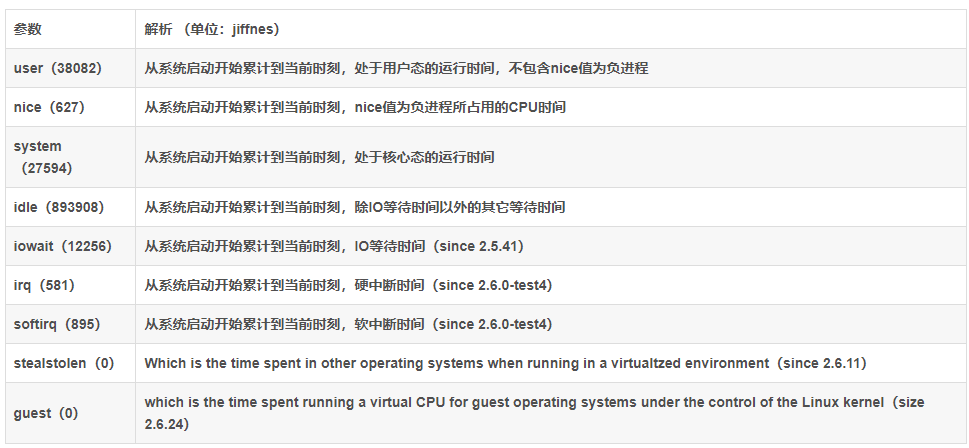
Prometheus對linux CPU的採集,並不是直接給我們返回一個現成的CPU百分比,而是返回Linux中很底層的cpu時間片,累積數值的咋樣一個資料(我們平時用慣了top/uptime這種簡便的方式看CPU使用率,根本沒有深入理解所謂的CPU使用率在Linux中到底怎麼回事),CPU使用時間包括CPU使用者態使用時間,系統/核心態使用時間,nice值分配使用時間,空閒時間,中斷時間等等。各個CPU狀態的時間單位解如下:
# 編寫數學公式如下,所以說需要理解底層原理和Prometheus對於數學的支援
(1-((sum(increase(node_cpu_seconds_total{mode="idle"}[1m])) by (instance)) /(sum(increase(node_cpu_seconds_total[1m])) by (instance)))) * 100
Grafana部署
定義
Grafana 官網地址 https://grafana.com/
Grafana 官網檔案地址 https://grafana.com/docs/grafana/latest/?pg=oss-graf&plcmt=resources
Grafana GitHub地址 https://github.com/grafana/grafana
Grafana 是⼀款近⼏年新興的開源資料繪圖⼯具平臺預設⽀持如下這麼多種資料來源作為輸⼊,無論它們儲存在哪裡都可以查詢、視覺化、警告和理解您的指標,Grafana可以通過漂亮、靈活的儀表板建立、探索和共用所有的資料。最新版本為9.0.7,由於Grafana有告警功能,因此可以直接Grafana來替換prometheus自身提供的告警系統,這也是目前各大企業最青睞視覺化產品和最佳實踐。
部署
# 下載最新版本v9.0.7的grafana
wget https://dl.grafana.com/enterprise/release/grafana-enterprise-9.0.7.linux-amd64.tar.gz
# 解壓檔案
tar -xvf grafana-enterprise-9.0.7.linux-amd64.tar.gz
# 進入目錄
cd grafana-9.0.7
# 後臺執行grafana-server,可通過nohup &之類或後臺執行管理工具如daemonize、screen
nohup ./grafana-server > grafana-server.log 2>&1 &
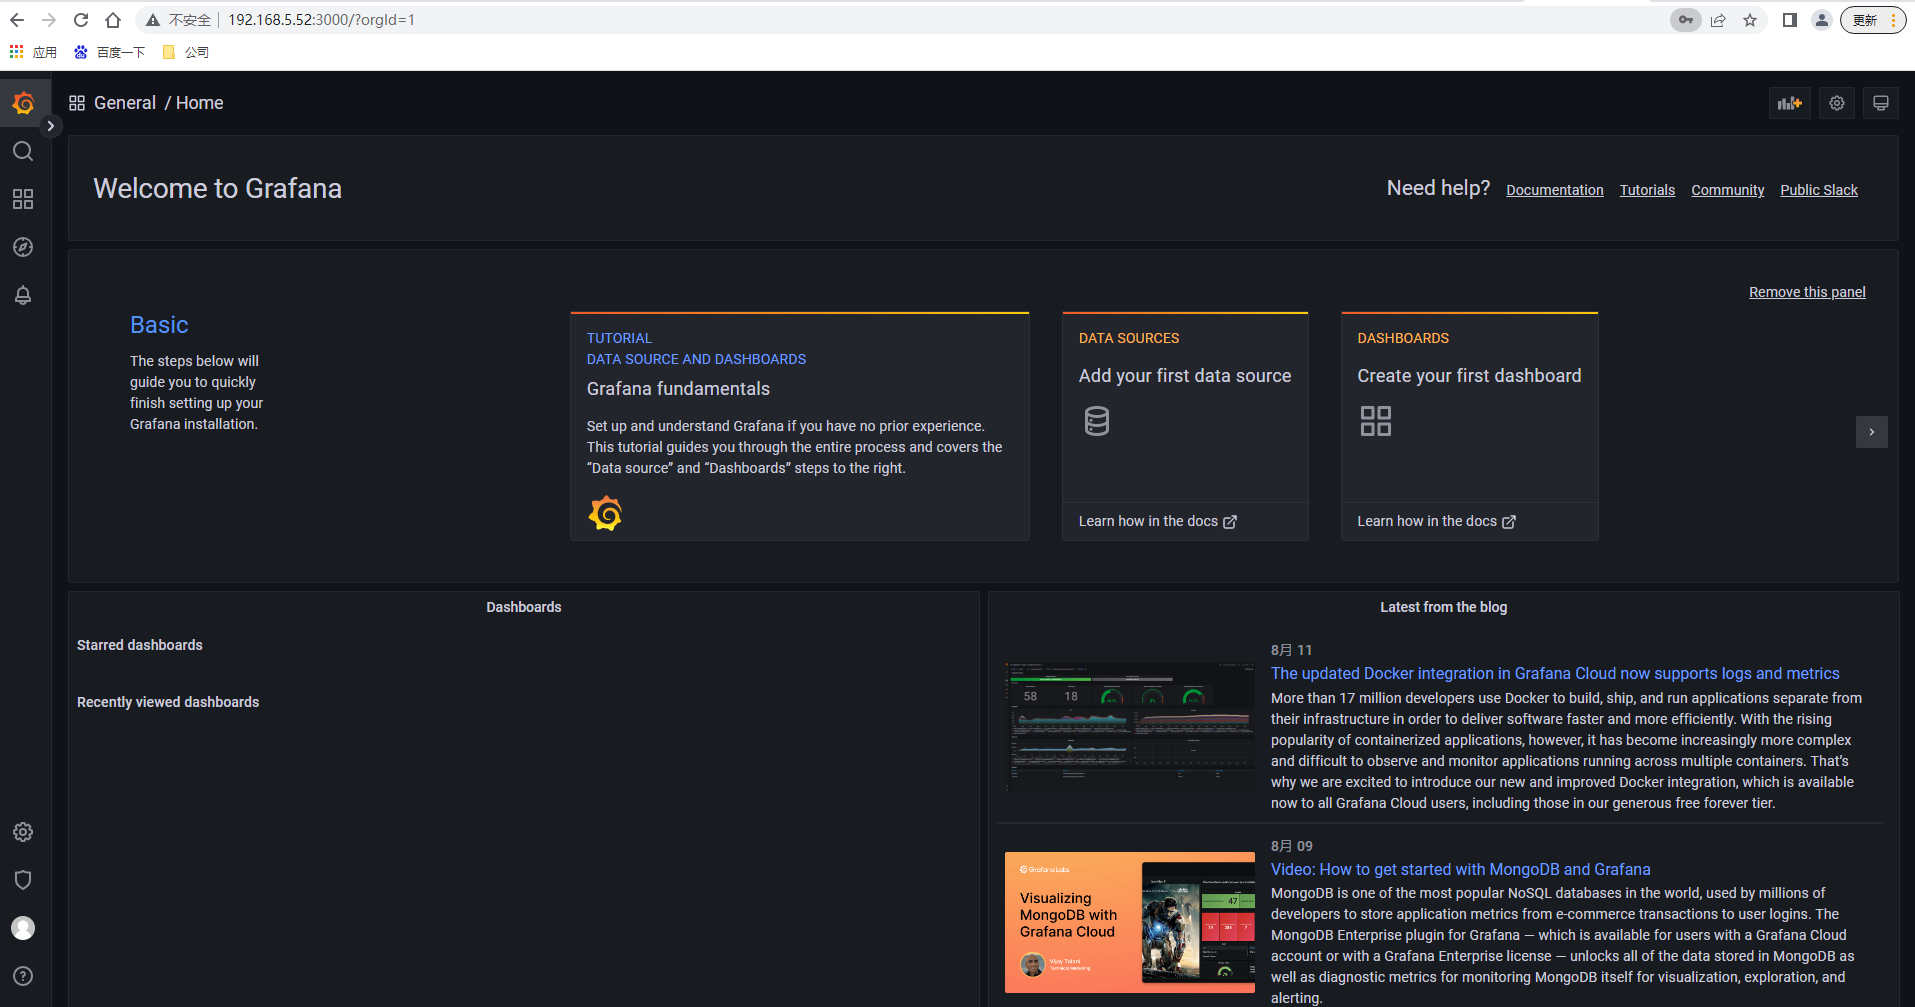
存取grafana預設埠3000,http://192.168.5.52:3000/ 輸入使用者名稱密碼admin/admin ,下一步需要修改密碼後進入主頁面如下
設定資料來源
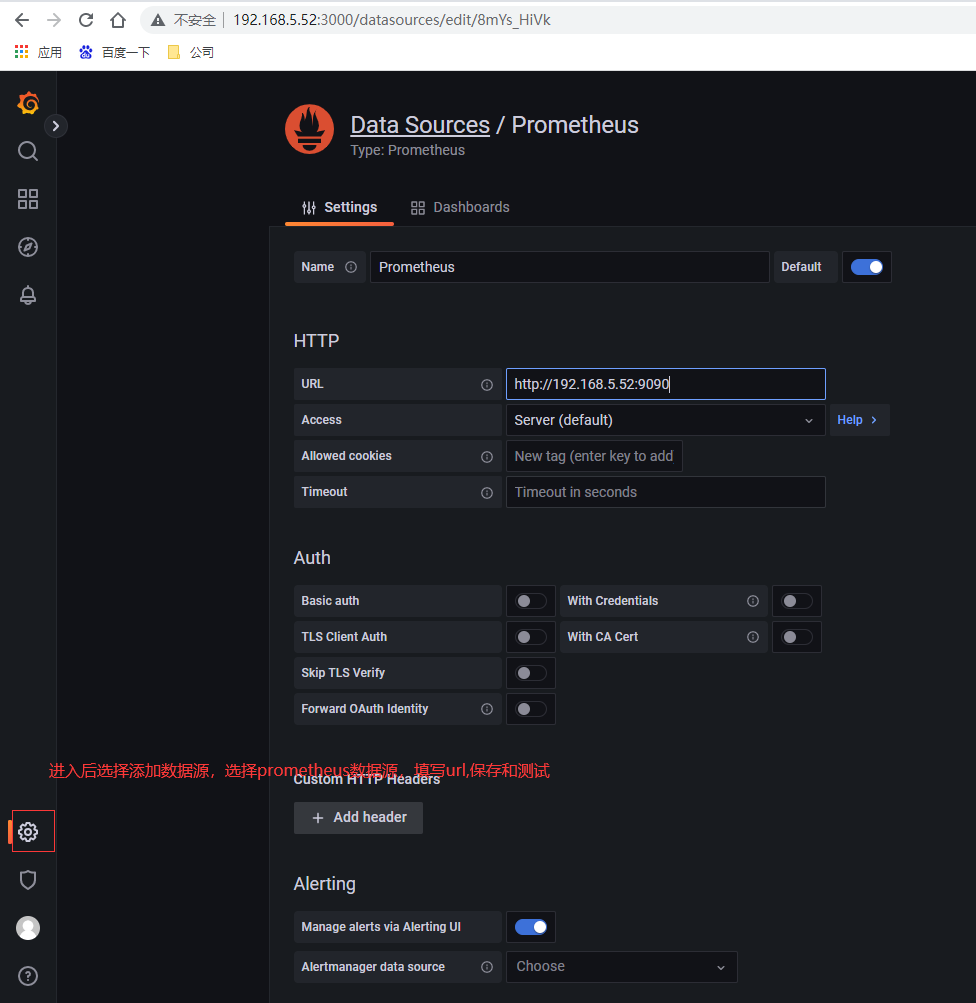
選擇左側面板下面按鈕,然後選擇資料來源,型別為prometheus,輸入url即可
建立測試Graph
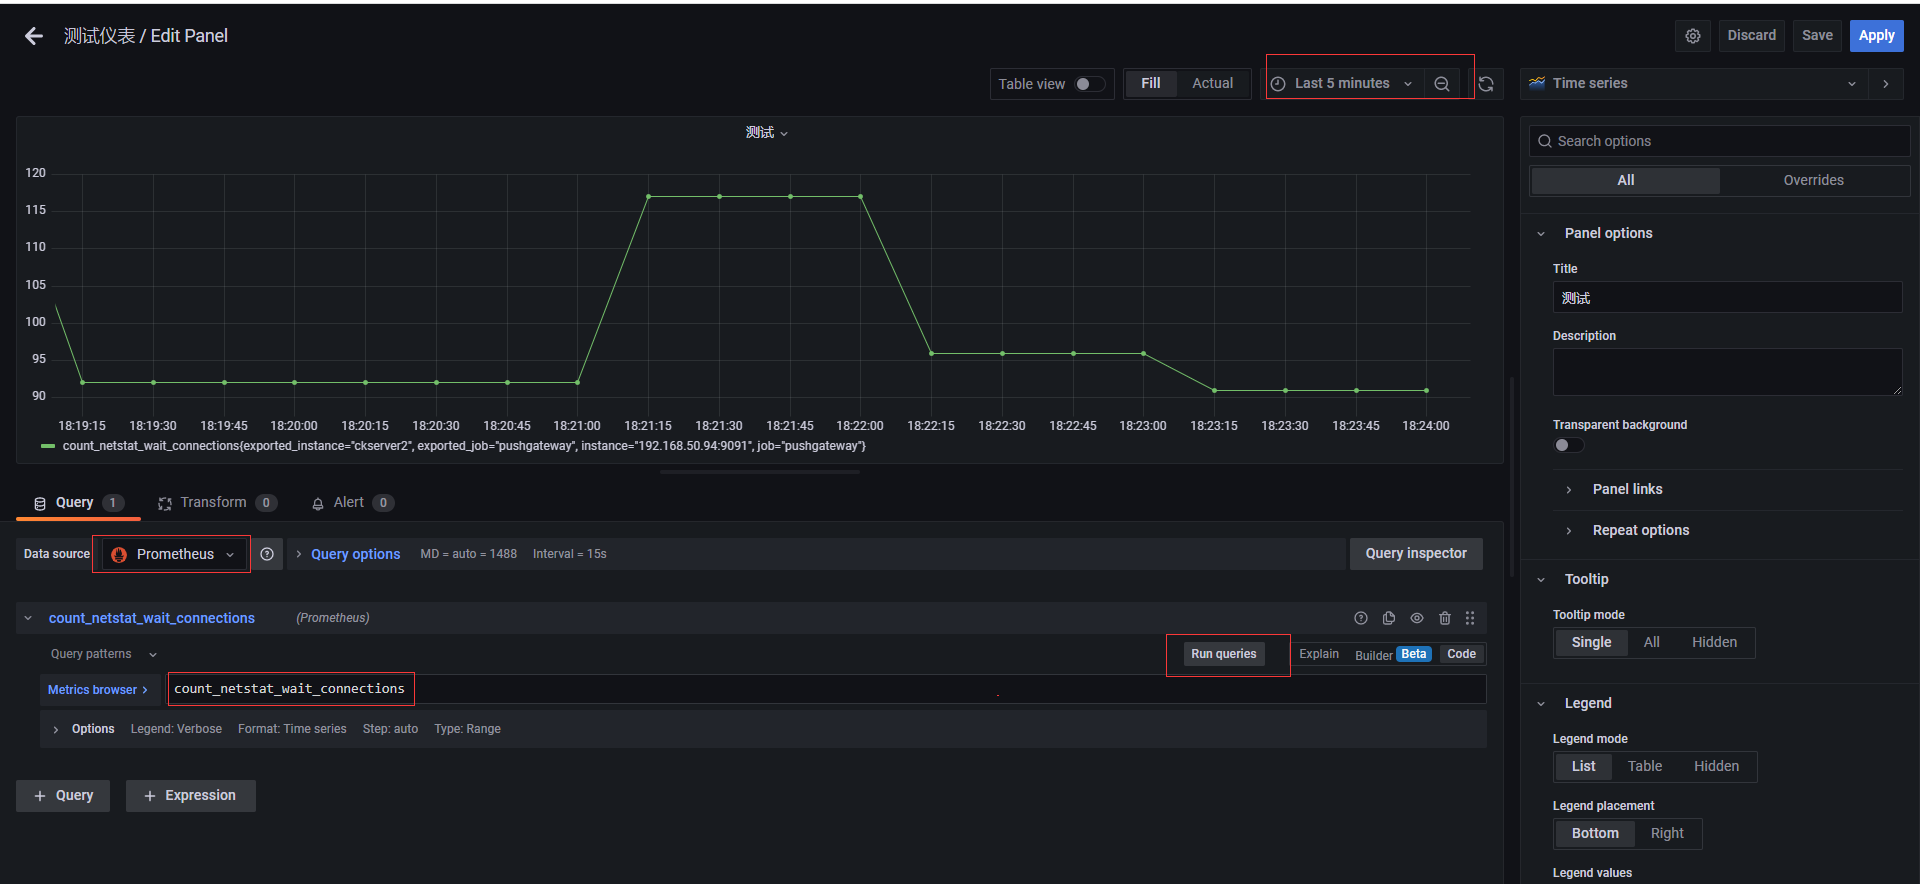
建立一個dashboards,編輯儀表盤,新增圖,選擇資料來源,選擇原始查詢方式,填入前面自定義收集指標count_netstat_wait_connections,執行查詢之後,選擇最近5分鐘的資料,簡單圖就出來了
**本人部落格網站 **IT小神 www.itxiaoshen.com