【人工智慧】【Python】Matplotlib基礎
2022-07-24 18:01:14
Maplotlib
本檔案由萌狼藍天寫於2022年7月24日
目錄
import matplotlib.pyplot as plt
plt.rcParams['font.sans-serif']=['SimHei'] #用來正常顯示中文標籤
plt.rcParams['axes.unicode_minus']=False  # 正常顯示負號
(一)Matplotlib三層結構
- 容器層
- canvas
- figure
- axes
- 輔助顯示層
- 新增x軸、y軸描述,標題等內容
- 影象層
- 繪製什麼影象的宣告
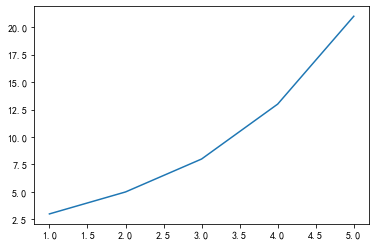
(二)畫布建立、影象繪製、影象顯示
# 建立畫布
plt.figure()
x = [1,2,3,4,5] # x軸上資料
y = [3,5,8,13,21] # y軸上資料
plt.plot(x,y) # 繪製影象
plt.show() # 顯示影象
(三)影象畫布設定、影象儲存
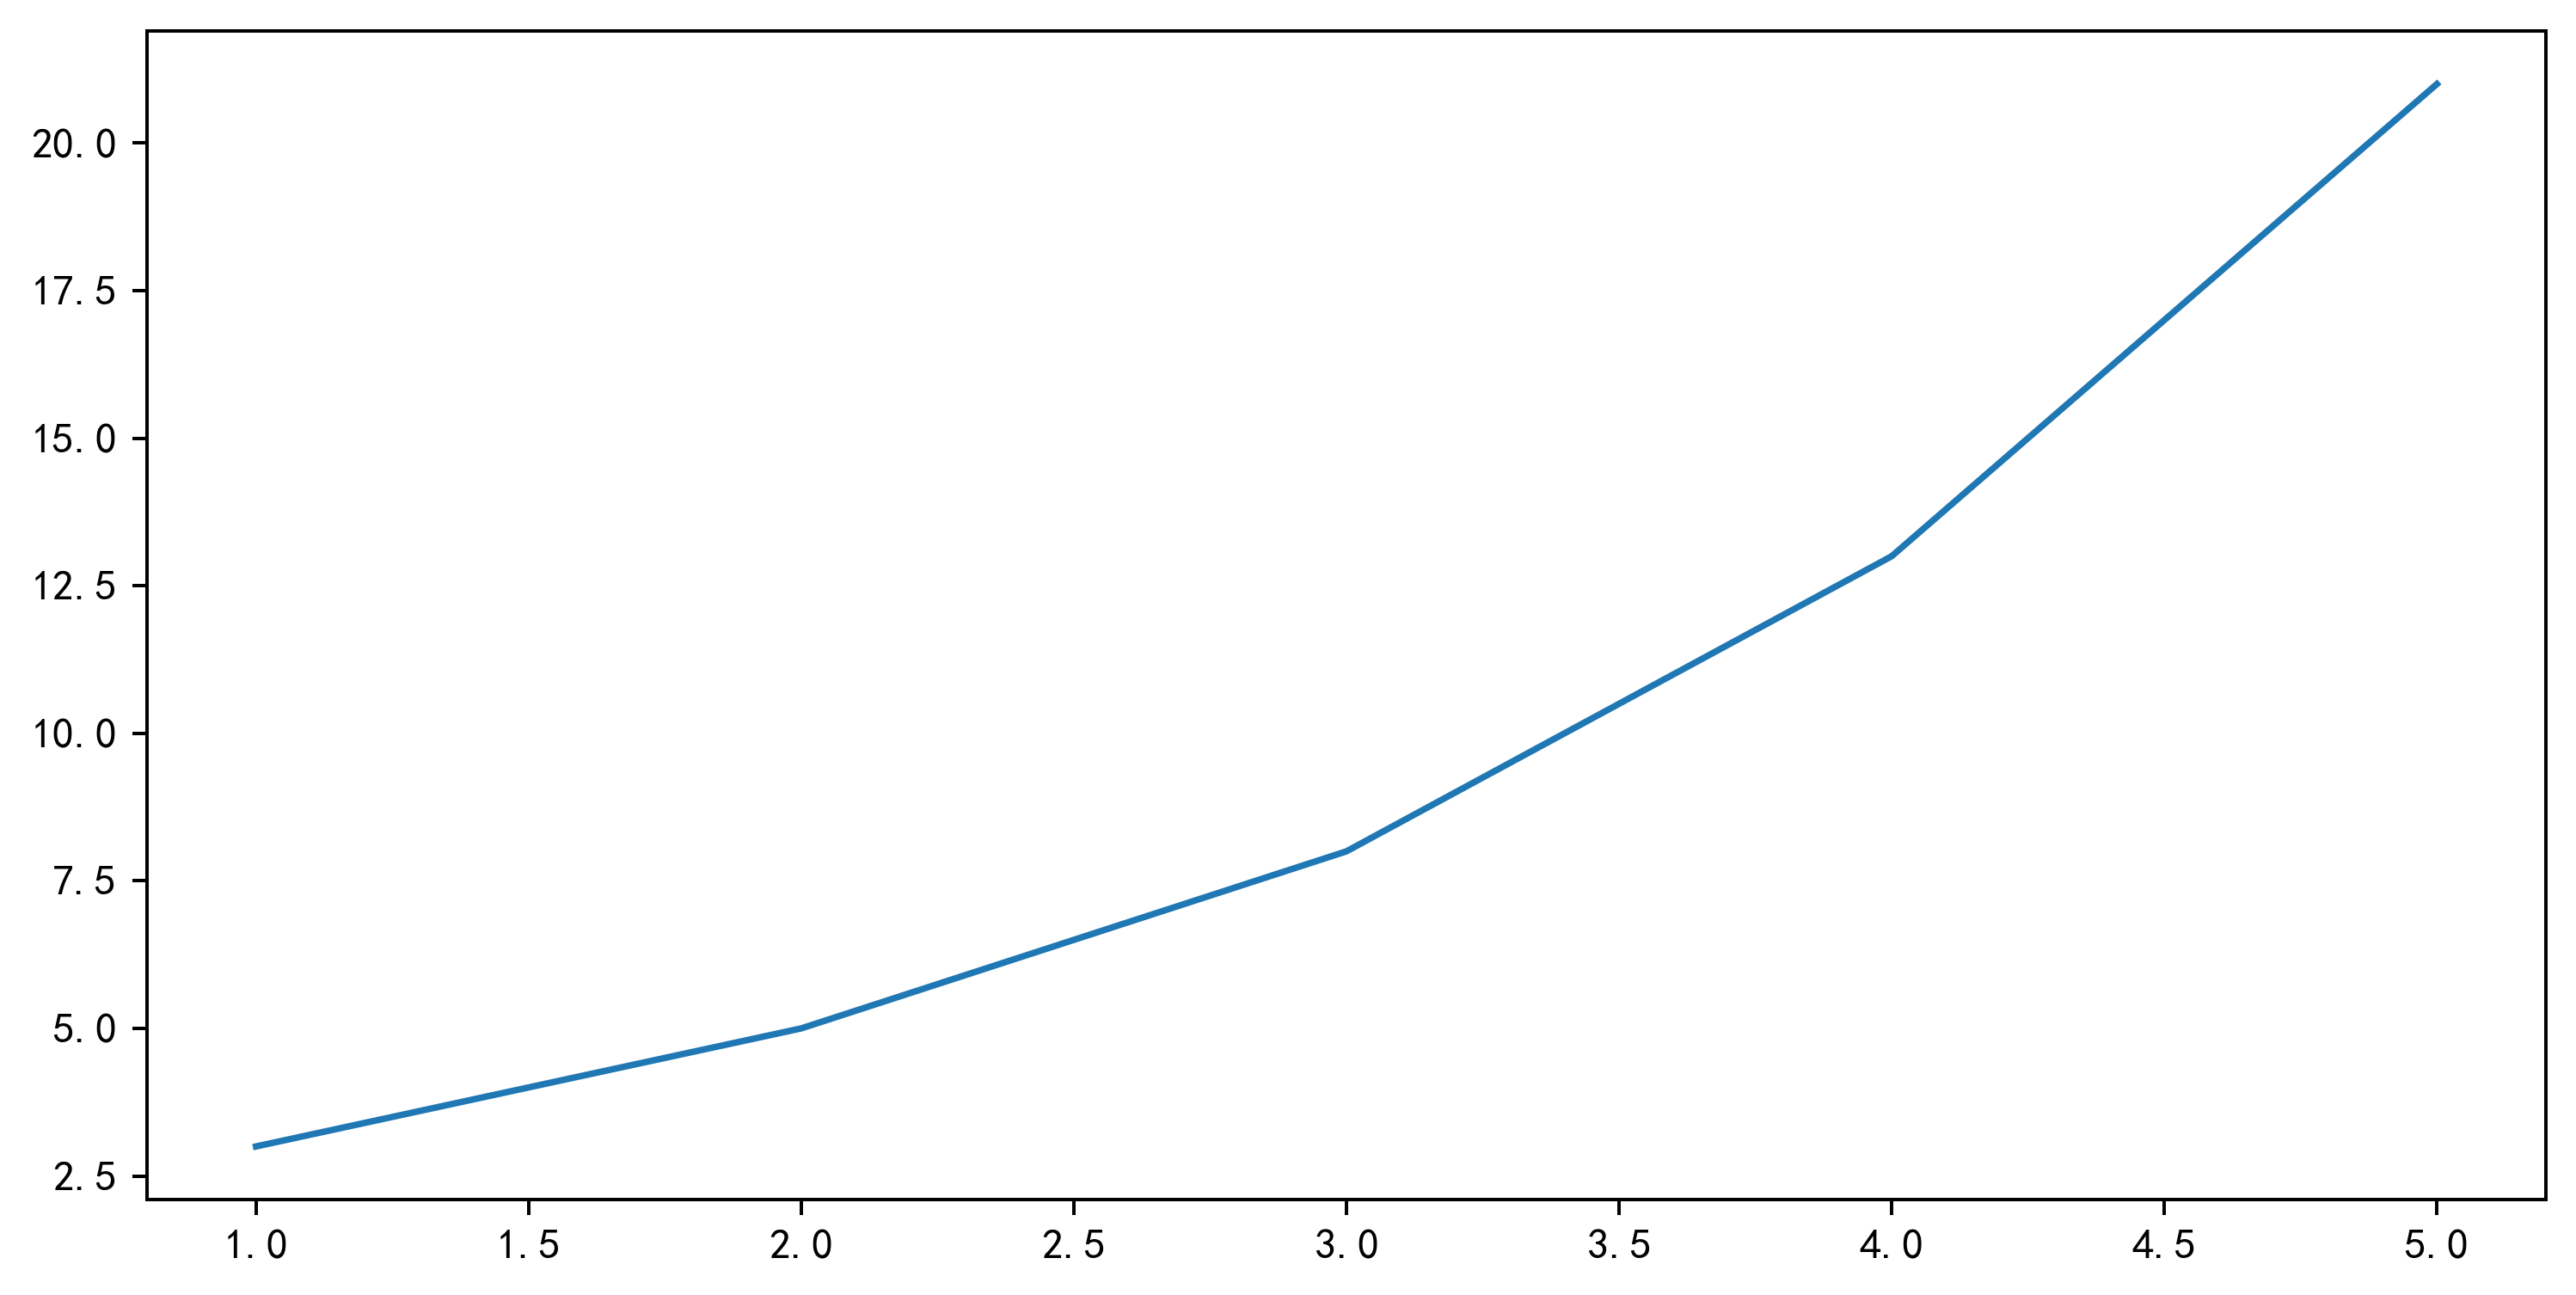
# 建立畫布
plt.figure(figsize=(10,5),dpi=360)
# figsize設定寬高(物理),dpi設定畫素(清晰度)。
# 上述語句 返回的是一個fig物件
# 【注意】plt.show() 會釋放figure資源,如果線上上影象之後儲存圖片將只能儲存空圖片
x = [1,2,3,4,5] # x軸上資料
y = [3,5,8,13,21] # y軸上資料

plt.plot(x,y) # 繪製影象
plt.savefig("auto_create_test01.jpg") # 儲存影象

plt.show() # 顯示影象
import random
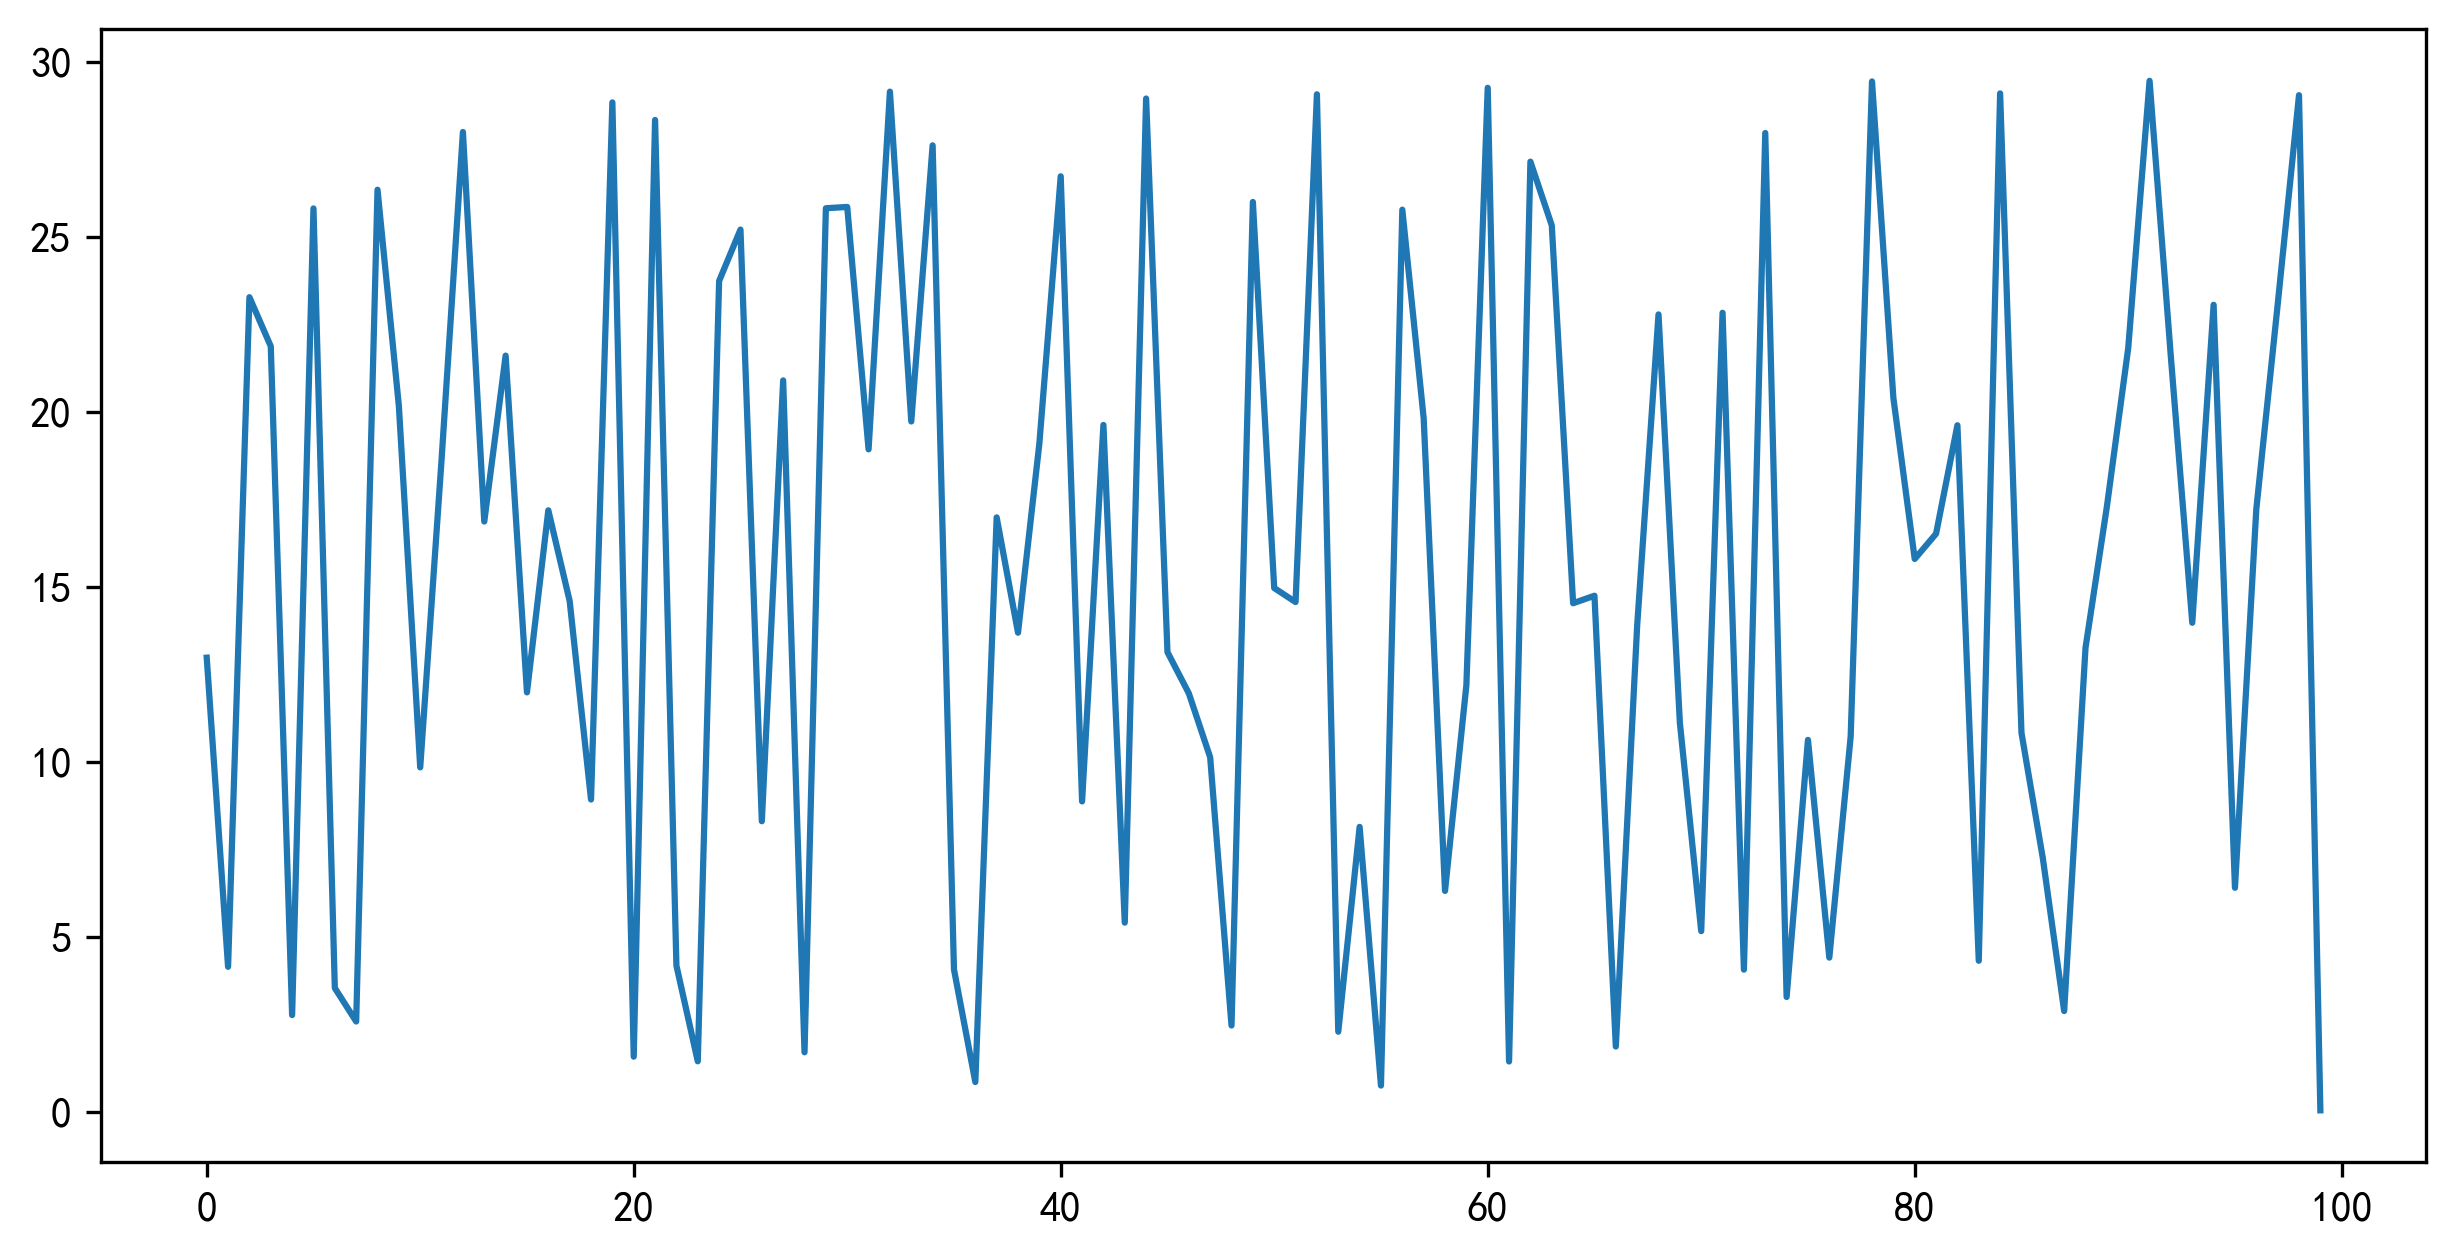
x = range(100)
y_a = [random.uniform(0,30) for i in x]
# 生成數的數量對應x,生成數的值為0-30之間的亂數

print(x)
print("---華麗的分割線---")
print(y_a)
range(0, 100)
---華麗的分割線---
[12.982672509679087, 4.148460810792916, 23.28235249294327, 21.87989699514037, 2.769903367325226, 25.81845792348358, 3.54269402963334, 2.585603726507065, 26.353567263372167, 20.1724515831709, 9.846906537087849, 18.642794021897725, 28.003744340329156, 16.872567782729124, 21.612800689540776, 11.990215915808118, 17.191944072247612, 14.599968428883773, 8.928751599348555, 28.84921690440148, 1.5811419916444414, 28.347437767253062, 4.1844970314337395, 1.4484554776084402, 23.746856993211154, 25.215123023800903, 8.308284357407098, 20.905033782595766, 1.7060361916369626, 25.824999733060757, 25.861418590294413, 18.934895151240344, 29.156472327174725, 19.73204522971468, 27.62189040636267, 4.0745889532346355, 0.8561484814978759, 16.990698526758948, 13.695538355532968, 19.102876219033302, 26.73750193106295, 8.874796595298546, 19.63252230758577, 5.410863374583021, 28.959501437890072, 13.141025987347465, 11.963738613483583, 10.134532811707164, 2.4713136683034986, 26.003968284802426, 14.971877506465844, 14.571620590922555, 29.08039067376321, 2.2940372824311894, 8.146485905161393, 0.7551511667468636, 25.783877538176437, 19.827089802343014, 6.316807614490154, 12.191817760896198, 29.265434441425686, 1.4430630147755286, 27.15559634706954, 25.33537321637355, 14.537826820603485, 14.752792676788385, 1.8704608188174754, 13.895073232049324, 22.79035528366605, 11.12232898307558, 5.16784304566163, 22.837175426537577, 4.0677013250654435, 27.975154486709634, 3.286664382643265, 10.632525108000943, 4.411311190562859, 10.723165062794324, 29.44814886086931, 20.408896064347594, 15.803205938537028, 16.523604028883916, 19.623136101583274, 4.321189078434246, 29.106159249131583, 10.836444462865161, 7.254473087449349, 2.884588234408815, 13.263596148346446, 17.293710076942403, 21.826173895085446, 29.465860746443976, 21.558510008254462, 13.979606990999239, 23.065135048263528, 6.406772645073375, 17.224958179811374, 23.067953124213787, 29.055332612173245, 0.046758792875690736]
plt.figure(figsize=(10,5),dpi=300)# 建立畫布
plt.plot(x,y_a) # 繪畫
plt.show() # 顯示
(四)自定義x、y軸的刻度
- plt.xticks(x,**kwargs) # x 表示要刻度的值
- plt.yticks(y,**kwargs) # y 表示要刻度的值
x = range(100)
y_a = [random.uniform(0,50) for i in x]

plt.figure(figsize=(25,5),dpi=300)# 建立畫布
plt.plot(x,y_a) # 繪畫

# 構造x軸刻度標籤
x_ticks_label = ["零點{}分".format(i) for i in x]
# 構造y軸刻度
y_ticks = range(60)
# 修改x、y軸刻度顯示
plt.xticks(x[::5],x_ticks_label[::5])
plt.yticks(y_ticks[::5])
# ::5 意味著 從頭到尾 每間隔5取
#【注意】第一個引數必須是數位,如果不是數位需要進行值的替換

plt.show()

(五)新增網格顯示
x = range(100)
y_a = [random.uniform(0,50) for i in x]

plt.figure(figsize=(25,5),dpi=300)# 建立畫布
plt.plot(x,y_a) # 繪畫

# 構造x軸刻度標籤
x_ticks_label = ["零點{}分".format(i) for i in x]
# 構造y軸刻度
y_ticks = range(60)
# 修改x、y軸刻度顯示
plt.xticks(x[::5],x_ticks_label[::5])
plt.yticks(y_ticks[::5])
# ::5 意味著 從頭到尾 每間隔5取
#【注意】第一個引數必須是數位,如果不是數位需要進行值的替換

plt.grid(True,linestyle="--",alpha=0.5) # 新增網格
# 第一個引數(boolean) 是否新增
# 第二個引數(linestyle) 曲線還是直線
# 第三個引數 (alpha)透明度

plt.show()

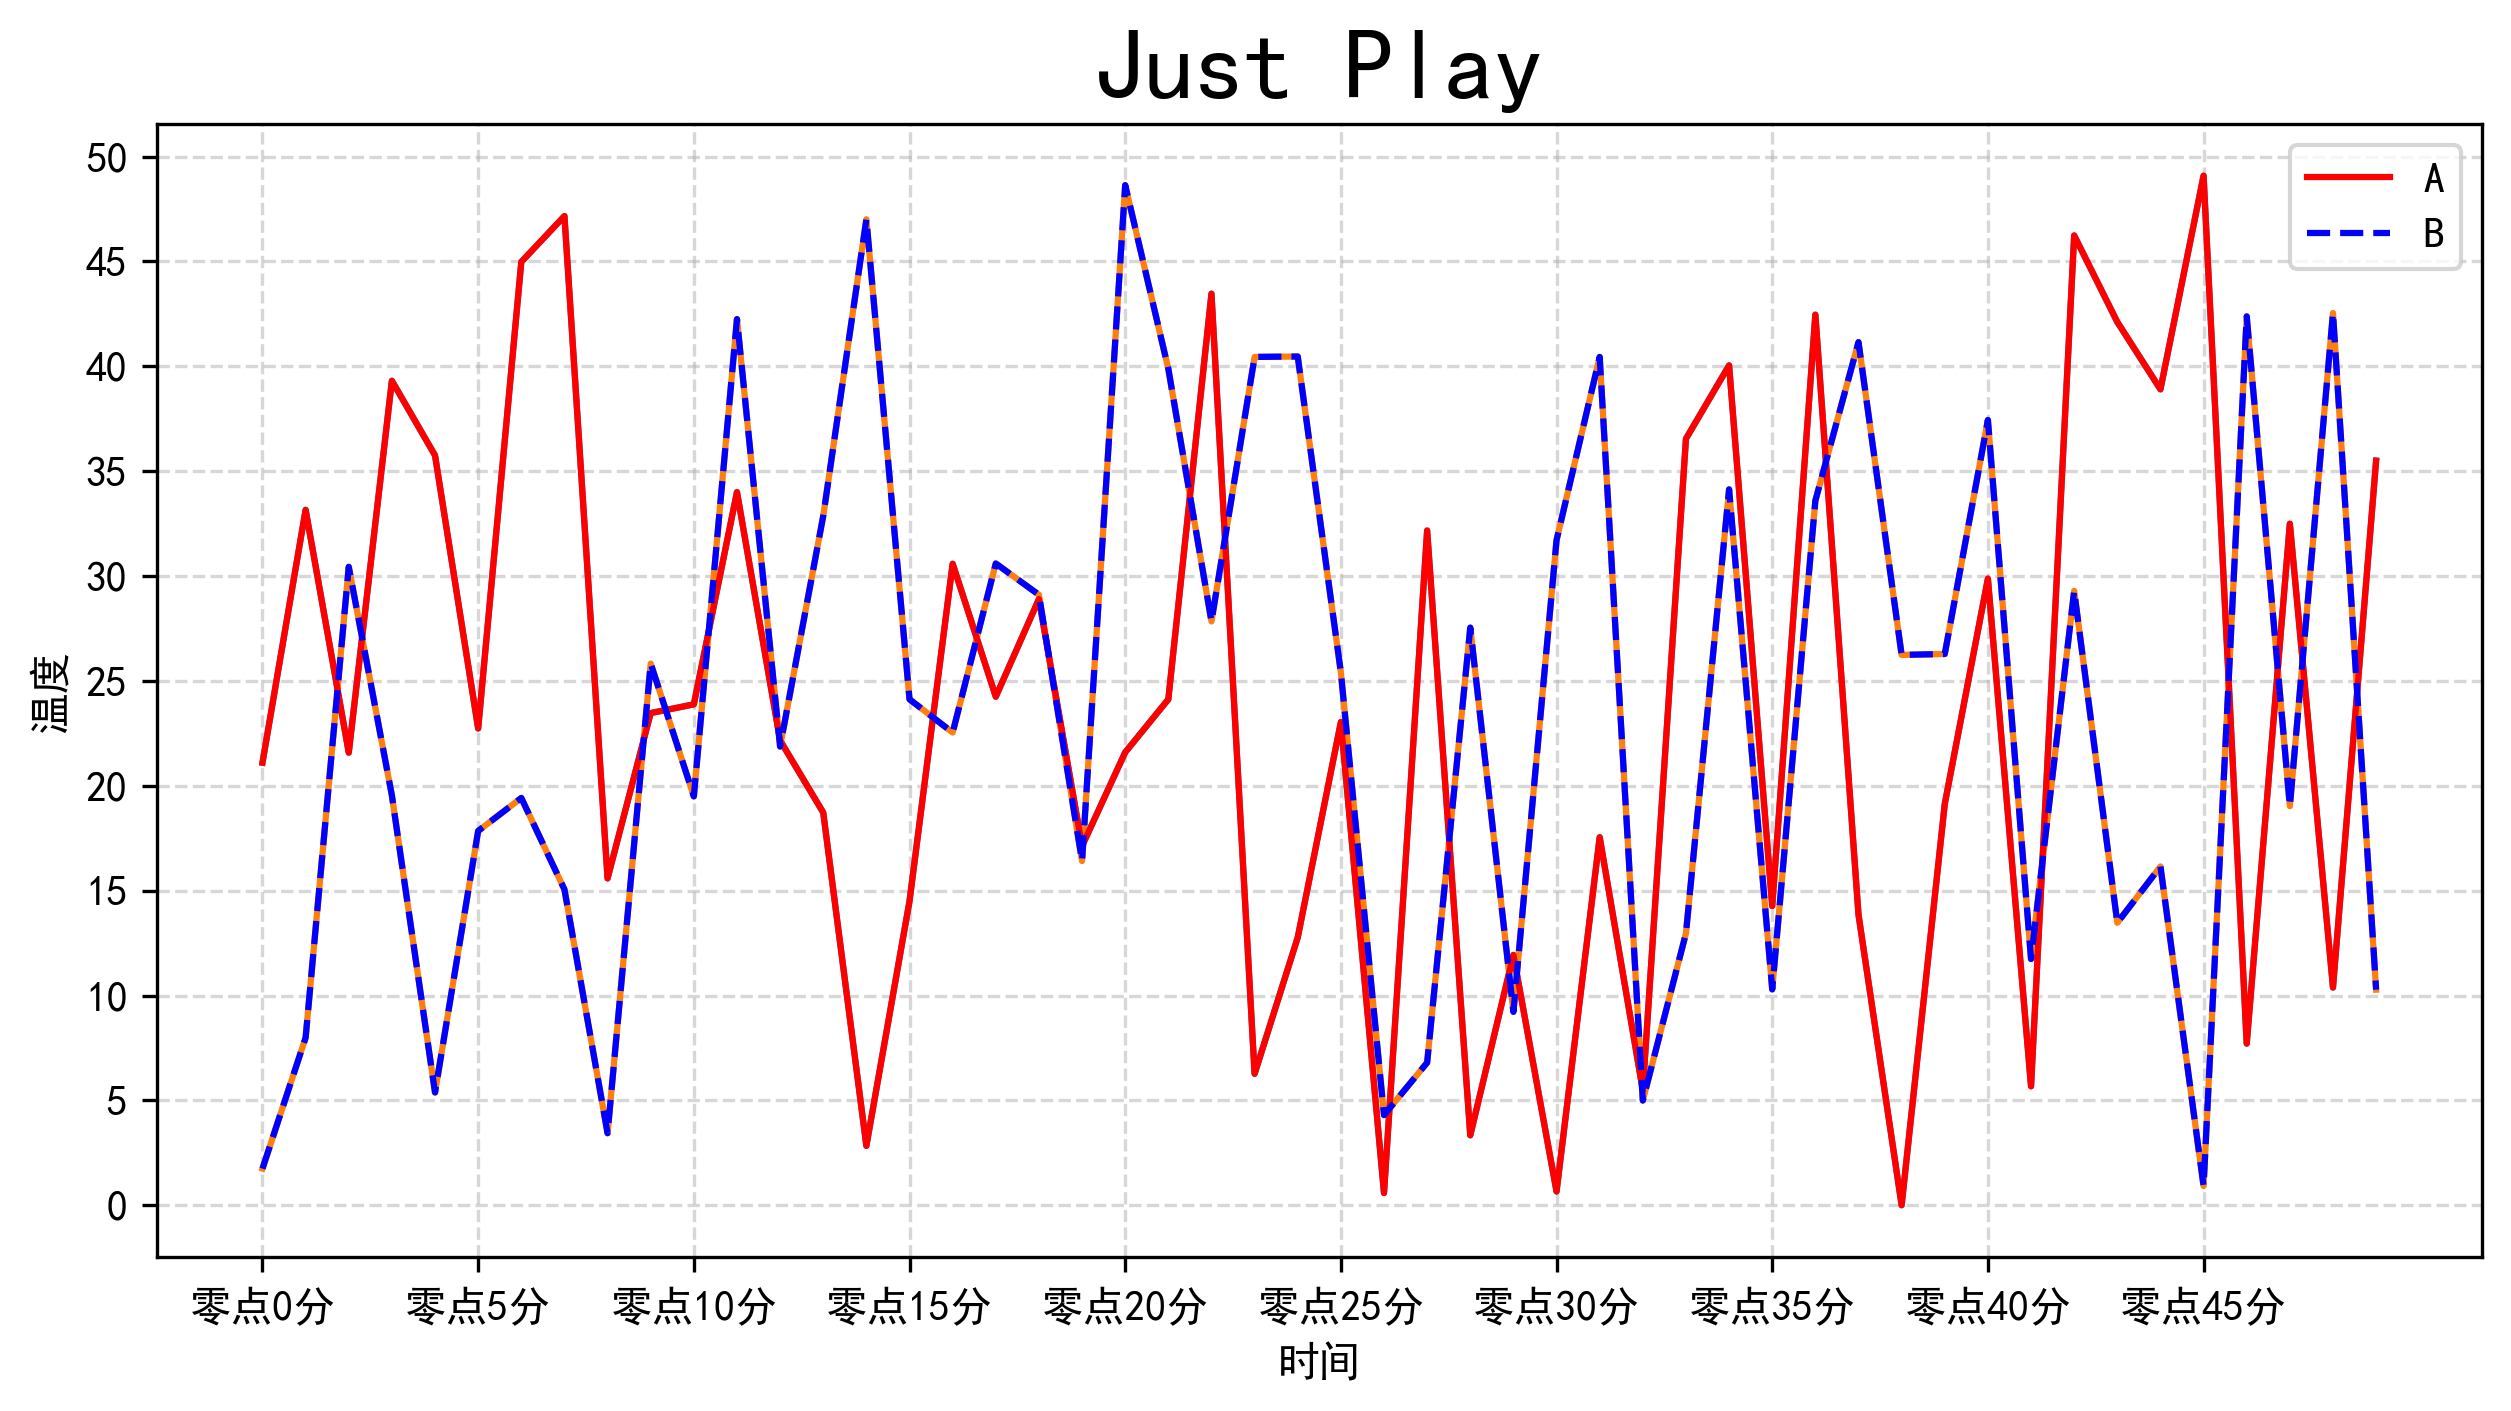
(六)新增描述資訊、一圖多線、顯示圖例
x = range(50)
y_a = [random.uniform(0,50) for i in x]
y_b = [random.uniform(0,50) for i in x]
plt.figure(figsize=(10,5),dpi=300)# 建立畫布
plt.plot(x,y_a) # 繪畫
plt.plot(x,y_b) # 繪畫
x_ticks_label = ["零點{}分".format(i) for i in x]
y_ticks = range(60)
plt.xticks(x[::5],x_ticks_label[::5])
plt.yticks(y_ticks[::5])
plt.grid(True,linestyle="--",alpha=0.5) # 新增網格


# 新增描述
plt.title("Just Play",fontsize=24)
plt.xlabel("時間")
plt.ylabel("溫度")

# 顯示圖例

plt.plot(x,y_a,color="r",linestyle="-",label="A") # 繪畫
plt.plot(x,y_b,color="b",linestyle="--",label="B") # 繪畫
plt.legend(loc="upper right")# 顯示圖例必須在繪製時設定好
plt.show()
圖例圖形風格設定參考表
| 顏色字元 | 對應顏色 |
|---|---|
| r | 紅色 |
| g | 綠色 |
| b | 藍色 |
| w | 白色 |
| c | 青色 |
| m | 洋紅色 |
| y | 黃色 |
| k | 黑色 |
| 風格字元 | 對應風格 |
|---|---|
| - | 實線 |
| -- | 虛線 |
| -. | 點劃線 |
| : | 點虛線 |
| '' | 留空、空格 |
(七)多座標系繪製
x = range(50)
y_a = [random.uniform(0,50) for i in x]
y_b = [random.uniform(0,50) for i in x]
# plt.figure(figsize=(10,5),dpi=300)# 建立畫布
fig,axes = plt.subplots(nrows=1,ncols=2,figsize=(20,5),dpi=300)


x_ticks_label = ["零點{}分".format(i) for i in x]
y_ticks = range(60)

# plt.xticks(x[::5],x_ticks_label[::5])
# plt.yticks(y_ticks[::5])
axes[0].set_xticks(x[::5])
axes[0].set_yticks(y_ticks[::5])

axes[1].set_xticks(x[::5])
axes[1].set_yticks(y_ticks[::5])
axes[1].set_xticklabels(x_ticks_label[::5])

# 新增描述
# plt.title("Just Play",fontsize=24)
axes[0].set_title("Just Play A",fontsize=24)
axes[1].set_title("Just Play B",fontsize=24)
# plt.xlabel("時間")
# plt.ylabel("溫度")
axes[0].set_ylabel("攝氏度")
axes[1].set_ylabel("華氏度")
axes[0].set_xlabel("21日資料")
axes[1].set_xlabel("22日資料")


# 顯示圖例

# plt.plot(x,y_a,color="r",linestyle="-",label="A") # 繪畫
# plt.plot(x,y_b,color="b",linestyle="--",label="B") # 繪畫
axes[0].plot(x,y_a,color="r",linestyle="-",label="A")
axes[1].plot(x,y_b,color="b",linestyle="--",label="B")

# plt.legend(loc="upper right")# 顯示圖例必須在繪製時設定好
axes[0].legend(loc="upper right")# 顯示圖例必須在繪製時設定好
axes[1].legend(loc="upper right")# 顯示圖例必須在繪製時設定好

# 新增網格
# plt.grid(True,linestyle="--",alpha=0.5) # 新增網格
axes[0].grid(True,linestyle="--",alpha=0.5)
axes[1].grid(True,linestyle="-.",alpha=1)
plt.show()

(八)常見圖形繪製
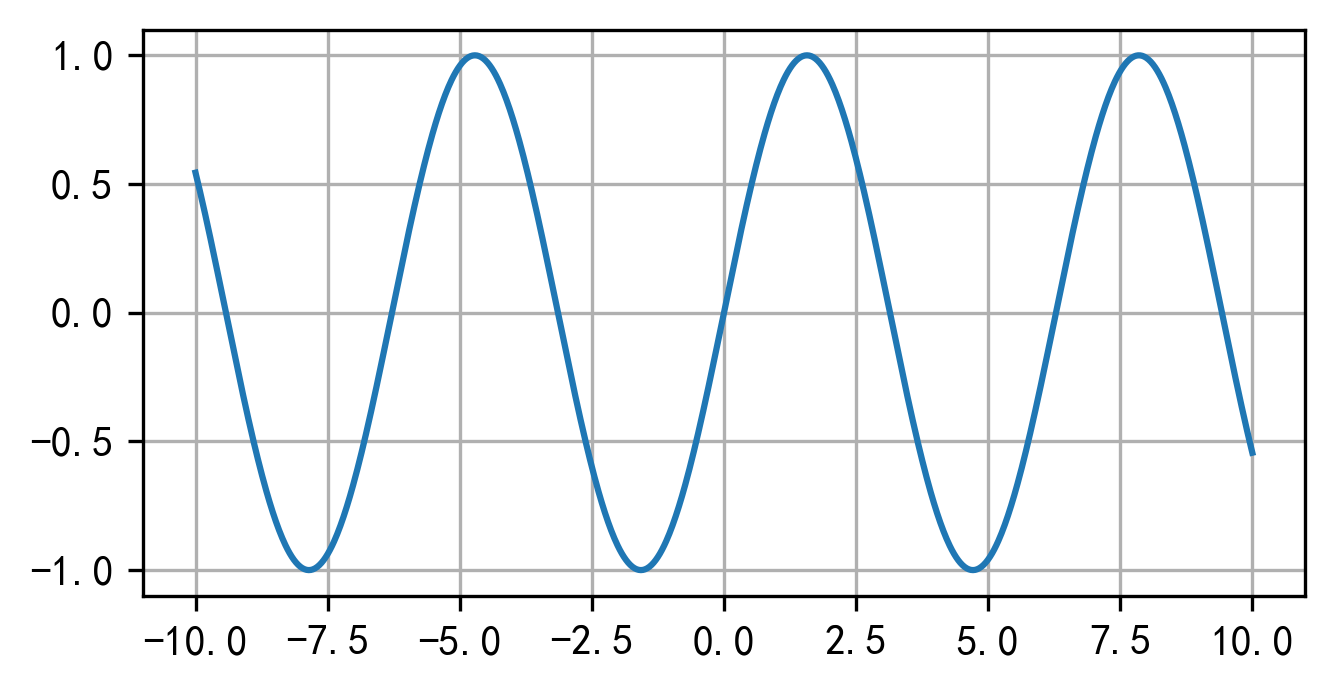
1.繪製數學函數影象
import numpy as np
# 準備資料
x = np.linspace(-10,10,1000) # 從-10到10 生成1000個資料(資料越多,線條越順暢自然)
y = np.sin(x)

# 建立畫布
plt.figure(figsize=(5,2.5),dpi=300)
# 繪製函數影象
plt.plot(x,y)
# 新增網格顯示
plt.grid()
# 顯示影象
plt.show()
2.散點圖
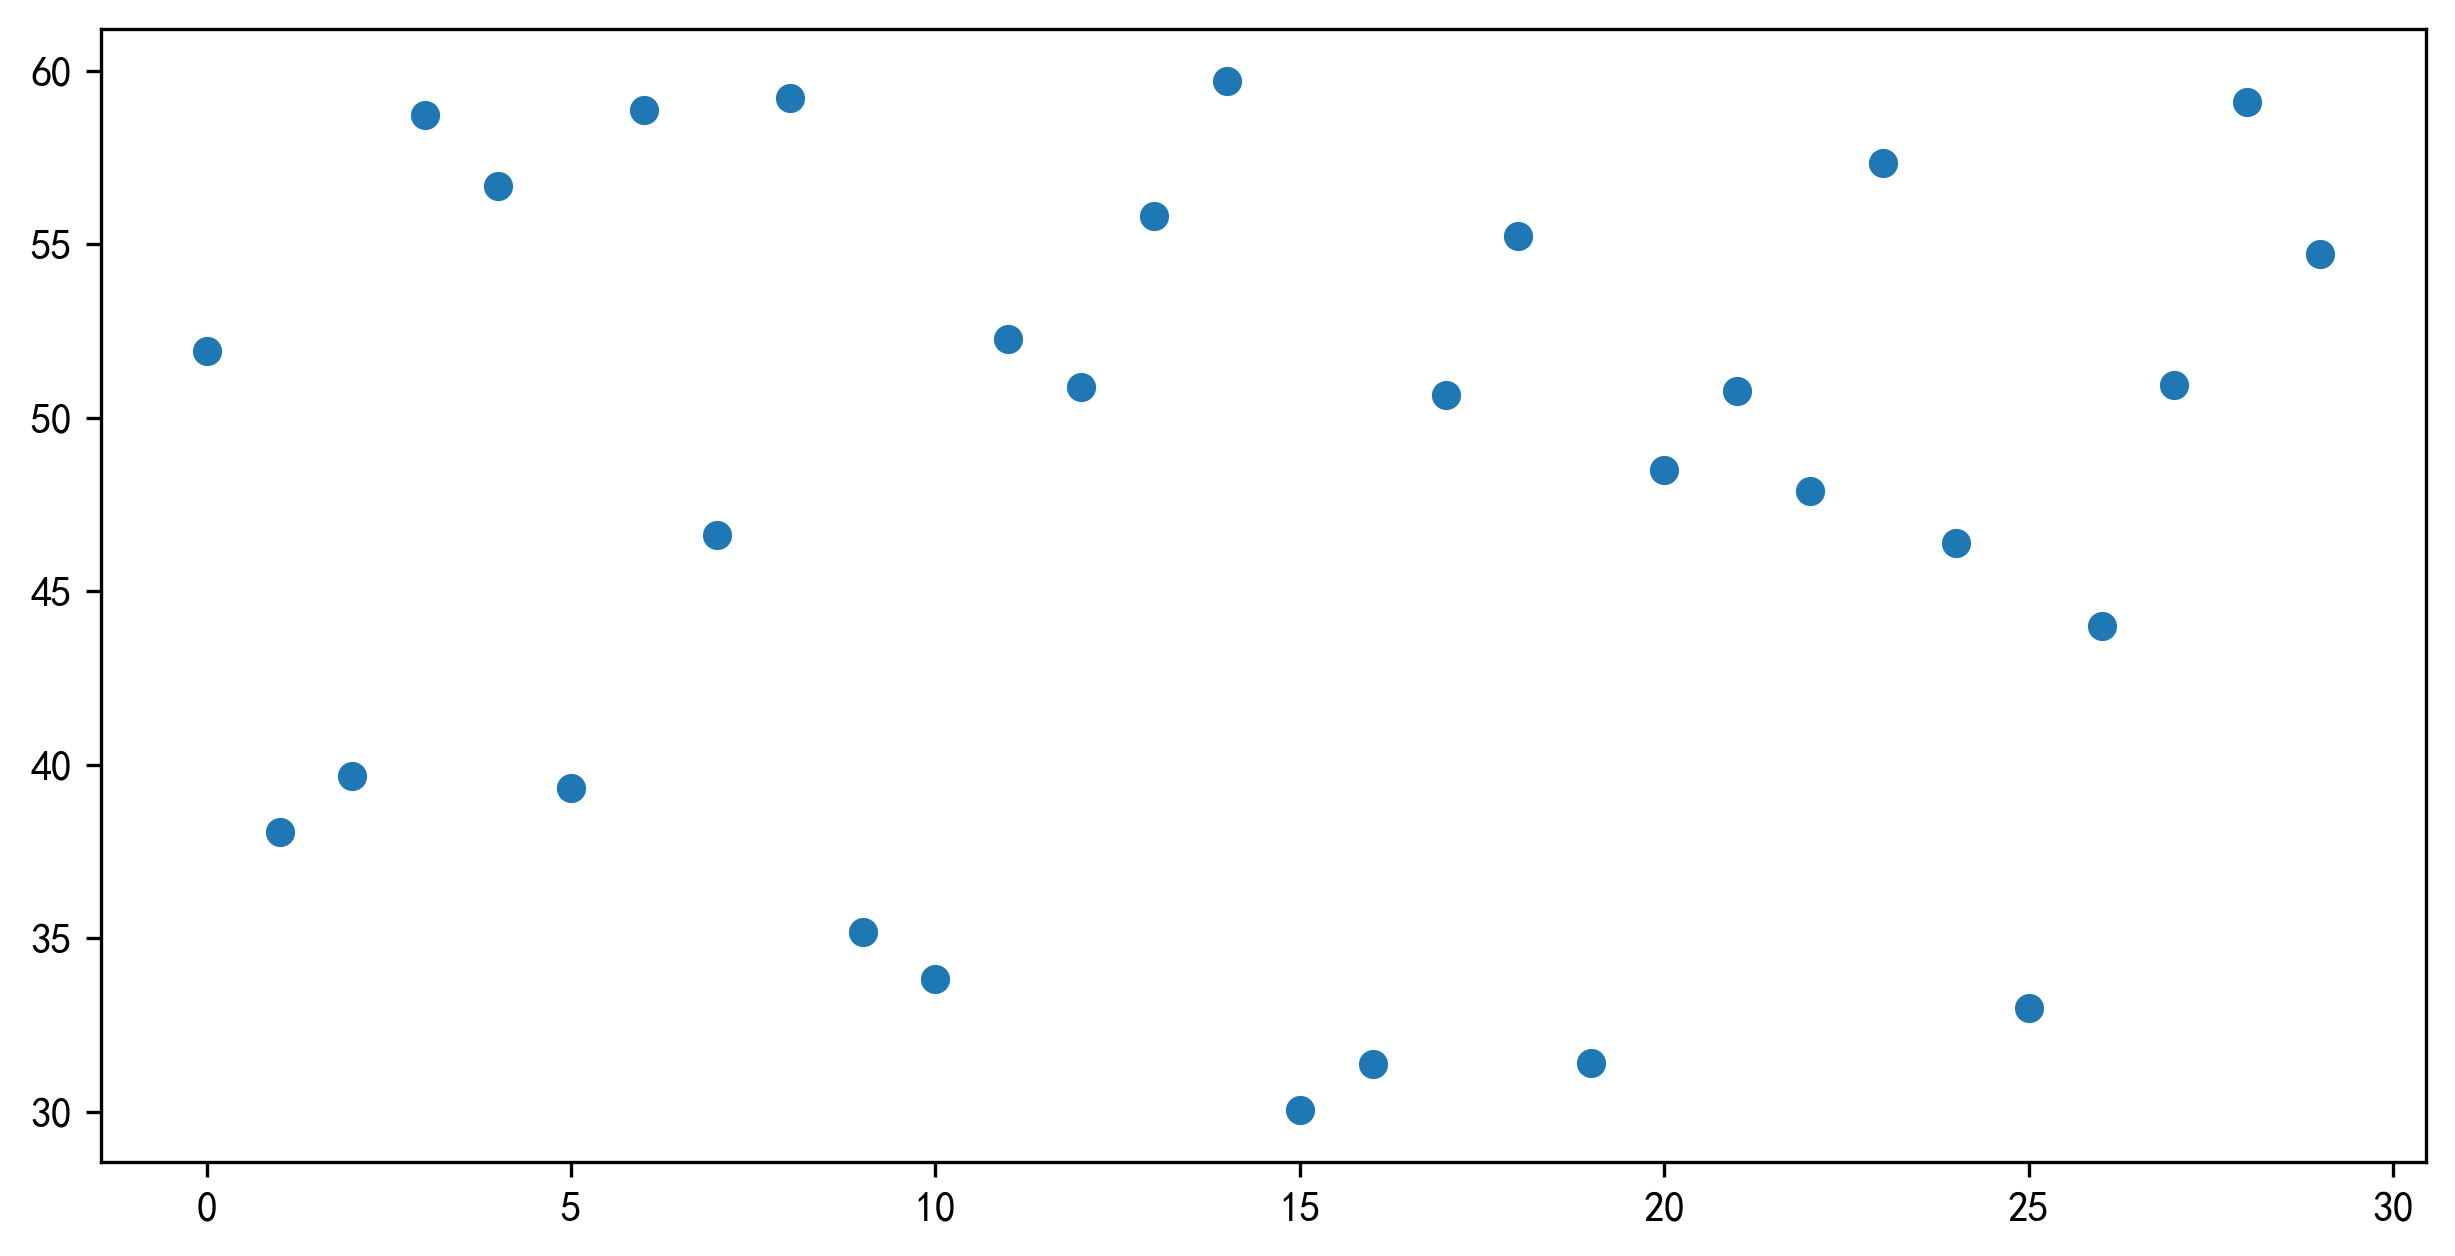
# 資料準備
import random
x = range(30)
y = [random.uniform(30,60) for i in x]
# 建立畫布
plt.figure(figsize=(10,5),dpi=300)
# 影象繪製
plt.scatter(x,y)
# 影象顯示
plt.show()
3.柱狀圖
data_name = ['我是路人甲','山哥之王','山雞之王','山崖傳說','神祕姥爺','嘎腰子傳說','嚶嗚','我直呼好傢伙',"烏拉","一拳一個"]
data_love = [1684,8664,8469,6468,5381,6584,1466,6458,4476,6584]
x = range(len(data_name))
y = data_love

plt.figure(figsize=(15,3),dpi=100)
plt.bar(x,y,width=0.5,color=["r","g","b","m","y","c","k"],align="center") # 對齊方式有edge和center兩種

plt.xticks(x,data_name,fontsize=12)
plt.show()

4.直方圖
x =  np.random.normal(50,10,1000) # (均值,標準差,個數)
y = range(50)

plt.figure(figsize=(15,3),dpi=100)
plt.hist(x,bins=50,density=True, color='g', alpha=1)
plt.show()

5.餅狀圖
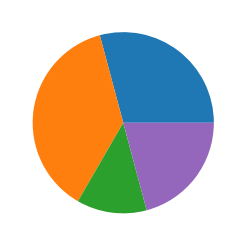
x =  [random.randint(0,10) for i in range(5)] # 隨機生成5個數,每個數的值在0-9之間
plt.figure(figsize=(15,3),dpi=100)
plt.pie(x) # x:數量,會根據數量自動計算百分比  labels:每部分的名城 autopct:佔比顯示指定 %1.2f%% colors:每部分的顏色
plt.show()
版 權 聲 明