vue專案怎麼優雅的封裝echarts?方法介紹

場景
- 1、Echarts使用時,都需要寫一堆的option,如果每個圖表都要寫一個,一個檔案裡面的程式碼量是很大的
- 2、不方便複用
需求
- 1、方便複用
- 2、展示類的圖表,資料與業務、樣式分離,只傳資料就行
- 3、專案裡需要用到的圖表會有多個,實現少程式碼自動化匯入,不需要一個個import
- 4、本人圖表用在大屏資料視覺化的情況比較多,採用的是等比縮放的方式,所以圖表也能根據介面縮放自動縮放,不需要手動呼叫。【相關推薦:】
- 5、圖表可設定
程式碼總覽
涉及的檔案如下(具體參考程式碼):
|-- src
    |-- components
        |-- chart
            |-- index.vue    // 圖表單檔案元件,供介面呼叫
            |-- index.js    // 實現自動化匯入options裡的圖表option
            |-- options    // 存放各種圖表的option
                |-- bar    // 隨便一例子
                    |-- index.js
    |-- views
        |-- chartTest    // 範例所在
            |-- index.vue
            |-- index.scss
            |-- index.js
|-- main.js    // 全域性引入echarts圖表
實現
components--chart--index.vue
這裡定義了一個名為ChartView 的元件,開放了4個可設定的屬性:寬度width,高度height, 是否自動調整大小autoResize(預設是), 圖表的設定chartOption。
這裡預設用Canvas 渲染圖表了,也可以用SVG的,自選吧
具體程式碼如下
<template>
  <div class="chart">
    <div ref="chart" :style="{ height: height, width: width }" />
  </div>
</template>
<script>

// 引入 echarts 核心模組,核心模組提供了 echarts 使用必須要的介面。
import * as echarts from 'echarts/core'
// 引入柱狀圖圖表,圖表字尾都為 Chart
import {
  BarChart
} from 'echarts/charts'
// 引入提示框,標題,直角座標系元件,元件字尾都為 Component
import {
  TitleComponent,
  TooltipComponent,
  GridComponent
} from 'echarts/components'
// 引入 Canvas 渲染器,注意引入 CanvasRenderer 或者 SVGRenderer 是必須的一步
import {
  CanvasRenderer
} from 'echarts/renderers'

// 註冊必須的元件
echarts.use(
  [TitleComponent, TooltipComponent, GridComponent, BarChart, CanvasRenderer]
)

export default {
  name: 'ChartView',
  props: {
    width: {
      type: String,
      default: '100%'
    },
    height: {
      type: String,
      default: '350px'
    },
    autoResize: {
      type: Boolean,
      default: true
    },
    chartOption: {
      type: Object,
      required: true
    },
    type: {
      type: String,
      default: 'canvas'
    }
  },
  data() {
    return {
      chart: null
    }
  },
  watch: {
    chartOption: {
      deep: true,
      handler(newVal) {
        this.setOptions(newVal)
      }
    }
  },
  mounted() {
    this.initChart()
    if (this.autoResize) {
      window.addEventListener('resize', this.resizeHandler)
    }
  },
  beforeDestroy() {
    if (!this.chart) {
      return
    }
    if (this.autoResize) {
      window.removeEventListener('resize', this.resizeHandler)
    }
    this.chart.dispose()
    this.chart = null
  },
  methods: {
    resizeHandler() {
      this.chart.resize()
    },
    initChart() {
      this.chart = echarts.init(this.$refs.chart, '', {
        renderer: this.type
      })
      this.chart.setOption(this.chartOption)
      this.chart.on('click', this.handleClick)
    },
    handleClick(params) {
      this.$emit('click', params)
    },
    setOptions(option) {
      this.clearChart()
      this.resizeHandler()
      if (this.chart) {
        this.chart.setOption(option)
      }
    },
    refresh() {
      this.setOptions(this.chartOption)
    },
    clearChart() {
      this.chart && this.chart.clear()
    }
  }
}
</script>
components--chart--index.js
這裡主要利用require.context,把options裡面定義的圖表遍歷匯入,這樣就不需要在程式碼裡一個個import了,特別是圖表多的時候。
const modulesFiles = require.context('./options', true, /index.js$/)
let modules = {}
modulesFiles.keys().forEach(item => {
  modules = Object.assign({}, modules, modulesFiles(item).default)
})
export default modules
components--chart--options
這裡展示下如何封裝自己想要的圖表
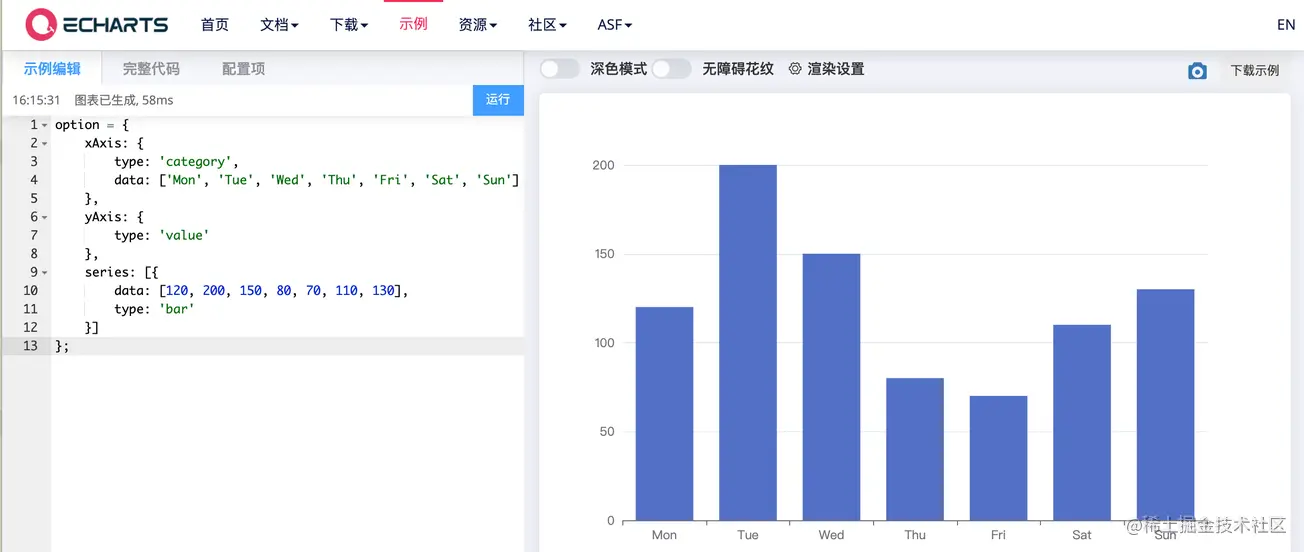
在Echarts官方範例(https://echarts.apache.org/examples/zh/index.html)上隨便選了個範例

在options下新建一個bar目錄,bar目錄下新建一個index.js檔案。(個人習慣而已,喜歡每個圖表都獨立資料夾存放。不喜歡這種方式的,可以不放目錄,直接js檔案,但是components--chart--index.js要對應修改下)
直接複製範例的option程式碼
index.js具體程式碼如下
const testBar = (data) => {
  const defaultConfig = {
    xAxis: {
      type: 'category',
      data: ['Mon', 'Tue', 'Wed', 'Thu', 'Fri', 'Sat', 'Sun']
    },
    yAxis: {
      type: 'value'
    },
    series: [{
      data: [120, 200, 150, 80, 70, 110, 130],
      type: 'bar'
    }]
  }

  const opt = Object.assign({}, defaultConfig)
  return opt
}

export default {
  testBar
}testBar方法是可以傳參的,具體使用的時候,圖表所需要設定的屬性,如:data資料、圖表顏色......等都可以作為引數傳。
main.js
這裡全域性引入下封裝的Echarts元件,方便介面呼叫。(至於單個參照的方式,就不必多說了)
具體程式碼如下:
import eChartFn from '@/components/chart/index.js'
import ChartPanel from '@/components/chart/index.vue'
Vue.component(ChartPanel.name, ChartPanel)
Vue.prototype.$eChartFn = eChartFn
chartTest
這裡展示下如何呼叫封裝的bar圖表,主要程式碼如下
index.vue
<chart-view class="chart-content" :chart-option="chartOpt" :auto-resize="true" height="100%" />
index.js
export default {
  name: 'chartTestView',
  data() {
    return {
      chartOpt: {}
    }
  },
  mounted() {},
  created() {
    this.chartOpt = this.$eChartFn.testBar()
  },
  methods: {
  },
  watch: {}
}
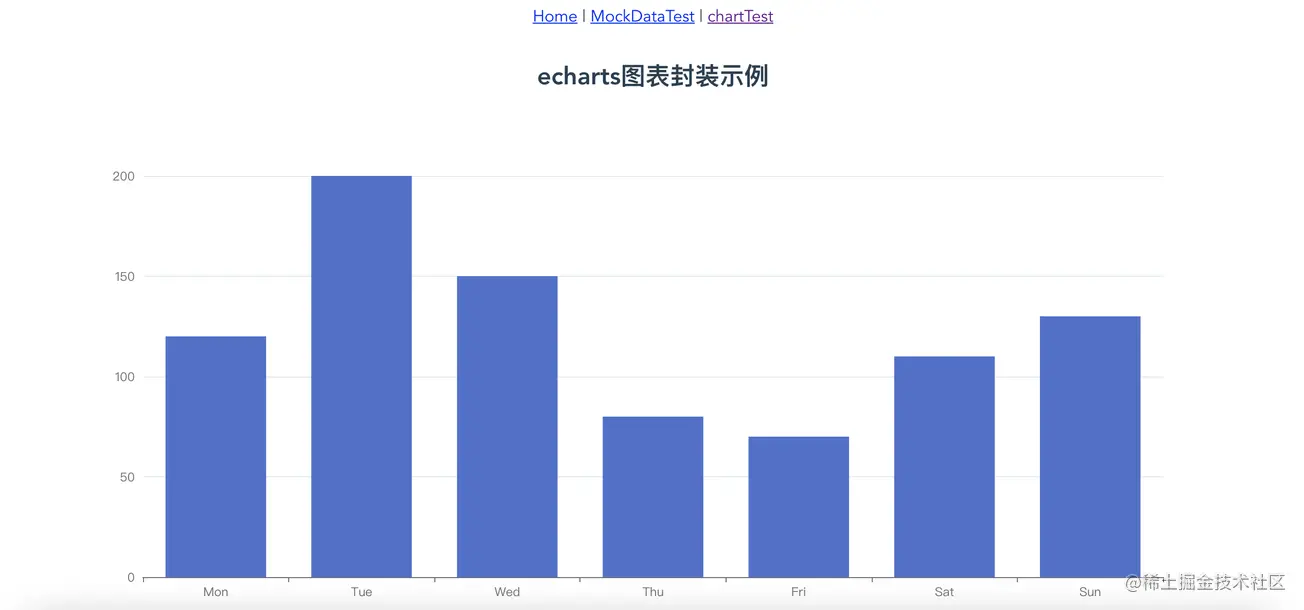
效果如下

可以嘗試拖動瀏覽器的大小,可以看到,圖表也是隨著瀏覽器的拖動自動縮放的。
程式碼
按程式碼總覽的目錄去程式碼裡找著看就行了。
https://github.com/liyoro/vue-skill
總結
Echarts用到的各種圖表,基本上都可以在Echarts官方範例和Echarts視覺化作品分享上找到,特別是Echarts視覺化作品分享,做專案的時候,可以去參考。
以上,封裝了chart元件,按照上述方式,把圖表的option設定和相關處理都放options資料夾下面,呼叫圖表時傳對應的option,也就幾行程式碼的事情,算是比較方便了。
chart元件很方便複用的,直接就可以使用了。
補充
評論裡說想動態修改option裡面的屬性,稍微做了個例子,動態修改pie圖表的data和color屬性,這個是直接生產就可以使用的例子了,直接參考程式碼就行了,不詳細說了。想修改什麼屬性,直接傳參就行。傳具體引數可以,想修改的屬性多了就把引數封裝成一個json傳也可以。懂得在封裝的option裡面靈活使用就行。
以下是新增的參考程式碼
|-- src
    |-- components
        |-- chart
            |-- options    // 存放各種圖表的option
                |-- pie    // pie例子
                    |-- index.js
    |-- views
        |-- chartTest    // 範例所在
            |-- index.vue
            |-- index.scss
            |-- index.js
程式碼使用都是直接一行呼叫的
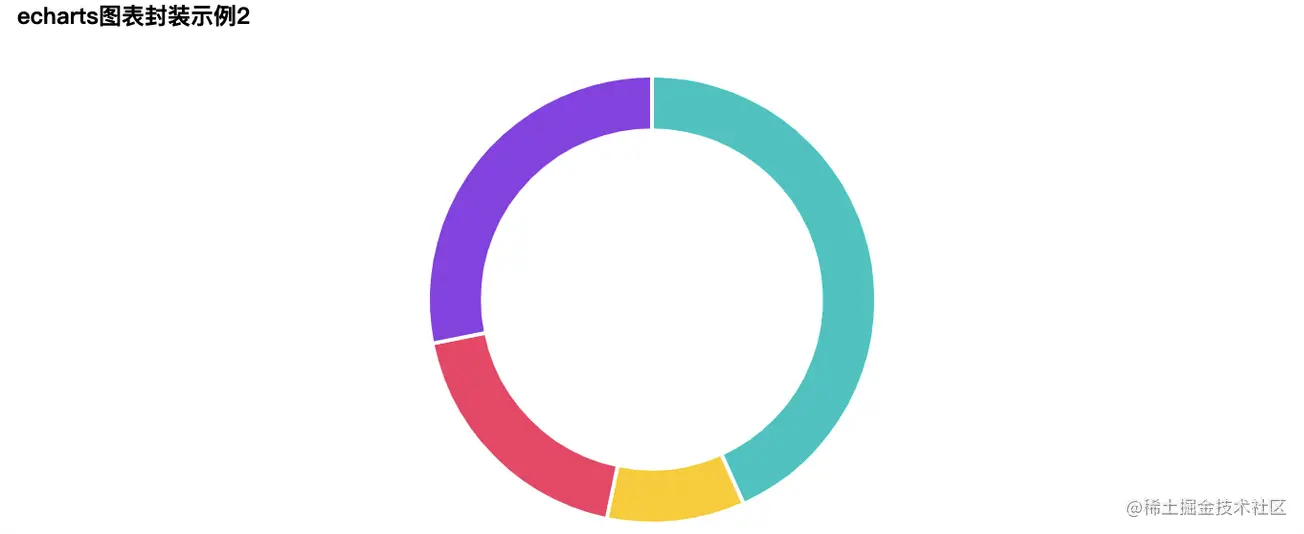
this.chartOpt2 = this.$eChartFn.getPieChart([100, 23, 43, 65], ['#36CBCB', '#FAD337', '#F2637B', '#975FE4'])
效果如下:

補充2:圖表高亮輪詢,dispatchAction使用
效果圖

使用方法
加上:play-highlight="true"屬性就行
<chart-view class="chart-content" :chart-option="chartOpt2" :auto-resize="true" :play-highlight="true" height="100%" />
主要實現的程式碼在如下檔案的playHighlightAction方法裡面,參考的echarts 餅圖呼叫高亮範例 dispatchAction實現的。只是簡單的高亮輪詢,具體各種實現就自己看檔案調樣式了。
|-- src
    |-- components
        |-- chart
            |-- index.js    // 實現自動化匯入options裡的圖表option
(學習視訊分享:、)
以上就是vue專案怎麼優雅的封裝echarts?方法介紹的詳細內容,更多請關注TW511.COM其它相關文章!