tensorflow:使用TensorFlow實現神經網路模型的建立
文章目錄
神經網路
1.全連線層
輸出向量為𝒐 = [𝑜1, 𝑜2]。整個網路層可以通過一次矩陣運算完成:

1.1 張量方式實現
在 TensorFlow 中,要實現全連線層,只需要定義好權值張量 W 和偏置張量 b,並利用TensorFlow 提供的批次矩陣相乘函數 tf.matmul()即可完成網路層的計算。如下程式碼建立輸入 X 矩陣為𝑏 = 2個樣本,每個樣本的輸入特徵長度為𝑑𝑖𝑛 = 784,輸出節點數為𝑑𝑜𝑢𝑡 =256,故定義權值矩陣 W 的 shape 為[784,256],並採用正態分佈初始化 W;偏置向量 b 的 shape 定義為[256],在計算完X@W後相加即可,最終全連線層的輸出 O 的 shape 為 [2,256],即 2個樣本的特徵,每個特徵長度為 256。
import tensorflow as tf
from matplotlib import pyplot as plt
plt.rcParams['font.size'] = 16
plt.rcParams['font.family'] = ['STKaiti']
plt.rcParams['axes.unicode_minus'] = False
# 建立 W,b 張量
x = tf.random.normal([2,784])
w1 = tf.Variable(tf.random.truncated_normal([784, 256], stddev=0.1))
b1 = tf.Variable(tf.zeros([256]))
# 線性變換
o1 = tf.matmul(x,w1) + b1
# 啟用函數
o1 = tf.nn.relu(o1)
1.2 層方式實現
TensorFlow 中有更加高層、使用更方便的層實現方式:layers.Dense(units, activation),只需要指定輸出節點數 Units 和啟用函數型別即可。輸入節點數將根據第一次運算時的輸入 shape 確定,同時根據輸入、輸出節點數自動建立並初始化權值矩陣 W 和偏置向量 b,使用非常方便。其中 activation 引數指定當前層的啟用函數,可以為常見的啟用函數或自定義啟用函數,也可以指定為 None 無啟用函數。
x = tf.random.normal([4,28*28])
# 匯入層模組
from tensorflow.keras import layers
# 建立全連線層,指定輸出節點數和啟用函數
fc = layers.Dense(512, activation=tf.nn.relu)
# 通過 fc 類範例完成一次全連線層的計算,返回輸出張量
h1 = fc(x)
上述通過一行程式碼即可以建立一層全連線層 fc, 並指定輸出節點數為 512, 輸入的節點數在fc(x)計算時自動獲取, 並建立內部權值張量
W
W
W和偏置張量
b
\mathbf{b}
b。 我們可以通過類內部的成員名 kernel 和 bias 來獲取權值張量
W
W
W和偏置張量
b
\mathbf{b}
b物件
# 獲取 Dense 類的權值矩陣
fc.kernel
<tf.Variable 'dense_1/kernel:0' shape=(784, 512) dtype=float32, numpy=
array([[-0.06443337, -0.0205344 ,  0.0111495 , ...,  0.03467645,
         0.05734177, -0.04738677],
       [-0.0453011 , -0.0600119 , -0.01896609, ...,  0.00871194,
        -0.04120795, -0.05477473],
       [-0.00870857,  0.03563788, -0.06142728, ...,  0.0419993 ,
        -0.00972366, -0.00750636],
       ...,
       [-0.02801137, -0.0115794 ,  0.06600933, ..., -0.03404392,
        -0.03490314,  0.01931299],
       [-0.01084805,  0.05528106, -0.0051664 , ..., -0.0058347 ,
         0.02473629, -0.04545905],
       [ 0.04825485,  0.01886629,  0.00533567, ...,  0.02645993,
        -0.04923414, -0.05979132]], dtype=float32)>
# 獲取 Dense 類的偏置向量
fc.bias
# 待優化參數列
fc.trainable_variables
實際上,網路層除了儲存了待優化張量 trainable_variables,還有部分層包含了不參與梯度
優化的張量,如果希望獲得所有參數列,可以通過類的 variables 返回所有內部張量列表:
# 返回所有參數列
fc.variables
對於全連線層,內部張量都參與梯度優化,故 variables 返回列表與 trainable_variables 一樣。
利用網路層類物件進行前向計算時,只需要呼叫類的__call__方法即可,即寫成 fc(x)方式,它會自動呼叫類的__call__方法,在__call__方法中自動呼叫 call 方法,全連線層類 在 call 方法中實現了𝜎(𝑋@𝑊 + 𝒃)的運算邏輯,最後返回全連線層的輸出張量。
2.神經網路
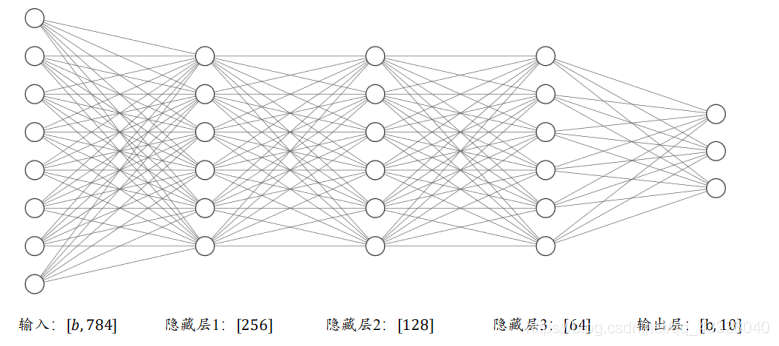
如下圖所示,通過堆疊 4 個全連線層,可以獲得層數為 4 的神經網路,由於每層均為全連線層,稱為全連線網路。其中第 1~3 個全連線層在網路中間,稱之為隱藏層 1,2,3,最後一個全連線層的輸出作為網路的輸出,稱為輸出層。隱藏層 1,2,3 的輸出節點數分別為[256,128,64],輸出層的輸出節點數為 10
2.1 張量方式實現
# 隱藏層 1 張量
w1 = tf.Variable(tf.random.truncated_normal([784, 256], stddev=0.1))
b1 = tf.Variable(tf.zeros([256]))
# 隱藏層 2 張量
w2 = tf.Variable(tf.random.truncated_normal([256, 128], stddev=0.1))
b2 = tf.Variable(tf.zeros([128]))
# 隱藏層 3 張量
w3 = tf.Variable(tf.random.truncated_normal([128, 64], stddev=0.1))
b3 = tf.Variable(tf.zeros([64]))
# 輸出層張量
w4 = tf.Variable(tf.random.truncated_normal([64, 10], stddev=0.1))
b4 = tf.Variable(tf.zeros([10]))
with tf.GradientTape() as tape: # 梯度記錄器
    # x: [b, 28*28]
    # 隱藏層 1 前向計算, [b, 28*28] => [b, 256]
    h1 = x@w1 + tf.broadcast_to(b1, [x.shape[0], 256])
    h1 = tf.nn.relu(h1)
    # 隱藏層 2 前向計算, [b, 256] => [b, 128]
    h2 = h1@w2 + b2
    h2 = tf.nn.relu(h2)
    # 隱藏層 3 前向計算, [b, 128] => [b, 64]
    h3 = h2@w3 + b3
    h3 = tf.nn.relu(h3)
    # 輸出層前向計算, [b, 64] => [b, 10]
    h4 = h3@w4 + b4
2.2 層方式實現
# 匯入常用網路層 layers
from tensorflow.keras import layers
# 隱藏層 1
fc1 = layers.Dense(256, activation=tf.nn.relu)
# 隱藏層 2
fc2 = layers.Dense(128, activation=tf.nn.relu)
# 隱藏層 3
fc3 = layers.Dense(64, activation=tf.nn.relu)
# 輸出層
fc4 = layers.Dense(10, activation=None)
x = tf.random.normal([4,28*28])
# 通過隱藏層 1 得到輸出
h1 = fc1(x)
# 通過隱藏層 2 得到輸出
h2 = fc2(h1)
# 通過隱藏層 3 得到輸出
h3 = fc3(h2)
# 通過輸出層得到網路輸出
h4 = fc4(h3)
對於這種資料依次向前傳播的網路, 也可以通過 Sequential 容器封裝成一個網路大類物件,呼叫大類的前向計算函數一次即可完成所有層的前向計算,使用起來更加方便。
# 匯入 Sequential 容器
from tensorflow.keras import layers,Sequential
# 通過 Sequential 容器封裝為一個網路類
model = Sequential([
    layers.Dense(256, activation=tf.nn.relu) , # 建立隱藏層 1
    layers.Dense(128, activation=tf.nn.relu) , # 建立隱藏層 2
    layers.Dense(64, activation=tf.nn.relu) , # 建立隱藏層 3
    layers.Dense(10, activation=None) , # 建立輸出層
])
out = model(x) # 前向計算得到輸出
3.啟用函數
3.1 Sigmoid
Sigmoid ( x ) ≜ 1 1 + e − x \text{Sigmoid}(x) \triangleq \frac{1}{1 + e^{-x}} Sigmoid(x)≜1+e−x1
# 構造-6~6 的輸入向量
x = tf.linspace(-6.,6.,10)
x
<tf.Tensor: shape=(10,), dtype=float32, numpy=
array([-6.       , -4.6666665, -3.3333333, -2.       , -0.6666665,
        0.666667 ,  2.       ,  3.333334 ,  4.666667 ,  6.       ],
      dtype=float32)>
# 通過 Sigmoid 函數
sigmoid_y = tf.nn.sigmoid(x)
sigmoid_y
<tf.Tensor: shape=(10,), dtype=float32, numpy=
array([0.00247264, 0.00931591, 0.03444517, 0.11920291, 0.33924365,
       0.6607564 , 0.8807971 , 0.96555483, 0.99068403, 0.99752736],
      dtype=float32)>
def set_plt_ax():
    # get current axis 獲得座標軸物件
    ax = plt.gca()

    ax.spines['right'].set_color('none')
    # 將右邊 上邊的兩條邊顏色設定為空 其實就相當於抹掉這兩條邊
    ax.spines['top'].set_color('none')

    ax.xaxis.set_ticks_position('bottom')
    # 指定下邊的邊作為 x 軸,指定左邊的邊為 y 軸
    ax.yaxis.set_ticks_position('left')

    # 指定 data  設定的bottom(也就是指定的x軸)繫結到y軸的0這個點上
    ax.spines['bottom'].set_position(('data', 0))
    ax.spines['left'].set_position(('data', 0))
set_plt_ax()
plt.plot(x, sigmoid_y, color='C4', label='Sigmoid')
plt.xlim(-6, 6)
plt.ylim(0, 1)
plt.legend(loc=2)
plt.show()
findfont: Font family ['STKaiti'] not found. Falling back to DejaVu Sans.
3.2 ReLU
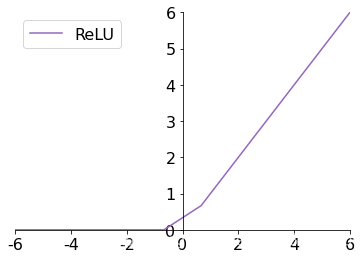
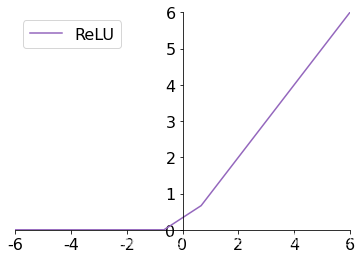
ReLU ( x ) ≜ max ( 0 , x ) \text{ReLU}(x) \triangleq \max(0, x) ReLU(x)≜max(0,x)
# 通過 ReLU 啟用函數
relu_y = tf.nn.relu(x)
relu_y
<tf.Tensor: shape=(10,), dtype=float32, numpy=
array([0.      , 0.      , 0.      , 0.      , 0.      , 0.666667,
       2.      , 3.333334, 4.666667, 6.      ], dtype=float32)>
set_plt_ax()

plt.plot(x, relu_y, color='C4', label='ReLU')
plt.xlim(-6, 6)
plt.ylim(0, 6)
plt.legend(loc=2)
plt.show()
3.3 LeakyReLU
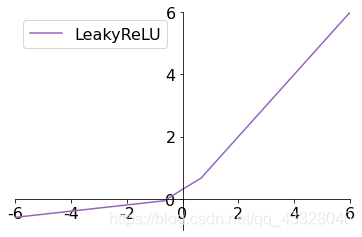
ReLU 函數在𝑥 < 0時梯度值恆為 0,也可能會造成梯度彌散現象,為了克服這個問題,LeakyReLU函數被提出:
LeakyReLU ( x ) ≜ { x x ⩾ 0 p x x < 0 \text{LeakyReLU}(x) \triangleq \left\{ \begin{array}{cc} x \quad x \geqslant 0 \\ px \quad x < 0 \end{array} \right. LeakyReLU(x)≜{xx⩾0pxx<0
其中𝑝為使用者自行設定的某較小數值的超引數,如 0.02 等。當𝑝 = 0時,LeayReLU 函數退化為 ReLU 函數;當𝑝 ≠ 0時,𝑥 < 0能夠獲得較小的梯度值𝑝,從而避免出現梯度彌散現象
# 通過 LeakyReLU 啟用函數
leakyrelu_y = tf.nn.leaky_relu(x, alpha=0.1)
leakyrelu_y
<tf.Tensor: shape=(10,), dtype=float32, numpy=
array([-0.6       , -0.46666667, -0.33333334, -0.2       , -0.06666666,
        0.666667  ,  2.        ,  3.333334  ,  4.666667  ,  6.        ],
      dtype=float32)>
set_plt_ax()

plt.plot(x, leakyrelu_y, color='C4', label='LeakyReLU')
plt.xlim(-6, 6)
plt.ylim(-1, 6)
plt.legend(loc=2)
plt.show()
3.4 Tanh
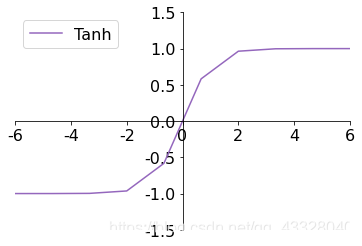
Tanh 函數能夠將𝑥 ∈ 𝑅的輸入「壓縮」到[−1,1]區間,定義為:
tanh ( x ) = e x − e − x e x + e − x = 2 ⋅ sigmoid ( 2 x ) − 1 \tanh(x)=\frac{e^x-e^{-x}}{e^x + e^{-x}}= 2 \cdot \text{sigmoid}(2x) - 1 tanh(x)=ex+e−xex−e−x=2⋅sigmoid(2x)−1
# 通過 tanh 啟用函數
tanh_y = tf.nn.tanh(x)
tanh_y
<tf.Tensor: shape=(10,), dtype=float32, numpy=
array([-0.99998784, -0.99982315, -0.9974579 , -0.9640276 , -0.58278286,
        0.58278316,  0.9640276 ,  0.99745804,  0.99982315,  0.99998784],
      dtype=float32)>
set_plt_ax()

plt.plot(x, tanh_y, color='C4', label='Tanh')
plt.xlim(-6, 6)
plt.ylim(-1.5, 1.5)
plt.legend(loc=2)
plt.show()
4.輸出層設計
4.1Softmax
S o f t m a x ( z i ) ≜ e z i ∑ j = 1 d o u t e z j Softmax(z_i) \triangleq \frac{e^{z_i}}{\sum_{j=1}^{d_{out}} e^{z_j}} Softmax(zi)≜∑j=1doutezjezi
z = tf.constant([2.,1.,0.1])
# 通過 Softmax 函數
tf.nn.softmax(z)
<tf.Tensor: shape=(3,), dtype=float32, numpy=array([0.6590012 , 0.24243298, 0.09856589], dtype=float32)>
# 構造輸出層的輸出
z = tf.random.normal([2,10])
# 構造真實值
y_onehot = tf.constant([1,3])
# one-hot 編碼
y_onehot = tf.one_hot(y_onehot, depth=10)
# 輸出層未使用 Softmax 函數,故 from_logits 設定為 True
# 這樣 categorical_crossentropy 函數在計算損失函數前,會先內部呼叫 Softmax 函數
loss = tf.keras.losses.categorical_crossentropy(y_onehot,z,from_logits=True)
loss = tf.reduce_mean(loss) # 計算平均交叉熵損失
loss
<tf.Tensor: shape=(), dtype=float32, numpy=3.1776986>
# 建立 Softmax 與交叉熵計算類,輸出層的輸出 z 未使用 softmax
criteon = tf.keras.losses.CategoricalCrossentropy(from_logits=True)
loss = criteon(y_onehot,z) # 計算損失
loss
<tf.Tensor: shape=(), dtype=float32, numpy=3.1776986>
5.誤差計算
常見的誤差計算函數有均方差、交叉熵、KL 散度、Hinge Loss 函數等,其中均方差函數和交叉熵函數在深度學習中比較常見,均方差主要用於迴歸問題,交叉熵主要用於分類問題。
5.1 均方差誤差函數
MSE
(
y
,
o
)
≜
1
d
o
u
t
∑
i
=
1
d
o
u
t
(
y
i
−
o
i
)
2
\text{MSE}(y, o) \triangleq \frac{1}{d_{out}} \sum_{i=1}^{d_{out}}(y_i-o_i)^2
MSE(y,o)≜dout1i=1∑dout(yi−oi)2
MSE 誤差函數的值總是大於等於 0,當 MSE 函數達到最小值 0 時, 輸出等於真實標籤,此時神經網路的引數達到最優狀態。
# 構造網路輸出
o = tf.random.normal([2,10])
# 構造真實值
y_onehot = tf.constant([1,3])
y_onehot = tf.one_hot(y_onehot, depth=10)
# 計算均方差
loss = tf.keras.losses.MSE(y_onehot, o)
loss
<tf.Tensor: shape=(2,), dtype=float32, numpy=array([0.87500876, 1.4305398 ], dtype=float32)>
# 計算 batch 均方差
loss = tf.reduce_mean(loss)
loss
<tf.Tensor: shape=(), dtype=float32, numpy=1.1527743>
# 建立 MSE 類
criteon = tf.keras.losses.MeanSquaredError()
# 計算 batch 均方差
loss = criteon(y_onehot,o)
loss
<tf.Tensor: shape=(), dtype=float32, numpy=1.1527743>
5.2 交叉熵誤差函數
H ( p ∥ q ) = D K L ( p ∥ q ) = ∑ j y j log ( y j o j ) = 1 ⋅ log 1 o i + ∑ j ≠ i 0 ⋅ log ( 0 o j ) = − log o i \begin{aligned} H(p \| q) &=D_{K L}(p \| q) \\ &=\sum_{j} y_{j} \log \left(\frac{y_j}{o_j}\right) \\ &= 1 \cdot \log \frac{1}{o_i}+ \sum_{j \neq i} 0 \cdot \log \left(\frac{0}{o_j}\right) \\ & =-\log o_{i} \end{aligned} H(p∥q)=DKL(p∥q)=j∑yjlog(ojyj)=1⋅logoi1+j=i∑0⋅log(oj0)=−logoi
6.汽車油耗預測實戰
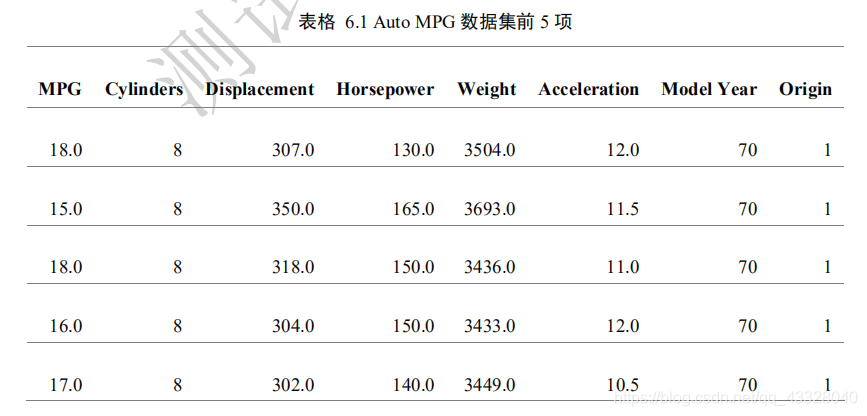
我們採用 Auto MPG 資料集,它記錄了各種汽車效能指標與氣缸數、重量、馬力等其
他因子的真實資料,檢視資料集的前5項:

匯入我們要使用的庫
import matplotlib.pyplot as plt
import pandas as pd
import seaborn as sns
import tensorflow as tf
from tensorflow import keras
from tensorflow.keras import layers, losses
我們來下載資料集
def load_dataset():
    # 線上下載汽車效能資料集
    dataset_path = keras.utils.get_file("auto-mpg.data",
                                        "http://archive.ics.uci.edu/ml/machine-learning-databases/auto-mpg/auto-mpg.data")

    # 效能(公里數每加侖),氣缸數,排量,馬力,重量
    # 加速度,型號年份,產地
    column_names = ['MPG', 'Cylinders', 'Displacement', 'Horsepower', 'Weight',
                    'Acceleration', 'Model Year', 'Origin']
    raw_dataset = pd.read_csv(dataset_path, names=column_names,
                              na_values="?", comment='\t',
                              sep=" ", skipinitialspace=True)

    dataset = raw_dataset.copy()
    return dataset
dataset = load_dataset()
# 檢視部分資料
dataset.head()
| MPG | Cylinders | Displacement | Horsepower | Weight | Acceleration | Model Year | Origin | |
|---|---|---|---|---|---|---|---|---|
| 0 | 18.0 | 8 | 307.0 | 130.0 | 3504.0 | 12.0 | 70 | 1 |
| 1 | 15.0 | 8 | 350.0 | 165.0 | 3693.0 | 11.5 | 70 | 1 |
| 2 | 18.0 | 8 | 318.0 | 150.0 | 3436.0 | 11.0 | 70 | 1 |
| 3 | 16.0 | 8 | 304.0 | 150.0 | 3433.0 | 12.0 | 70 | 1 |
| 4 | 17.0 | 8 | 302.0 | 140.0 | 3449.0 | 10.5 | 70 | 1 |
原始資料中的資料可能含有空欄位(缺失值)的資料項,需要清除這些記錄項:
def preprocess_dataset(dataset):
    dataset = dataset.copy()
    # 統計空白資料,並清除
    dataset = dataset.dropna()

    # 處理類別型資料,其中origin列代表了類別1,2,3,分佈代表產地:美國、歐洲、日本
    # 其彈出這一列
    origin = dataset.pop('Origin')
    # 根據origin列來寫入新列
    dataset['USA'] = (origin == 1) * 1.0
    dataset['Europe'] = (origin == 2) * 1.0
    dataset['Japan'] = (origin == 3) * 1.0

    # 切分為訓練集和測試集
    train_dataset = dataset.sample(frac=0.8, random_state=0)
    test_dataset = dataset.drop(train_dataset.index)
    return train_dataset, test_dataset
train_dataset, test_dataset = preprocess_dataset(dataset)
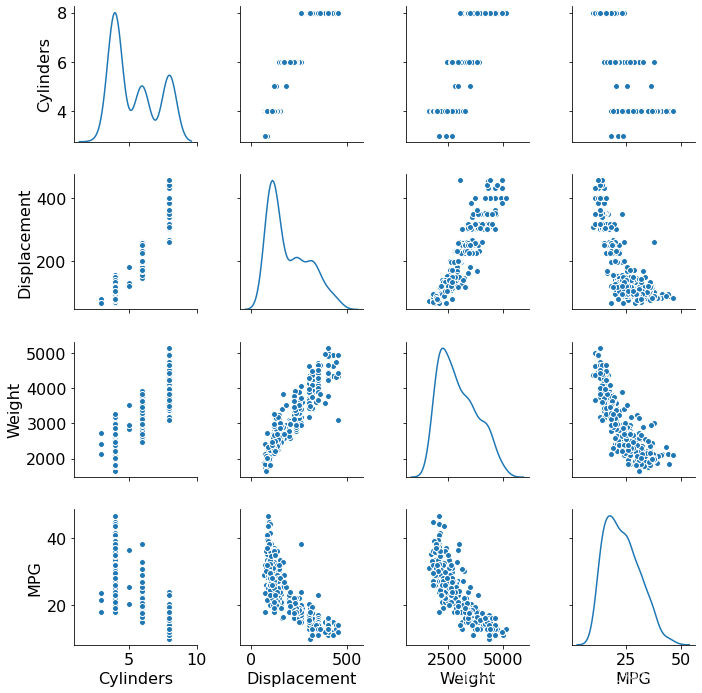
# 統計資料
sns_plot = sns.pairplot(train_dataset[["Cylinders", "Displacement", "Weight", "MPG"]], diag_kind="kde")
plt.figure()
plt.show()
將 MPG 欄位移出為標籤資料:
# 檢視訓練集的輸入X的統計資料
train_stats = train_dataset.describe()
train_stats.pop("MPG")
train_stats = train_stats.transpose()
train_stats
| count | mean | std | min | 25% | 50% | 75% | max | |
|---|---|---|---|---|---|---|---|---|
| Cylinders | 314.0 | 5.477707 | 1.699788 | 3.0 | 4.00 | 4.0 | 8.00 | 8.0 |
| Displacement | 314.0 | 195.318471 | 104.331589 | 68.0 | 105.50 | 151.0 | 265.75 | 455.0 |
| Horsepower | 314.0 | 104.869427 | 38.096214 | 46.0 | 76.25 | 94.5 | 128.00 | 225.0 |
| Weight | 314.0 | 2990.251592 | 843.898596 | 1649.0 | 2256.50 | 2822.5 | 3608.00 | 5140.0 |
| Acceleration | 314.0 | 15.559236 | 2.789230 | 8.0 | 13.80 | 15.5 | 17.20 | 24.8 |
| Model Year | 314.0 | 75.898089 | 3.675642 | 70.0 | 73.00 | 76.0 | 79.00 | 82.0 |
| USA | 314.0 | 0.624204 | 0.485101 | 0.0 | 0.00 | 1.0 | 1.00 | 1.0 |
| Europe | 314.0 | 0.178344 | 0.383413 | 0.0 | 0.00 | 0.0 | 0.00 | 1.0 |
| Japan | 314.0 | 0.197452 | 0.398712 | 0.0 | 0.00 | 0.0 | 0.00 | 1.0 |
資料標準化
def norm(x, train_stats):
    """
    標準化資料
    :param x:
    :param train_stats: get_train_stats(train_dataset)
    :return:
    """
    return (x - train_stats['mean']) / train_stats['std']
# 移動MPG油耗效能這一列為真實標籤Y
train_labels = train_dataset.pop('MPG')
test_labels = test_dataset.pop('MPG')
# 進行標準化
normed_train_data = norm(train_dataset, train_stats)
normed_test_data = norm(test_dataset, train_stats)

print(normed_train_data.shape,train_labels.shape)
print(normed_test_data.shape, test_labels.shape)
(314, 9) (314,)
(78, 9) (78,)
class Network(keras.Model):
    # 迴歸網路
    def __init__(self):
        super(Network, self).__init__()
        # 建立3個全連線層
        self.fc1 = layers.Dense(64, activation='relu')
        self.fc2 = layers.Dense(64, activation='relu')
        self.fc3 = layers.Dense(1)

    def call(self, inputs):
        # 依次通過3個全連線層
        x1 = self.fc1(inputs)
        x2 = self.fc2(x1)
        out = self.fc3(x2)

        return out
def build_model():
    # 建立網路
    model = Network()
    # 通過 build 函數完成內部張量的建立,其中 4 為任意的 batch 數量,9 為輸入特徵長度
    model.build(input_shape=(4, 9))
    model.summary() # 列印網路資訊
    return model
model = build_model()
optimizer = tf.keras.optimizers.RMSprop(0.001) # 建立優化器,指定學習率
train_db = tf.data.Dataset.from_tensor_slices((normed_train_data.values, train_labels.values))
train_db = train_db.shuffle(100).batch(32)
Model: "network_1"
_________________________________________________________________
Layer (type)                 Output Shape              Param #
=================================================================
dense_3 (Dense)              multiple                  640
_________________________________________________________________
dense_4 (Dense)              multiple                  4160
_________________________________________________________________
dense_5 (Dense)              multiple                  65
=================================================================
Total params: 4,865
Trainable params: 4,865
Non-trainable params: 0
_________________________________________________________________
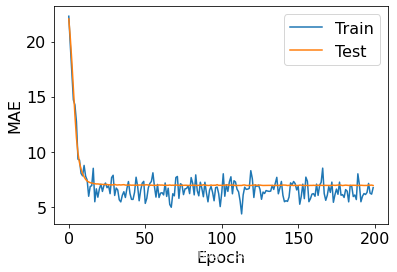
接下來實現網路訓練部分。通過 Epoch 和 Step 的雙層迴圈訓練網路,共訓練 200 個 epoch:
def train(model, train_db, optimizer, normed_test_data, test_labels):
    train_mae_losses = []
    test_mae_losses = []
    for epoch in range(200):
        for step, (x, y) in enumerate(train_db):

            with tf.GradientTape() as tape:
                out = model(x)
                # 均方誤差
                loss = tf.reduce_mean(losses.MSE(y, out))
                #平均絕對值誤差
                mae_loss = tf.reduce_mean(losses.MAE(y, out))

            if step % 10 == 0:
                print(epoch, step, float(loss))

            grads = tape.gradient(loss, model.trainable_variables)
            optimizer.apply_gradients(zip(grads, model.trainable_variables))

        train_mae_losses.append(float(mae_loss))
        out = model(tf.constant(normed_test_data.values))
        test_mae_losses.append(tf.reduce_mean(losses.MAE(test_labels, out)))

    return train_mae_losses, test_mae_losses
def plot(train_mae_losses, test_mae_losses):
    plt.figure()
    plt.xlabel('Epoch')
    plt.ylabel('MAE')
    plt.plot(train_mae_losses, label='Train')
    plt.plot(test_mae_losses, label='Test')
    plt.legend()
    # plt.ylim([0,10])
    plt.legend()
    plt.show()
train_mae_losses, test_mae_losses = train(model, train_db, optimizer, normed_test_data, test_labels)
plot(train_mae_losses, test_mae_losses)
