tensorflow:tensorflow進階
文章目錄
推薦文章
一.合併與分割
import  matplotlib
from    matplotlib import pyplot as plt
# Default parameters for plots
matplotlib.rcParams['font.size'] = 20
matplotlib.rcParams['figure.titlesize'] = 20
matplotlib.rcParams['figure.figsize'] = [9, 7]
matplotlib.rcParams['font.family'] = ['STKaiTi']
matplotlib.rcParams['axes.unicode_minus']=False
import numpy as np
import  tensorflow as tf
from    tensorflow import keras
from    tensorflow.keras import datasets, layers, optimizers
import  os
from mpl_toolkits.mplot3d import Axes3D
1.1 合併
在 TensorFlow 中,可以通過 tf.concat(tensors, axis),其中 tensors 儲存了所有需要
合併的張量 List,axis 指定需要合併的維度。合併張量 A,B 如下:
a = tf.random.normal([2,4]) # 模擬成績冊 A
b = tf.random.normal([2,4]) # 模擬成績冊 B
tf.concat([a,b],axis=0)
<tf.Tensor: shape=(4, 4), dtype=float32, numpy=
array([[ 0.16198424, -0.7170487 , -0.20940438, -0.46842927],
       [ 0.48012358,  0.82777774, -0.37541786, -0.6629169 ],
       [-0.15179256, -0.41726607, -1.9034436 ,  0.72443116],
       [-0.48332193,  0.23101914,  0.87393326, -1.2042308 ]],
      dtype=float32)>
tf.concat([a,b],axis=1)
<tf.Tensor: shape=(2, 8), dtype=float32, numpy=
array([[ 0.16198424, -0.7170487 , -0.20940438, -0.46842927, -0.15179256,
        -0.41726607, -1.9034436 ,  0.72443116],
       [ 0.48012358,  0.82777774, -0.37541786, -0.6629169 , -0.48332193,
         0.23101914,  0.87393326, -1.2042308 ]], dtype=float32)>
使用 tf.stack(tensors, axis) 可以合併多個張量 tensors, 當axis ≥ 0時,在 axis 之前插入;當axis < 0時,在 axis 之後插入新維度。
a = tf.random.normal([2,2])
b = tf.random.normal([2,2])
tf.stack([a,b],axis=0) #
<tf.Tensor: shape=(2, 2, 2), dtype=float32, numpy=
array([[[-2.1611633 ,  0.4318549 ],
        [-1.7556009 ,  0.6960343 ]],

       [[-0.84239227,  0.9800302 ],
        [ 0.5497298 ,  0.0607984 ]]], dtype=float32)>
同樣可以選擇在其他位置插入新維度,如在最末尾插入:
a = tf.random.normal([2,2])
b = tf.random.normal([2,2])
tf.stack([a,b],axis=-1)
<tf.Tensor: shape=(2, 2, 2), dtype=float32, numpy=
array([[[-2.09798   ,  0.5505884 ],
        [-1.1372471 ,  0.08376882]],

       [[-1.0453051 ,  0.47830236],
        [-1.1234645 , -0.97358865]]], dtype=float32)>
1.2 分割
合併操作的逆過程就是分割,將一個張量分拆為多個張量。
通過 tf.split(x, axis, num_or_size_splits) 可以完成張量的分割操作:
-x:待分割張量
-axis:分割的維度索引號
-num_or_size_splits:切割方案。當 num_or_size_splits 為單個數值時,如 10,表示切割為 10 份;當 num_or_size_splits 為 List 時,每個元素表示每份的長度, 如[2,4,2,2]表示切割為 4 份,每份的長度分別為 2,4,2,2
x = tf.random.normal([4,2])
print(x)
result = tf.split(x, axis = 0, num_or_size_splits=2)
result
tf.Tensor(
[[ 0.77127916  0.62768835]
 [-0.76758057  1.3676474 ]
 [-0.10122015 -0.917917  ]
 [-0.1592799  -0.33670765]], shape=(4, 2), dtype=float32)


[<tf.Tensor: shape=(2, 2), dtype=float32, numpy=
 array([[ 0.77127916,  0.62768835],
        [-0.76758057,  1.3676474 ]], dtype=float32)>,
 <tf.Tensor: shape=(2, 2), dtype=float32, numpy=
 array([[-0.10122015, -0.917917  ],
        [-0.1592799 , -0.33670765]], dtype=float32)>]
tf.split(x, axis = 0, num_or_size_splits=[1,2,1])
[<tf.Tensor: shape=(1, 2), dtype=float32, numpy=array([[0.77127916, 0.62768835]], dtype=float32)>,
 <tf.Tensor: shape=(2, 2), dtype=float32, numpy=
 array([[-0.76758057,  1.3676474 ],
        [-0.10122015, -0.917917  ]], dtype=float32)>,
 <tf.Tensor: shape=(1, 2), dtype=float32, numpy=array([[-0.1592799 , -0.33670765]], dtype=float32)>]
如果希望在某個維度上全部按長度為 1 的方式分割,還可以直接使用 tf.unstack(x, axis)。這種方式是 tf.split 的一種特殊情況,切割長度固定為 1,只需要指定切割維度即
可。
x = tf.random.normal([4,2])
tf.unstack(x, axis = 0)
[<tf.Tensor: shape=(2,), dtype=float32, numpy=array([-0.69661826,  0.42463547], dtype=float32)>,
 <tf.Tensor: shape=(2,), dtype=float32, numpy=array([ 0.40786335, -0.9408407 ], dtype=float32)>,
 <tf.Tensor: shape=(2,), dtype=float32, numpy=array([-0.71312106, -0.33494622], dtype=float32)>,
 <tf.Tensor: shape=(2,), dtype=float32, numpy=array([0.9833806, 0.7918092], dtype=float32)>]
2.資料統計
在神經網路的計算過程中,經常需要統計資料的各種屬性,如最大值,均值,範數等。
2.1 向量範數
L1 範數,定義為向量 𝒙 的所有元素絕對值之和
x = tf.ones([2,2])
tf.norm(x, ord = 1)
<tf.Tensor: shape=(), dtype=float32, numpy=4.0>
L2 範數,定義為向量 𝒙 的所有元素的平方和,再開根號
tf.norm(x, ord = 2)
<tf.Tensor: shape=(), dtype=float32, numpy=2.0>
∞ −範數,定義為向量 𝒙 的所有元素絕對值的最大值
tf.norm(x, ord = np.inf)
<tf.Tensor: shape=(), dtype=float32, numpy=1.0>
2.2 最大最小值、均值、和
通過 tf.reduce_max, tf.reduce_min, tf.reduce_mean, tf.reduce_sum 可以求解張量在某個維度上的最大、最小、均值、和,也可以求全域性最大、最小、均值、和資訊。
x = tf.random.normal([2,3])
tf.reduce_max(x, axis = 1)
<tf.Tensor: shape=(2,), dtype=float32, numpy=array([1.1455595, 0.8110037], dtype=float32)>
tf.reduce_min(x, axis = 1)
<tf.Tensor: shape=(2,), dtype=float32, numpy=array([-0.8374149, -1.2768023], dtype=float32)>
tf.reduce_mean(x, axis = 1)
<tf.Tensor: shape=(2,), dtype=float32, numpy=array([ 0.21712641, -0.16247804], dtype=float32)>
tf.reduce_sum(x, axis = 1)
<tf.Tensor: shape=(2,), dtype=float32, numpy=array([ 0.6513792 , -0.48743412], dtype=float32)>
在求解誤差函數時,通過 TensorFlow 的 MSE 誤差函數可以求得每個樣本的誤差,需
要計算樣本的平均誤差,此時可以通過 tf.reduce_mean 在樣本數維度上計算均值:
out = tf.random.normal([4,10]) # 網路預測輸出
y = tf.constant([1,2,2,0]) # 真實標籤
y = tf.one_hot(y,depth=10) # one-hot 編碼
loss = keras.losses.mse(y,out) # 計算每個樣本的誤差
loss = tf.reduce_mean(loss) # 平均誤差
loss
<tf.Tensor: shape=(), dtype=float32, numpy=1.0784723>
除了希望獲取張量的最值資訊,還希望獲得最值所在的索引號,例如分類任務的標籤
預測。考慮 10 分類問題,我們得到神經網路的輸出張量 out,shape 為[2,10],代表了 2 個
樣本屬於 10 個類別的概率,由於元素的位置索引代表了當前樣本屬於此類別的概率,預測
時往往會選擇概率值最大的元素所在的索引號作為樣本類別的預測值:
out = tf.random.normal([2,10])
out = tf.nn.softmax(out, axis=1) # 通過 softmax 轉換為概率值
out
<tf.Tensor: shape=(2, 10), dtype=float32, numpy=
array([[0.03961995, 0.26136935, 0.01498432, 0.03388612, 0.03053044,
        0.05304638, 0.05151249, 0.0134019 , 0.17832054, 0.3233286 ],
       [0.06895317, 0.13860522, 0.14075696, 0.02185706, 0.04494175,
        0.21044637, 0.20726745, 0.04014605, 0.01419329, 0.11283264]],
      dtype=float32)>
通過 tf.argmax(x, axis),tf.argmin(x, axis) 可以求解在 axis 軸上,x 的最大值、最小值所在的索引號:
pred = tf.argmax(out, axis=1)
pred
<tf.Tensor: shape=(2,), dtype=int64, numpy=array([9, 5], dtype=int64)>
2.3 張量比較
為了計算分類任務的準確率等指標,一般需要將預測結果和真實標籤比較,統計比較
結果中正確的數量來就是計算準確率。考慮 10 個樣本的預測結果:
out = tf.random.normal([10,10])
out = tf.nn.softmax(out, axis=1)
pred = tf.argmax(out, axis=1)
pred
<tf.Tensor: shape=(10,), dtype=int64, numpy=array([3, 2, 4, 3, 0, 4, 5, 0, 2, 6], dtype=int64)>
可以看到我們模擬的 10 個樣本的預測值,我們與這 10 樣本的真實值比較:
y = tf.random.uniform([10],dtype=tf.int64,maxval=10)
y
<tf.Tensor: shape=(10,), dtype=int64, numpy=array([7, 3, 9, 2, 7, 4, 3, 1, 4, 5], dtype=int64)>
通過 tf.equal(a, b) (或 tf.math.equal(a, b) )函數可以比較這 2個張量是否相等:
out = tf.equal(pred,y)
out
<tf.Tensor: shape=(10,), dtype=bool, numpy=
array([False, False, False, False, False,  True, False, False, False,
       False])>
tf.equal() 函數返回布林型的張量比較結果,只需要統計張量中 True 元素的個數,即可知道
預測正確的個數。為了達到這個目的,我們先將布林型轉換為整形張量,再求和其中 1 的
個數,可以得到比較結果中 True 元素的個數:
out = tf.cast(out, dtype=tf.float32) # 布林型轉 int 型
correct = tf.reduce_sum(out) # 統計 True 的個數
correct
<tf.Tensor: shape=(), dtype=float32, numpy=1.0>
2.4 填充與複製
填充
填充操作可以通過 tf.pad(x, paddings)函數實現,paddings 是包含了多個
[𝐿𝑒𝑓𝑡 𝑃𝑎𝑑𝑑𝑖𝑛𝑔, 𝑅𝑖𝑔ℎ𝑡 𝑃𝑎𝑑𝑑𝑖𝑛𝑔]的巢狀方案 List,如 [[0,0],[2,1],[1,2]] 表示第一個維度不填
充,第二個維度左邊(起始處)填充兩個單元,右邊(結束處)填充一個單元,第三個維度左邊
填充一個單元,右邊填充兩個單元。
b = tf.constant([1,2,3,4])
tf.pad(b, [[0,2]])  # 第一維,左邊不填充,右邊填充倆個
<tf.Tensor: shape=(6,), dtype=int32, numpy=array([1, 2, 3, 4, 0, 0])>
tf.pad(b, [[2,2]])#第一維,左邊填充倆個,右邊填充倆個
<tf.Tensor: shape=(8,), dtype=int32, numpy=array([0, 0, 1, 2, 3, 4, 0, 0])>
複製
通過 tf.tile 函數可以在任意維度將資料重複複製多份
x = tf.random.normal([2,2])
tf.tile(x, [1,2])
<tf.Tensor: shape=(2, 4), dtype=float32, numpy=
array([[ 1.462598  ,  1.7452018 ,  1.462598  ,  1.7452018 ],
       [-1.4659724 , -0.47004214, -1.4659724 , -0.47004214]],
      dtype=float32)>
3.資料限幅
在 TensorFlow 中,可以通過 tf.maximum(x, a)實現資料的下限幅:𝑥 ∈ [𝑎, +∞);可以
通過 tf.minimum(x, a)實現資料的上限幅:𝑥 ∈ (−∞,𝑎],舉例如下:
x = tf.range(9)
tf.maximum(x, 3) # 下限幅3
<tf.Tensor: shape=(9,), dtype=int32, numpy=array([3, 3, 3, 3, 4, 5, 6, 7, 8])>
tf.minimum(x, 5) # 上限幅5
<tf.Tensor: shape=(9,), dtype=int32, numpy=array([0, 1, 2, 3, 4, 5, 5, 5, 5])>
ReLU 函數可以實現為:
def relu(x):
    return tf.minimum(x,0.) # 下限幅為 0 即可
通過組合 tf.maximum(x, a)和 tf.minimum(x, b) 可以實現同時對資料的上下邊界限幅:
𝑥 ∈ [𝑎, 𝑏]:
x = tf.range(9)
tf.minimum(tf.maximum(x, 2), 7)
<tf.Tensor: shape=(9,), dtype=int32, numpy=array([2, 2, 2, 3, 4, 5, 6, 7, 7])>
更方便地,我們可以使用 tf.clip_by_value 實現上下限幅:
tf.clip_by_value(x,2,7) # 限幅為 2~7
<tf.Tensor: shape=(9,), dtype=int32, numpy=array([2, 2, 2, 3, 4, 5, 6, 7, 7])>
4.高階操作
4.1 tf.gather
x = tf.random.uniform([4,3,2],maxval=100,dtype=tf.int32)
tf.gather(x,[0,1],axis=0)
<tf.Tensor: shape=(2, 3, 2), dtype=int32, numpy=
array([[[51, 45],
        [36, 18],
        [56, 57]],

       [[18, 16],
        [64, 82],
        [13,  4]]])>
實際上,對於上述需求,通過切片𝑥[: 2]可以更加方便地實現。
x[0:2]
<tf.Tensor: shape=(2, 3, 2), dtype=int32, numpy=
array([[[51, 45],
        [36, 18],
        [56, 57]],

       [[18, 16],
        [64, 82],
        [13,  4]]])>
但是對於不規則的索引方式,比如,需要抽查所有班級的第 1,4,9,12,13,27 號同學的成績,則切片方式實現起來非常麻煩,而 tf.gather 則是針對於此需求設計的,使用起來非常方便:
x = tf.random.uniform([10,3,2],maxval=100,dtype=tf.int32)
tf.gather(x,[0,3,8],axis=0)
<tf.Tensor: shape=(3, 3, 2), dtype=int32, numpy=
array([[[86, 82],
        [32, 80],
        [35, 71]],

       [[97, 16],
        [22, 83],
        [20, 82]],

       [[79, 86],
        [13, 46],
        [68, 23]]])>
4.2 tf.gather_nd
通過 tf.gather_nd,可以通過指定每次取樣的座標來實現取樣多個點的目的。
x = tf.random.normal([3,4,4])
tf.gather_nd(x, [[1,2], [2,3]])
<tf.Tensor: shape=(2, 4), dtype=float32, numpy=
array([[-0.5388145 ,  0.00821999,  0.41113982,  1.0409608 ],
       [-0.42242923, -0.29552126,  0.6467382 , -1.7555269 ]],
      dtype=float32)>
tf.gather_nd(x, [[1,1,3], [2,3,3]])
<tf.Tensor: shape=(2,), dtype=float32, numpy=array([ 0.07165062, -1.7555269 ], dtype=float32)>
4.3 tf.boolean_mask
除了可以通過給定索引號的方式取樣,還可以通過給定掩碼(mask)的方式取樣。通過 tf.boolean_mask(x, mask, axis) 可以在 axis 軸上根據 mask 方案進行取樣,實現為:
x = tf.random.normal([3,4,4])
tf.boolean_mask(x,mask=[True, True,False],axis=0)
<tf.Tensor: shape=(2, 4, 4), dtype=float32, numpy=
array([[[ 1.0542077 , -0.48954943, -0.7491975 , -0.43464097],
        [-0.46667233, -1.2484705 , -1.7732694 , -1.2128644 ],
        [ 1.7540843 ,  0.48327965,  0.95591843, -1.5143739 ],
        [ 1.3619318 ,  1.168045  , -0.351565  ,  0.1630519 ]],

       [[-0.13046652, -2.2438517 , -2.3416731 ,  1.4573859 ],
        [ 0.3127366 ,  1.4858567 ,  0.24127336, -1.2466795 ],
        [-0.05732883, -0.75874144,  0.6504554 ,  0.756288  ],
        [-2.8709486 ,  0.11397363, -0.15979192, -0.07177942]]],
      dtype=float32)>
多維掩碼取樣
x = tf.random.uniform([2,3,4],maxval=100,dtype=tf.int32)
print(x)
tf.boolean_mask(x,[[True,True,False],[False,False,True]])
tf.Tensor(
[[[63 32 59 60]
  [56 92 36 63]
  [53 66 69 30]]

 [[75 96 67 15]
  [17 11 64 38]
  [17 81 53 21]]], shape=(2, 3, 4), dtype=int32)


<tf.Tensor: shape=(3, 4), dtype=int32, numpy=
array([[63, 32, 59, 60],
       [56, 92, 36, 63],
       [17, 81, 53, 21]])>
4.4 tf.where
通過 tf.where(cond, a, b) 操作可以根據 cond 條件的真假從 a 或 b 中讀取資料
a = tf.ones([3,3])
b = tf.zeros([3,3])
cond = tf.constant([[True,False,False],[False,True,False],[True,True,False]])
tf.where(cond,a,b)
<tf.Tensor: shape=(3, 3), dtype=float32, numpy=
array([[1., 0., 0.],
       [0., 1., 0.],
       [1., 1., 0.]], dtype=float32)>
當 a = b = None 即 a,b 引數不指定時,tf.where 會返回 cond 張量中所有 True 的元素的索引座標。
tf.where(cond)
<tf.Tensor: shape=(4, 2), dtype=int64, numpy=
array([[0, 0],
       [1, 1],
       [2, 0],
       [2, 1]], dtype=int64)>
下面我們來看一個例子
x = tf.random.normal([3,3])
mask = x > 0
mask
<tf.Tensor: shape=(3, 3), dtype=bool, numpy=
array([[False,  True, False],
       [ True, False, False],
       [ True,  True, False]])>
通過 tf.where 提取此掩碼處 True 元素的索引:
indices=tf.where(mask) # 提取為True 的元素索引
indices
<tf.Tensor: shape=(4, 2), dtype=int64, numpy=
array([[0, 1],
       [1, 0],
       [2, 0],
       [2, 1]], dtype=int64)>
拿到索引後,通過 tf.gather_nd 即可恢復出所有正數的元素:
tf.gather_nd(x,indices) # 提取正數的元素值
<tf.Tensor: shape=(4,), dtype=float32, numpy=array([0.8857748 , 0.5748998 , 1.3066388 , 0.82504845], dtype=float32)>
也可以直接用下面的程式碼一步實現:
tf.boolean_mask(x,x > 0)
<tf.Tensor: shape=(4,), dtype=float32, numpy=array([0.8857748 , 0.5748998 , 1.3066388 , 0.82504845], dtype=float32)>
x[x>0]
<tf.Tensor: shape=(4,), dtype=float32, numpy=array([0.8857748 , 0.5748998 , 1.3066388 , 0.82504845], dtype=float32)>
4.5 scatter_nd
通過 tf.scatter_nd(indices, updates, shape) 可以高效地重新整理張量的部分資料,但是隻能在
全 0 張量的白板上面重新整理,因此可能需要結合其他操作來實現現有張量的資料重新整理功能。
scatter_nd方法的更新示意圖如下:

# 構造需要重新整理資料的位置
indices = tf.constant([[4], [3],[1],[7]])
# 構造需要寫入的資料
updates = tf.constant([4.4,3.3,1.1,7.7])
# 在長度為 8 的全 0 向量上根據 indices 寫入 updates
tf.scatter_nd(indices, updates, [8])
<tf.Tensor: shape=(8,), dtype=float32, numpy=array([0. , 1.1, 0. , 3.3, 4.4, 0. , 0. , 7.7], dtype=float32)>
我們來看多維的資料更新情況
 # 構造寫入位置
indices = tf.constant([[1],[3]])
# 構造寫入資料
updates = tf.constant([[[5,5,5,5],[6,6,6,6]],
                       [[1,1,1,1],[2,2,2,2]]])
# 在 shape 為[4,4,4]白板上根據 indices 寫入 updates
tf.scatter_nd(indices, updates, [4,2,4])
<tf.Tensor: shape=(4, 2, 4), dtype=int32, numpy=
array([[[0, 0, 0, 0],
        [0, 0, 0, 0]],

       [[5, 5, 5, 5],
        [6, 6, 6, 6]],

       [[0, 0, 0, 0],
        [0, 0, 0, 0]],

       [[1, 1, 1, 1],
        [2, 2, 2, 2]]])>
4.6 meshgrid
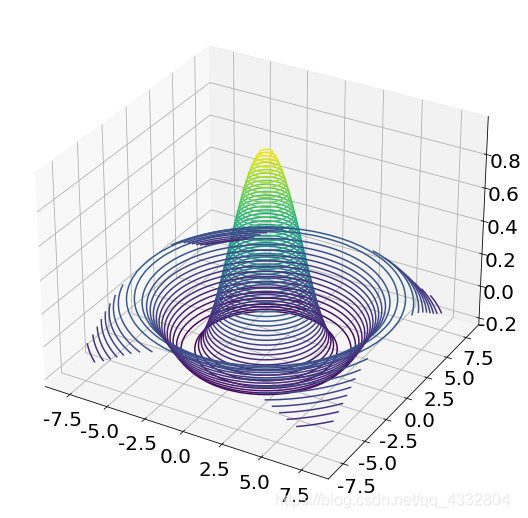
通過 tf.meshgrid 可以方便地生成二維網格取樣點座標,方便視覺化等應用場合。
通過在 x 軸上進行取樣 100 個資料點,y 軸上取樣 100 個資料點,然後通過tf.meshgrid(x, y)即可返回這 10000 個資料點的張量資料,shape 為[100,100,2]。為了方便計算,tf.meshgrid 會返回在 axis=2 維度切割後的 2 個張量 a,b,其中張量 a 包含了所有點的 x座標,b 包含了所有點的 y 座標,shape 都為[100,100]:
x = tf.linspace(-8.,8,100) # 設定 x 座標的間隔
y = tf.linspace(-8.,8,100) # 設定 y 座標的間隔
x,y = tf.meshgrid(x,y) # 生成網格點,並拆分後返回
x.shape,y.shape # 列印拆分後的所有點的 x,y 座標張量 shape
(TensorShape([100, 100]), TensorShape([100, 100]))
考慮2 個自變數 x,y 的 Sinc 函數表示式為:z = sin(x2 + y2) / (x2 + y2)
Sinc 函數在 TensorFlow 中實現如下:
z = tf.sqrt(x**2+y**2)
z = tf.sin(z)/z # sinc 函數實現
fig = plt.figure()
ax = Axes3D(fig)
ax.contour3D(x.numpy(), y.numpy(), z.numpy(), 50)
plt.show()
<Figure size 648x504 with 0 Axes>


<Figure size 648x504 with 0 Axes>


findfont: Font family ['STKaiTi'] not found. Falling back to DejaVu Sans.

5.資料集載入
在 TensorFlow 中,keras.datasets 模組提供了常用經典資料集的自動下載、管理、載入
與轉換功能,並且提供了tf.data.Dataset 資料集物件,方便實現多執行緒(Multi-thread),預處
理(Preprocess),隨機打散(Shuffle)和批訓練(Train on batch)等常用資料集功能。
通過 datasets.xxx.load_data() 即可實現經典資料集的自動載入,其中 xxx 代表具體的數
據集名稱。TensorFlow 會預設將資料快取在使用者目錄下的 .keras/datasets 資料夾,
所示,使用者不需要關心資料集是如何儲存的。如果當前資料集不在快取中,則會自動從網站下載和解壓,載入;如果已經在快取中,自動完成載入:
import tensorflow as tf
from tensorflow import keras
from tensorflow.keras import datasets # 匯入經典資料集載入模組
(x, y), (x_test, y_test) = datasets.mnist.load_data()
print('x:', x.shape, 'y:', y.shape, 'x test:', x_test.shape, 'y test:', y_test)
x: (60000, 28, 28) y: (60000,) x test: (10000, 28, 28) y test: [7 2 1 ... 4 5 6]
通過 load_data() 會返回相應格式的資料,對於圖片資料集 MNIST, CIFAR10 等,會返回 2 個 tuple,第一個 tuple 儲存了用於訓練的資料 x,y 訓練集物件;第 2 個 tuple 則儲存了用於
測試的資料 x_test,y_test 測試集物件,所有的資料都用 Numpy.array 容器承載。
資料載入進入記憶體後,需要轉換成 Dataset 物件,以利用 TensorFlow 提供的各種便捷功能。通過 Dataset.from_tensor_slices 可以將訓練部分的資料圖片 x 和標籤 y 都轉換成Dataset 物件:
train_db = tf.data.Dataset.from_tensor_slices((x, y))
5.1 隨機打亂
通過 Dataset.shuffle(buffer_size)工具可以設定 Dataset 物件隨機打散資料之間的順序,防止每次訓練時資料按固定順序產生,從而使得模型嘗試「記憶」住標籤資訊:train_db = train_db.shuffle(10000) 其中 buffer_size 指定緩衝池的大小,一般設定為一個較大的引數即可。通過 Dataset 提供的這些工具函數會返回新的 Dataset 物件,可以通過 db = db. shuffle(). step2(). step3. () 方式完成所有的資料處理步驟,實現起來非常方便
5.2 批訓練
為了利用顯示卡的平行計算能力,一般在網路的計算過程中會同時計算多個樣本,我們把這種訓練方式叫做批訓練,其中樣本的數量叫做 batch size。為了一次能夠從 Dataset 中產生 batch size 數量的樣本,需要設定 Dataset 為批訓練方式:
train_db = train_db.batch(128)
其中 128 為 batch size`引數,即一次平行計算 128 個樣本的資料。Batch size 一般根據使用者的 GPU 視訊記憶體資源來設定,當視訊記憶體不足時,可以適量減少 batch size 來減少演演算法的視訊記憶體使用量
5.3預處理
從 keras.datasets 中載入的資料集的格式大部分情況都不能滿足模型的輸入要求,因此需要根據使用者的邏輯自己實現預處理常式。Dataset 物件通過提供 map(func)工具函數可以非常方便地呼叫使用者自定義的預處理邏輯,它實現在 func 函數裡:
#預處理常式實現在 preprocess 函數中,傳入函數參照即可
train_db = train_db.map(preprocess)
def preprocess(x, y): # 自定義的預處理常式
# 呼叫此函數時會自動傳入 x,y 物件,shape 為[b, 28, 28], [b]
 # 標準化到 0~1
 x = tf.cast(x, dtype=tf.float32) / 255.
 x = tf.reshape(x, [-1, 28*28]) # 打平
 y = tf.cast(y, dtype=tf.int32) # 轉成整形張量
 y = tf.one_hot(y, depth=10) # one-hot 編碼
 # 返回的 x,y 將替換傳入的 x,y 引數,從而實現資料的預處理功能
 return x,y
train_db = train_db.map(preprocess)
5.4 迴圈訓練
對於 Dataset 物件,在使用時可以通過
for step, (x,y) in enumerate(train_db): # 迭代資料集物件,帶 step 引數
或:
for x,y in train_db: # 迭代資料集物件
方式進行迭代,每次返回的 x,y 物件即為批次樣本和標籤,當對 train_db 的所有樣本完成
一次迭代後,for 迴圈終止退出。我們一般把完成一個 batch 的資料訓練,叫做一個 step;
通過多個 step 來完成整個訓練集的一次迭代,叫做一個 epoch。在實際訓練時,通常需要
對資料集迭代多個 epoch 才能取得較好地訓練效果
此外,也可以通過設定:
train_db = train_db.repeat(20) # 資料集跌打 20 遍才終止
使得 for x,y in train_db 迴圈迭代 20 個 epoch 才會退出。不管使用上述哪種方式,都能取得一樣的效果。
6.MNIST手寫數位識別實戰
# 匯入要使用的庫
import  matplotlib
from    matplotlib import pyplot as plt
# Default parameters for plots
matplotlib.rcParams['font.size'] = 20
matplotlib.rcParams['figure.titlesize'] = 20
matplotlib.rcParams['figure.figsize'] = [9, 7]
matplotlib.rcParams['font.family'] = ['STKaiTi']
matplotlib.rcParams['axes.unicode_minus']=False
import  tensorflow as tf
from    tensorflow import keras
from    tensorflow.keras import datasets, layers, optimizers
import  os
os.environ['TF_CPP_MIN_LOG_LEVEL']='2'
print(tf.__version__)

def preprocess(x, y):
    # [b, 28, 28], [b]
    x = tf.cast(x, dtype=tf.float32) / 255.
    x = tf.reshape(x, [-1, 28*28])
    y = tf.cast(y, dtype=tf.int32)
    y = tf.one_hot(y, depth=10)
    return x,y
(x, y), (x_test, y_test) = datasets.mnist.load_data()
print('x:', x.shape, 'y:', y.shape, 'x test:', x_test.shape, 'y test:', y_test)

# 資料預處理
batchsz = 512
train_db = tf.data.Dataset.from_tensor_slices((x, y))
train_db = train_db.shuffle(1000).batch(batchsz).map(preprocess).repeat(20)

test_db = tf.data.Dataset.from_tensor_slices((x_test, y_test))
test_db = test_db.shuffle(1000).batch(batchsz).map(preprocess)

x,y = next(iter(train_db))
print('train sample:', x.shape, y.shape)
# print(x[0], y[0])

def main():
    # learning rate
    lr = 1e-2
    accs,losses = [], []
    # 784 => 512

    #得到引數
    w1, b1 = tf.Variable(tf.random.normal([784, 256], stddev=0.1)), tf.Variable(tf.zeros([256]))
    # 512 => 256
    w2, b2 = tf.Variable(tf.random.normal([256, 128], stddev=0.1)), tf.Variable(tf.zeros([128]))
    # 256 => 10
    w3, b3 = tf.Variable(tf.random.normal([128, 10], stddev=0.1)), tf.Variable(tf.zeros([10]))
    #開始訓練
    for step, (x,y) in enumerate(train_db):
        # [b, 28, 28] => [b, 784]
        x = tf.reshape(x, (-1, 784))
        with tf.GradientTape() as tape:
            # layer1.
            h1 = x @ w1 + b1
            h1 = tf.nn.relu(h1)
            # layer2
            h2 = h1 @ w2 + b2
            h2 = tf.nn.relu(h2)
            # output
            out = h2 @ w3 + b3
            # out = tf.nn.relu(out)
            # compute loss
            # [b, 10] - [b, 10]
            loss = tf.square(y-out)
            # [b, 10] => scalar
            loss = tf.reduce_mean(loss)
        grads = tape.gradient(loss, [w1, b1, w2, b2, w3, b3])  #得到梯度
        for p, g in zip([w1, b1, w2, b2, w3, b3], grads): # 更新引數
            p.assign_sub(lr * g)
        # print
        if step % 80 == 0:
            print(step, 'loss:', float(loss))
            losses.append(float(loss))
        if step %80 == 0:
            # evaluate/test
            total, total_correct = 0., 0

            for x, y in test_db:
                # layer1.
                h1 = x @ w1 + b1
                h1 = tf.nn.relu(h1)
                # layer2
                h2 = h1 @ w2 + b2
                h2 = tf.nn.relu(h2)
                # output
                out = h2 @ w3 + b3
                # [b, 10] => [b]
                pred = tf.argmax(out, axis=1)
                # convert one_hot y to number y
                y = tf.argmax(y, axis=1)
                # bool type
                correct = tf.equal(pred, y)
                # bool tensor => int tensor => numpy
                total_correct += tf.reduce_sum(tf.cast(correct, dtype=tf.int32)).numpy()
                total += x.shape[0]

            print(step, 'Evaluate Acc:', total_correct/total)

            accs.append(total_correct/total)


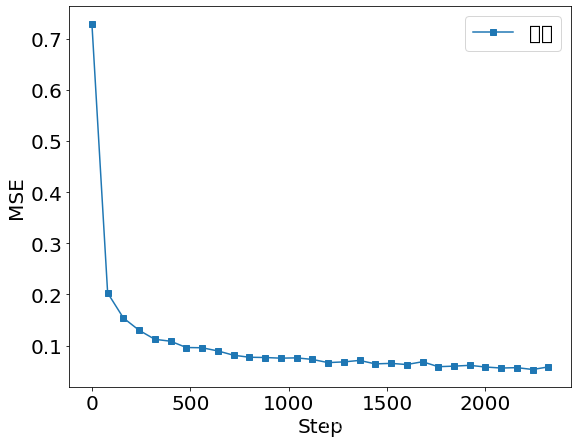
    plt.figure()
    x = [i*80 for i in range(len(losses))]
    plt.plot(x, losses, color='C0', marker='s', label='訓練')
    plt.ylabel('MSE')
    plt.xlabel('Step')
    plt.legend()
    plt.savefig('train.svg')

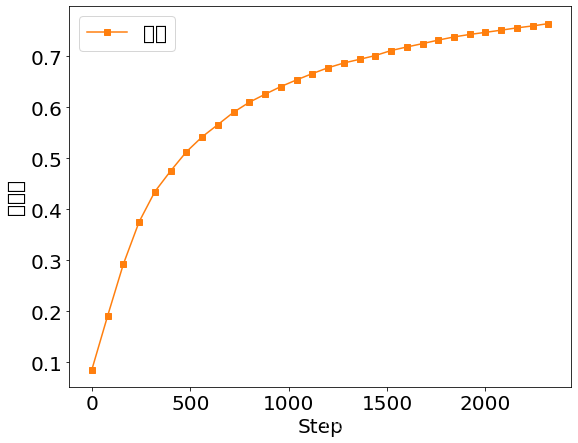
    plt.figure()
    plt.plot(x, accs, color='C1', marker='s', label='測試')
    plt.ylabel('準確率')
    plt.xlabel('Step')
    plt.legend()
    plt.savefig('test.svg')
    plt.show()

if __name__ == '__main__':
    main()

