Kaggle競賽入門教學案例
Kaggle比賽入門新手教學(房價預測案例:前篇)
Kaggle房價預測全流程詳解
對於剛剛入門機器學習的童孩來說,如何快速地通過不同實戰演練以提高程式碼能力和流程理解是一個需要關注的問題。Kaggle平臺正好提供了資料科學家的所需要的交流環境,並且為痴迷於人工智慧的狂熱的愛好者舉辦了各種型別的競賽(如,資料科學/影象分類/影象識別/自然語言處理/漏洞檢測)。
Kaggle社群是一種全球性的交流社群,集中大量優秀的AI科學家和資料分析家,能夠相互分享實戰經驗和程式碼,並且有基礎入門教學,對新手非常友好~
競賽連結與背景介紹

- Kaggle平臺官網:https://www.kaggle.com
- 房價預測競賽網址: https://www.kaggle.com/c/house-prices-advanced-regression-techniques
房價是一個生活中耳熟能詳的概念,在大城市買房尤其成為了上班族幾乎最大的苦惱(以後即將面臨····),而在美國的愛荷華州埃姆斯市有許多因素影響著房屋的最終價格,例如房屋面積、地下室、浴室和車庫等等;
kaggle平臺收集了約80個可能影響房價的特徵變數,要求資料科學家利用機器學習等工具對房價進行預測,即該案例是一種簡單的迴歸問題。
官方提供的房屋特徵描述檔案我已翻譯成中文,供大家參考。英文原版的可以點選Kaggle競賽欄目下的下載按鈕,資料集也是一樣。如下所示:
- SalePrice: 房產銷售價格,以美元計價。所要預測的目標變數
- MSSubClass: Identifies the type of dwelling involved in the sale 住所型別
- MSZoning: The general zoning classification 區域分類
- LotFrontage: Linear feet of street connected to property 房子同街道之間的距離
- LotArea: Lot size in square feet 建築面積
- Street: Type of road access 主路的路面型別
- Alley: Type of alley access 小道的路面型別
- LotShape: General shape of property 房屋外形
- LandContour: Flatness of the property 平整度
- Utilities: Type of utilities available 配套公用設施型別
- LotConfig: Lot configuration 設定
- LandSlope: Slope of property 土地坡度
- Neighborhood: Physical locations within Ames city limits 房屋在埃姆斯市的位置
- Condition1: Proximity to main road or railroad 附近交通情況
- Condition2: Proximity to main road or railroad (if a second is present) 附近交通情況(如果同時滿足兩種情況)
- BldgType: Type of dwelling 住宅型別
- HouseStyle: Style of dwelling 房屋的層數
- OverallQual: Overall material and finish quality 完工品質和材料
- OverallCond: Overall condition rating 整體條件等級
- YearBuilt: Original construction date 建造年份
- YearRemodAdd: Remodel date 翻修年份
- RoofStyle: Type of roof 屋頂型別
- RoofMatl: Roof material 屋頂材料
- Exterior1st: Exterior covering on house 外立面材料
- Exterior2nd: Exterior covering on house (if more than one material) 外立面材料2
- MasVnrType: Masonry veneer type 裝飾石材型別
- MasVnrArea: Masonry veneer area in square feet 裝飾石材面積
- ExterQual: Exterior material quality 外立面材料品質
- ExterCond: Present condition of the material on the exterior 外立面材料外觀情況
- Foundation: Type of foundation 房屋結構型別
- BsmtQual: Height of the basement 評估地下室層高情況
- BsmtCond: General condition of the basement 地下室總體情況
- BsmtExposure: Walkout or garden level basement walls 地下室出口或者花園層的牆面
- BsmtFinType1: Quality of basement finished area 地下室區域品質
- BsmtFinSF1: Type 1 finished square feet Type 1完工面積
- BsmtFinType2: Quality of second finished area (if present) 二次完工面積品質(如果有)
- BsmtFinSF2: Type 2 finished square feet Type 2完工面積
- BsmtUnfSF: Unfinished square feet of basement area 地下室區域未完工面積
- TotalBsmtSF: Total square feet of basement area 地下室總體面積
- Heating: Type of heating 採暖型別
- HeatingQC: Heating quality and condition 採暖品質和條件
- CentralAir: Central air conditioning 中央空調系統
- Electrical: Electrical system 電力系統
- 1stFlrSF: First Floor square feet 第一層面積
- 2ndFlrSF: Second floor square feet 第二層面積
- LowQualFinSF: Low quality finished square feet (all floors) 低品質完工面積
- GrLivArea: Above grade (ground) living area square feet 地面以上部分起居面積
- BsmtFullBath: Basement full bathrooms 地下室全浴室數量
- BsmtHalfBath: Basement half bathrooms 地下室半浴室數量
- FullBath: Full bathrooms above grade 地面以上全浴室數量
- HalfBath: Half baths above grade 地面以上半浴室數量
- Bedroom: Number of bedrooms above basement level 地面以上臥室數量
- KitchenAbvGr: Number of kitchens 廚房數量
- KitchenQual: Kitchen quality 廚房品質
- TotRmsAbvGrd: Total rooms above grade (does not include bathrooms) 總房間數(不含浴室和地下部分)
- Functional: Home functionality rating 功能性評級
- Fireplaces: Number of fireplaces 壁爐數量
- FireplaceQu: Fireplace quality 壁爐品質
- GarageType: Garage location 車庫位置
- GarageYrBlt: Year garage was built 車庫建造時間
- GarageFinish: Interior finish of the garage 車庫內飾
- GarageCars: Size of garage in car capacity 車殼大小以停車數量表示
- GarageArea: Size of garage in square feet 車庫面積
- GarageQual: Garage quality 車庫品質
- GarageCond: Garage condition 車庫條件
- PavedDrive: Paved driveway 車道鋪砌情況
- WoodDeckSF: Wood deck area in square feet 實木地板面積
- OpenPorchSF: Open porch area in square feet 開放式門廊面積
- EnclosedPorch: Enclosed porch area in square feet 封閉式門廊面積
- 3SsnPorch: Three season porch area in square feet 時令門廊面積
- ScreenPorch: Screen porch area in square feet 屏風門廊面積
- PoolArea: Pool area in square feet 游泳池面積
- PoolQC: Pool quality 游泳池品質
- Fence: Fence quality 圍欄品質
- MiscFeature: Miscellaneous feature not covered in other categories 其它條件中未包含部分的特性
- MiscVal: $Value of miscellaneous feature 雜項部分價值
- MoSold: Month Sold 賣出月份
- YrSold: Year Sold 賣出年份
- SaleType: Type of sale 出售型別
- SaleCondition: Condition of sale 出售條件
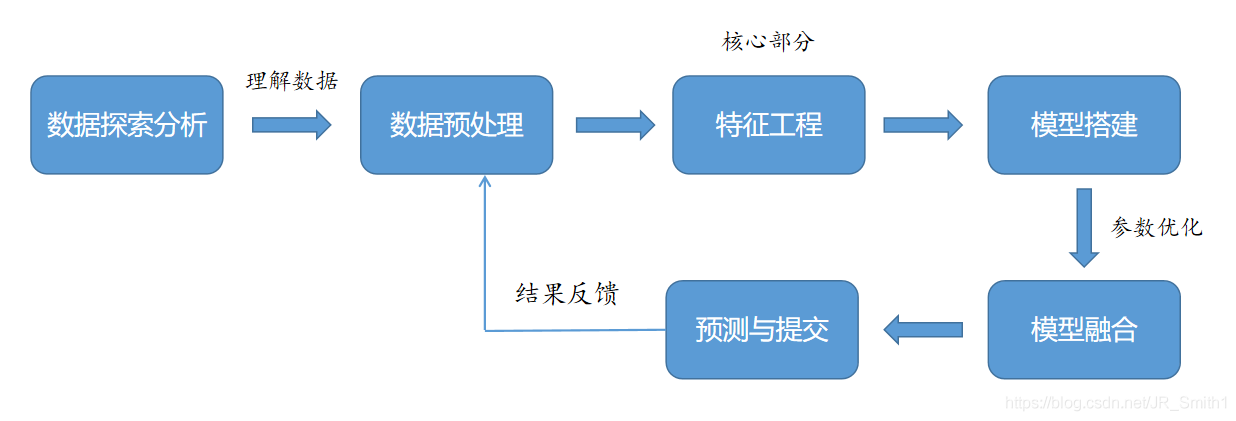
接下來的工作就是基於這些特徵進行資料探勘和構建模型來預測了。整體流程的思路如下:
競賽程式碼解析
匯入工具包
import numpy as np    #基本矩陣計算工具
import pandas as pd   #基本資料視覺化工具
import matplotlib.pyplot as plt  #繪圖工具
import seaborn as sns
from datetime import datetime   #記錄時間
from scipy.stats import skew  #偏度計算
from scipy.special import boxcox1p  #box-cox變換工具
from scipy.stats import boxcox_normmax
from sklearn.linear_model import LinearRegression, ElasticNetCV, LassoCV, RidgeCV  #線性模型
from sklearn.ensemble import GradientBoostingRegressor   #GBDT模型
from sklearn.svm import SVR  #SVR模型
from sklearn.pipeline import make_pipeline  #構建Pipeline
from sklearn.preprocessing import RobustScaler  #穩健標準化,用於縮放包含許多異常值的資料
from sklearn.model_selection import KFold, RepeatedKFold, cross_val_score, GridSearchCV  #K折取樣以及交叉驗證
from sklearn.metrics import mean_squared_error   #均方根指標
from mlxtend.regressor import StackingCVRegressor   #帶交叉驗證的Stacking迴歸器
from xgboost import XGBRegressor    #XGBoost模型
from lightgbm import LGBMRegressor  #LGB模型
import warnings  #系統警告提示
import os   #系統讀取工具
warnings.filterwarnings('ignore')  #忽略警告
資料載入
#檔案根目錄,輸入本地下載好的檔案目錄地址

DATA_ROOT = 'D:/Kaggle比賽/房價迴歸預測/'
print(os.listdir(DATA_ROOT))
['data_description.txt', 'House_price_submission.csv', 'sample_submission.csv', 'test.csv', 'test_results.csv', 'train.csv', '資料描述中文介紹.txt']
#匯入訓練集、測試集和提交樣本
train = pd.read_csv(f'{DATA_ROOT}/train.csv')
test = pd.read_csv(f'{DATA_ROOT}/test.csv')
sub = pd.read_csv(f'{DATA_ROOT}/sample_submission.csv')

#列印資料維度
print("Train set size:", train.shape)
print("Test set size:", test.shape)
輸出結果:
Train set size: (1460, 81) , Test set size: (1459, 80)
#檢視訓練集資料摘要
print(train.info())
<class 'pandas.core.frame.DataFrame'>
RangeIndex: 1460 entries, 0 to 1459
Data columns (total 81 columns):
 #   Column         Non-Null Count  Dtype
---  ------         --------------  -----
 0   Id             1460 non-null   int64
 1   MSSubClass     1460 non-null   int64
 2   MSZoning       1460 non-null   object
 3   LotFrontage    1201 non-null   float64
 4   LotArea        1460 non-null   int64
 5   Street         1460 non-null   object
 6   Alley          91 non-null     object
 7   LotShape       1460 non-null   object
 8   LandContour    1460 non-null   object
 9   Utilities      1460 non-null   object
 10  LotConfig      1460 non-null   object
 ......
#檢視測試集資料摘要
print(test.info())
	<class 'pandas.core.frame.DataFrame'>
RangeIndex: 1460 entries, 0 to 1459
Data columns (total 81 columns):
 #   Column         Non-Null Count  Dtype
---  ------         --------------  -----
 0   Id             1460 non-null   int64
 1   MSSubClass     1460 non-null   int64
 2   MSZoning       1460 non-null   object
 3   LotFrontage    1201 non-null   float64
 4   LotArea        1460 non-null   int64
 5   Street         1460 non-null   object
 6   Alley          91 non-null     object
 7   LotShape       1460 non-null   object
 8   LandContour    1460 non-null   object
 9   Utilities      1460 non-null   object
 10  LotConfig      1460 non-null   object
 .....
通過簡單粗略看資料,我們知道這裡有著數值型變數和非數值變數(類別型變數),除開ID和SalePrice以外共有79個特徵。
資料預處理
異常值初篩
#先將樣本ID賦值並刪除
train_ID = train['Id']
test_ID = test['Id']

train.drop(['Id'], axis=1, inplace=True)
test.drop(['Id'], axis=1, inplace=True)

#整理出數值型特徵和類別型特徵
all_cols = test.columns.tolist()
numerical_cols = []
categorical_cols = []

for col in all_cols:
    if (test[col].dtype != 'object') :
        numerical_cols.append(col)
    else:
        categorical_cols.append(col)

print('數值型變數數目為:',len(numerical_cols))
print('類別型變數數目為:',len(categorical_cols))
數值型變數數目為: 36
類別型變數數目為: 43
#對訓練集的連續性數值變數繪製箱型圖篩選異常值

fig = plt.figure(figsize=(80,60),dpi=120)
for i in range(len(numerical_cols)):
    plt.subplot(6, 6, i+1)
    sns.boxplot(train[numerical_cols[i]], orient='v', width=0.5)
    plt.ylabel(numerical_cols[i], fontsize=36)
plt.show()
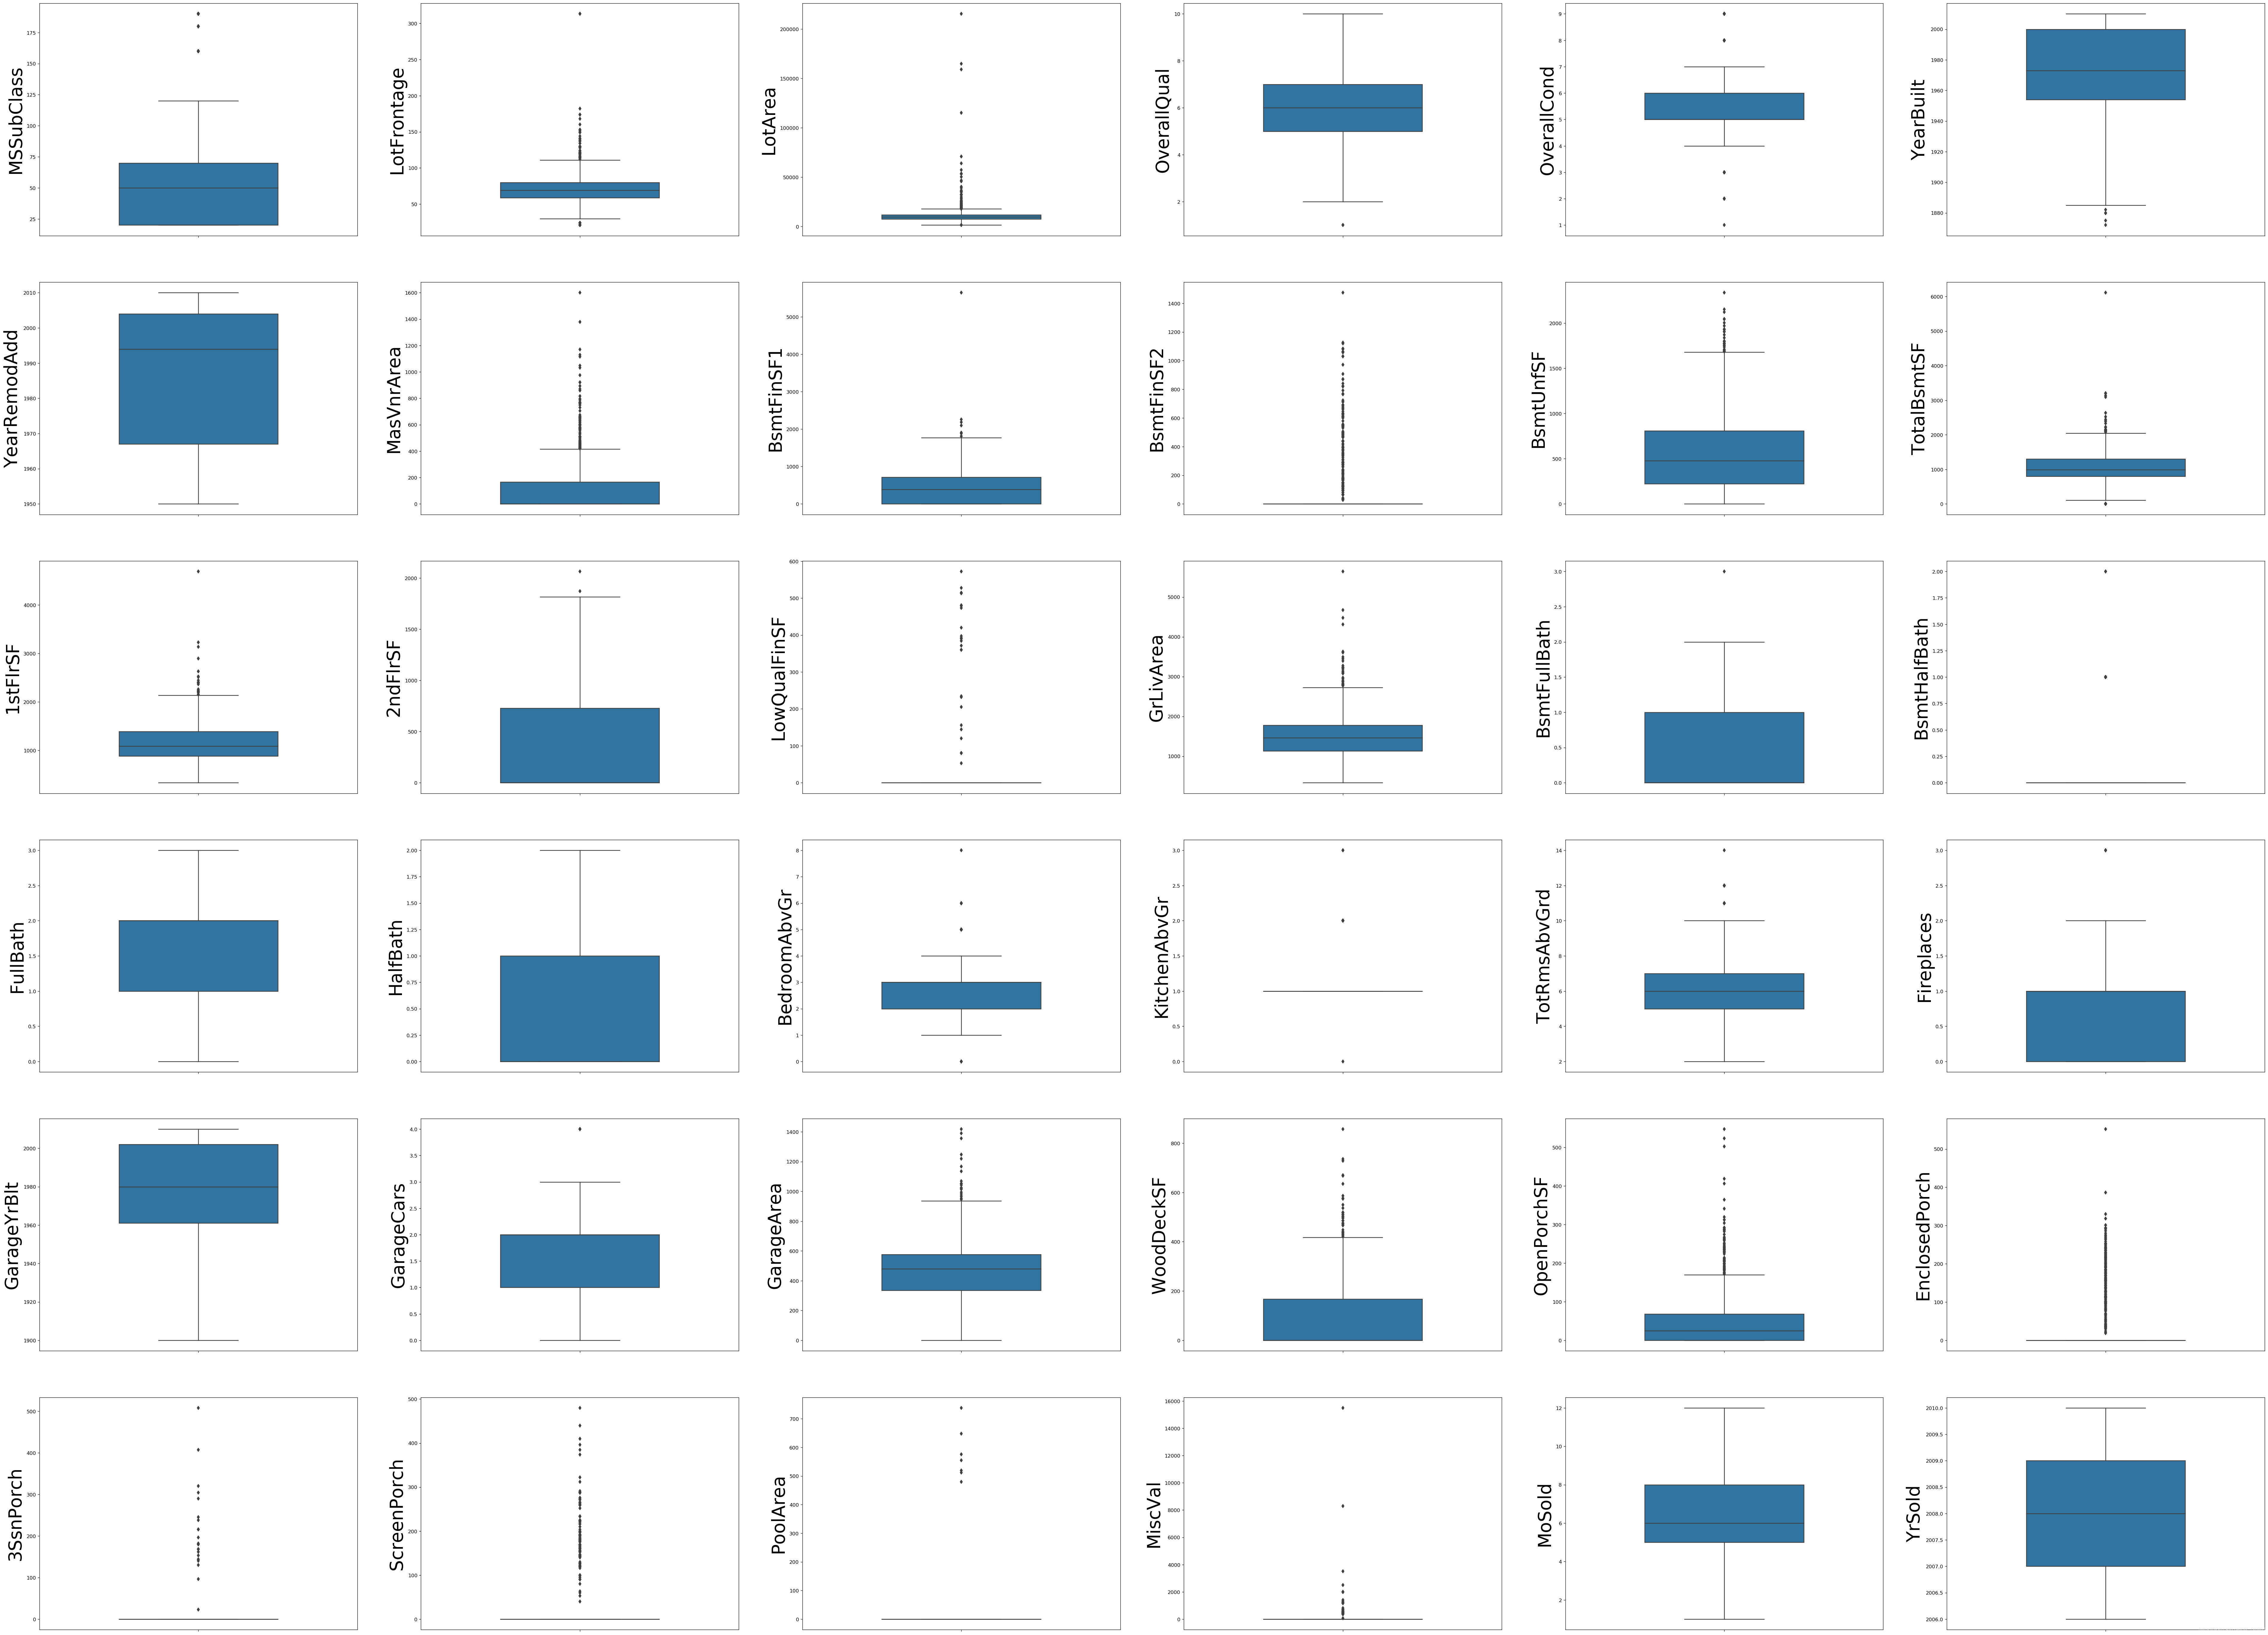
檢視具有較為明顯異常值的特徵列:
#地面上居住面積與房屋售價關係
fig = plt.figure(figsize=(6,5))
plt.axvline(x=4600, color='r', linestyle='--')
sns.scatterplot(x='GrLivArea',y='SalePrice',data=train, alpha=0.6)
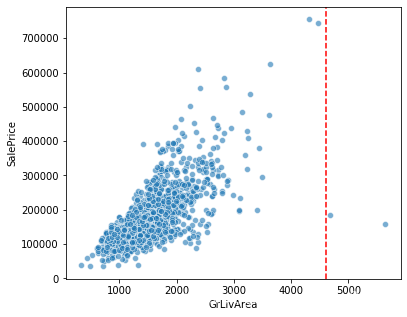
#顯然對於可居住面積越大,其售價肯定也越高,但圖中顯示有兩個離散點不遵循此規則,檢視其具體的數值
train.GrLivArea.sort_values(ascending=False)[:4]
1298    5642
523     4676
1182    4476
691     4316
Name: GrLivArea, dtype: int64
#地皮建築面積與房屋售價關係
fig = plt.figure(figsize=(6,5))
plt.axvline(x=200000, color='r', linestyle='--')
sns.scatterplot(x='LotArea',y='SalePrice',data=train, alpha=0.6)
*強#地皮建築面積與房屋售價關係
fig = plt.figure(figsize=(6,5))
plt.axvline(x=200000, color='r', linestyle='--')
sns.scatterplot(x='LotArea',y='SalePrice',data=train, alpha=0.6)
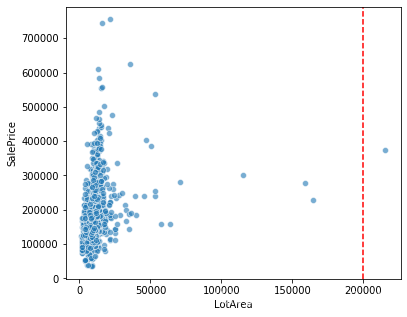
(通過資料集中能看出,對於地皮建築面積越大,其售價卻不一定更高,二者不成正比,因此異常值不用刪除)
#地下室總面積與房屋售價關係
fig = plt.figure(figsize=(6,5))
plt.axvline(x=5900, color='r', linestyle='--')
sns.scatterplot(x='TotalBsmtSF',y='SalePrice',data=train, alpha=0.6)
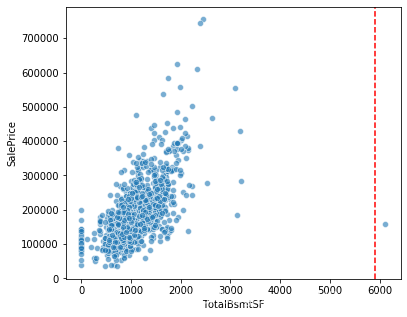
#同上,檢視其具體的數值
train.TotalBsmtSF.sort_values(ascending=False)[:3]
1298    6110
332     3206
496     3200
Name: TotalBsmtSF, dtype: int64
#第一層面積與房屋售價關係
fig = plt.figure(figsize=(6,5))
plt.axvline(x=4000, color='r', linestyle='--')
sns.scatterplot(x='1stFlrSF',y='SalePrice',data=train, alpha=0.6)
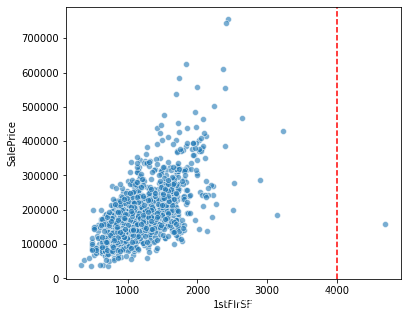
#同上,檢視其具體的數值
train['1stFlrSF'].sort_values(ascending=False)[:3]
1298    4692
496     3228
523     3138
Name: 1stFlrSF, dtype: int64
你會發現原來這幾個特徵的離群點都是Index=1298的這個樣本.
#裝飾石材面積與房屋售價關係
fig = plt.figure(figsize=(6,5))
plt.axvline(x=1500, color='r', linestyle='--')
sns.scatterplot(x='MasVnrArea',y='SalePrice',data=train, alpha=0.6)
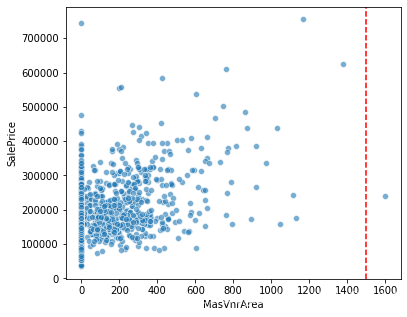
通過資料集中能看出,對於裝飾石材面積越大,其售價卻不一定更高,還需要看石材的型別,因此異常值不用刪除。還有其餘特徵變數可以用來探索,具體方式是先看箱型圖,再細看可能會存在離群值的一些特徵做散點圖,最最重要的就是不要過分地刪除異常值,一定要基於人為經驗或者可觀事實判斷。比如,住房面積大房價卻很低,人的年齡超過200歲,月份數為-1等等。
綜上,需要將部分異常值刪除。
#剔除異常值並將資料集重新排序
train = train[train.GrLivArea < 4600]
train = train[train.TotalBsmtSF < 5000]
train = train[train['1stFlrSF'] < 4000]
train.reset_index(drop=True, inplace=True)
train.shape
(1458, 80)
標籤值對數變換
先對咱們的標籤(房價)做一下偏度圖,一般用直方圖和Q-Q圖來看。
不懂Q-Q圖的小夥伴可以移步這裡~
#對'SalePrice'繪製直方圖和Q-Q圖
from scipy import stats
plt.figure(figsize=(10,5))
ax_121 = plt.subplot(1,2,1)
sns.distplot(train["SalePrice"],fit=stats.norm)
ax_122 = plt.subplot(1,2,2)
res = stats.probplot(train["SalePrice"],plot=plt)
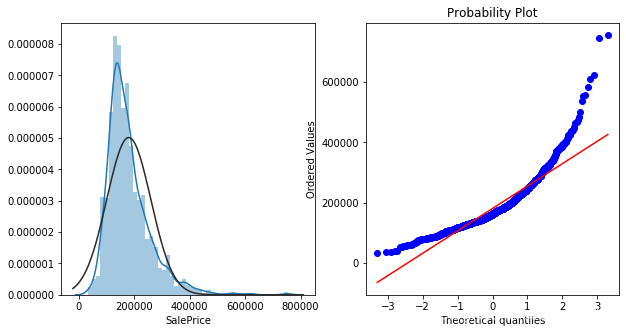
可見,咱們的房價分佈並不完全符合正態,而是一種向左的偏態分佈。
由於該競賽最終的評估指標是取房價對數的RMSE值,因此有必要先將房價轉化為對數形式,方便後續用於模型的評估。(這裡可以用numpy.log()或者numpy.log1p()將數值轉化為對數。注意,log()是指e為底數,而log1p代表了ln(1+x))
#使用log1p也就是log(1+x),用來對房價資料進行資料預處理,它的好處是轉化後的資料更加服從正態分佈,有利於後續的評估結果。
#但需要注意最後需要將預測出的平滑資料還原,而還原過程就是log1p的逆運算expm1
train["SalePrice"] = np.log1p(train["SalePrice"])
plt.figure(figsize=(10,5))
ax_121 = plt.subplot(1,2,1)
sns.distplot(train["SalePrice"],fit=stats.norm)
ax_122 = plt.subplot(1,2,2)
res = stats.probplot(train["SalePrice"],plot=plt)
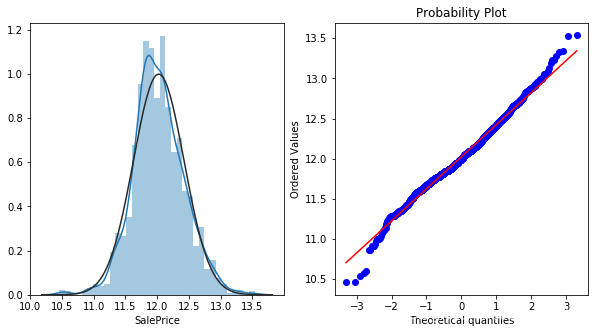
現在,通過對數變換的偏態標籤是不是更符合正態分佈了呢~
接下來需要合併訓練和測試資料,做一些統一的預處理變化,如果分開做會顯得比較麻煩。
#分離標籤和特徵,合併訓練集和測試集便於統一預處理
y = train['SalePrice'].reset_index(drop=True)
train_features = train.drop(['SalePrice'], axis=1)
test_features = testfeatures = pd.concat([train_features, test_features],axis=0).reset_index(drop=True)
print("剔除訓練資料中的極端值後,將其特徵矩陣和測試資料中的特徵矩陣合併,維度為:",features.shape)
剔除訓練資料中的極端值後,將其特徵矩陣和測試資料中的特徵矩陣合併,維度為: (2917, 79)
明確變數型別
通過閱讀官方提供的說明檔案(這一點很重要)能夠加深對資料特徵的理解,以便更好的進行特徵處理。在這裡,我們會發現有一些特徵本身是數值型的資料,但是卻沒有連續值,而是一些單一分佈的值,因此需要檢驗它們是不是原本就是類別型的資料,只不過用數值來表達了。
#尋找數值變數中實際應該為類別變數的特徵(即並不連續分佈)
transform_cols = []
for col in numerical_cols:
    if len(features[col].unique()) < 20:
        transform_cols.append(col)

transform_cols
['MSSubClass',
 'OverallQual',
 'OverallCond',
 'BsmtFullBath',
 'BsmtHalfBath',
 'FullBath',
 'HalfBath',
 'BedroomAbvGr',
 'KitchenAbvGr',
 'TotRmsAbvGrd',
 'Fireplaces',
 'GarageCars',
 'PoolArea',
 'MoSold',
 'YrSold']
通過對比檔案描述 (data_distribution) 中的特徵含義:
- MSSubClass – 確定銷售涉及的住宅型別(擁有16個不同型別,且互相無優劣關係,實質為onehot類別型變數)
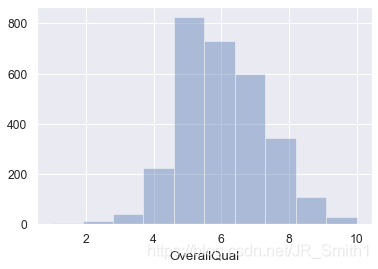
- OverallQual – 評估房子的整體材料和裝修(擁有10個型別,且數值越低表示越差,實質為labelcoder類別型變數)
- OverallCond – 評估房子的整體狀況(擁有10個型別,且數值越低表示越差,實質為labelcoder類別型變數)
- BsmtFullBath – 地下室全浴室個數(型別數未知,實質為數值型變數)
- BsmtHalfBath – 地下室半浴室個數(型別數未知,實質為數值型變數)
- FullBath – 地面上的全浴室個數(型別數未知,實質為數值型變數)
- HalfBath – 地面上的半浴室個數(型別數未知,實質為數值型變數)
- BedroomAbvGr – 地面上臥室個數(型別數未知,實質為數值型變數)
- KitchenAbvGr – 地面上廚房個數(型別數未知,實質為數值型變數)
- TotRmsAbvGrd – 地面上房間個數(型別數未知,實質為數值型變數)
- Fireplaces – 壁爐數量(型別數未知,實質為數值型變數)
- GarageCars – 車庫容量(型別數未知,實質為數值型變數)
- PoolArea – 游泳池面積,平方英尺(型別數未知,實質為數值型變數)
- MoSold – 房屋的售出月份(擁有12個月,且互相無優劣關係,實質為onehot類別型變數)
- YrSold – 房屋的售出年份(擁有5個月,且互相無優劣關係,實質為onehot類別型變數)
故此,數值型變數中存在列名為’MSSubClass’、‘YrSold’、'MoSold’的特徵列,實際為one-hot類別型變數需要更正為string形式。 (不懂one-hot和label_encoder區別的夥伴點這裡)
#對於列名為'MSSubClass'、'YrSold'、'MoSold'的特徵列,將列中的資料型別轉化為string格式。
features['MSSubClass'] = features['MSSubClass'].apply(str)
features['YrSold'] = features['YrSold'].astype(str)
features['MoSold'] = features['MoSold'].astype(str)

#將其加入對應的組別
numerical_cols.remove('MSSubClass')
numerical_cols.remove('YrSold')
numerical_cols.remove('MoSold')
categorical_cols.append('MSSubClass')
categorical_cols.append('YrSold')
categorical_cols.append('MoSold')
缺失值處理
由dataframe.info()能看出對於訓練和測試資料都有不同程度的缺失情況,而缺失值的存在會導致模型無法運作,因此需要題前將這部分資料處理好。
#資料總缺失情況查閱
(features.isna().sum()/features.shape[0]).sort_values(ascending=False)[:35]
PoolQC          0.996915
MiscFeature     0.964004
Alley           0.932122
Fence           0.804251
FireplaceQu     0.486802
LotFrontage     0.166610
GarageCond      0.054508
GarageQual      0.054508
GarageYrBlt     0.054508
GarageFinish    0.054508
GarageType      0.053822
BsmtCond        0.028111
......
GarageArea      0.000343
GarageCars      0.000343
OverallQual     0.000000
dtype: float64
注意,由特徵檔案說明中資訊可知許多NA項並非缺失,而是表示「沒有」此功能的含義, 如PoolQC游泳池品質的缺失NA,實際含義表示沒有游泳池,故需要仔細對照說明資訊進行處理。
以下根據缺失值實際情況進行填充:
#PoolQC, NA表示沒有游泳池,為一個型別
print(features["PoolQC"].unique())
print(features["PoolQC"].fillna("None").unique())   #空值填充為str型資料"None",表示沒有泳池。
[nan 'Ex' 'Fa' 'Gd']
['None' 'Ex' 'Fa' 'Gd']
#MiscFeature, NA表示-其他類別中「沒有」未涵蓋的其他特性,故填充為"None"
print(features["MiscFeature"].unique())
print(features["MiscFeature"].fillna("None").unique())
[nan 'Shed' 'Gar2' 'Othr' 'TenC']
['None' 'Shed' 'Gar2' 'Othr' 'TenC']
#由於類別型變數的許多NA均表示沒有此功能,先從data_distribution中找出這樣的列然後統一填充為"None"
(features[categorical_cols].isna().sum()/features.shape[0]).sort_values(ascending=False)[:25]
PoolQC          0.996915
MiscFeature     0.964004
Alley           0.932122
Fence           0.804251
FireplaceQu     0.486802
GarageCond      0.054508
.....
SaleType        0.000343
KitchenQual     0.000343
LotShape        0.000000
LandContour     0.000000
dtype: float64
for col in ('PoolQC', 'MiscFeature','Alley', 'Fence', 'FireplaceQu', 'MasVnrType', 'Utilities',
            'GarageCond', 'GarageQual', 'GarageFinish', 'GarageType',
            'BsmtQual', 'BsmtCond', 'BsmtExposure', 'BsmtFinType1', 'BsmtFinType2'):
    features[col] = features[col].fillna('None')

(features[categorical_cols].isna().sum()/features.shape[0]).sort_values(ascending=False)[:10]
MSZoning       0.001371
Functional     0.000686
SaleType       0.000343
Exterior2nd    0.000343
Exterior1st    0.000343
Electrical     0.000343
KitchenQual    0.000343
BldgType       0.000000
ExterQual      0.000000
MasVnrType     0.000000
dtype: float64
#其餘類別型變數由所在列的眾數填充
for col in ('Functional', 'SaleType', 'Electrical', 'Exterior2nd', 'Exterior1st', 'KitchenQual'):
    features[col] = features[col].fillna(features[col].mode()[0])

(features[categorical_cols].isna().sum()/features.shape[0]).sort_values(ascending=False)[:3]
MSZoning      0.001371
BldgType      0.000000
Foundation    0.000000
dtype: float64
#由於MSSubClass(確定銷售涉及的住宅型別)和 MSZoning(銷售分割區的一般分類確定)之間有一定聯絡。
#具體來說是指在MSSubClass基礎上確定MSZoning,故可以按照'MSSubClass'列中的元素分佈進行分組,然後將'MSZoning'列分組後取眾數填充。
features['MSZoning'] = features.groupby('MSSubClass')['MSZoning'].transform(lambda x: x.fillna(x.mode()[0]))
print('類別型資料缺失值數量為:', features[categorical_cols].isna().sum().sum())
類別型資料缺失值數量為: 0
最後的df.groupby()工具用法詳見: Groupby的用法及原理詳解
到這裡,類別型資料缺失填充已經完成啦~
接下來就是數值型的特徵:
#數值型變數缺失情況
(features[numerical_cols].isna().sum()/features.shape[0]).sort_values(ascending=False)[:12]
LotFrontage     0.166610
GarageYrBlt     0.054508
MasVnrArea      0.007885
BsmtFullBath    0.000686
BsmtHalfBath    0.000686
GarageArea      0.000343
GarageCars      0.000343
BsmtFinSF1      0.000343
BsmtFinSF2      0.000343
BsmtUnfSF       0.000343
TotalBsmtSF     0.000343
OpenPorchSF     0.000000
dtype: float64
#因為某些類別型變數為"None",表示不包含此項,所以造成數值型變數也會缺失,故將這樣的數值變數缺失值填充為"0"
for col in ('GarageYrBlt', 'GarageArea', 'GarageCars', 'MasVnrArea',
            'BsmtHalfBath', 'BsmtFullBath', 'BsmtFinSF1', 'BsmtFinSF2', 'BsmtUnfSF', 'TotalBsmtSF'):
    features[col] = features[col].fillna(0)

(features[numerical_cols].isna().sum()/features.shape[0]).sort_values(ascending=False)[:3]
LotFrontage     0.16661
BsmtFullBath    0.00000
LotArea         0.00000
dtype: float64
#對於 LotFrontage (連線到地產的街道的直線英尺距離)而言,其受Neighborhood(城市限制內的物理位置)的影響
#故對於這兩個特徵進行分組後取列的中位數填充
features['LotFrontage'] = features.groupby('Neighborhood')['LotFrontage'].transform(lambda x: x.fillna(x.median()))
print('數值型資料缺失值數量為:',features[numerical_cols].isna().sum().sum())
數值型資料缺失值數量為: 0
至此,資料缺失值填充全部完成!!(先放一個小煙花,嘣~ 嘣 ~ 嘣~)
特徵工程
這一步是整個Baseline中最核心的部分,特徵工程的好壞將影響最終的模型效果。因此,業界都流傳著一句話:「資料和特徵決定了機器學習的上線,而模型和演演算法只是逼近這個上線而已」, 由此可見特徵工程在機器學習中的重要性。具體來說,特徵越好、靈活性越強,則構建的模型越簡單且效能出色。(更多關於特徵工程的知識請參考:機器學習實戰之特徵工程)
特徵建立:基於已有特徵進行組合
#GrLivArea: 地上居住總面積
#TotalBsmtSF: 地下室總面積
#將二者加和形成新的「總居住面積」特徵
features['TotalSF'] = features['GrLivArea'] + features['TotalBsmtSF']

#LotArea: 建築面積
#LotFrontage: 房子同街道之間的距離
#將二者乘積形成新的「區域面積」特徵
features['Area'] = features['LotArea'] * features['LotFrontage']

#OpenPorchSF :開放式門廊面積
#EnclosedPorch :封閉式門廊面積
#3SsnPorch :時令門廊面積
#ScreenPorch :屏風門廊面積
#將四者加和形成新的"門廊總面積"特徵
features['Total_porch_sf'] = (features['OpenPorchSF'] + features['EnclosedPorch'] +
                              features['3SsnPorch'] + features['ScreenPorch'])

#FullBath :地面上的全浴室數目
#HalfBath :地面以上半浴室數目
#BsmtFullBath :地下室全浴室數量
#BsmtHalfBath :地下室半浴室數量
#將半浴室權重設為0.5,全浴室為1,將四者加和形成新的"總浴室數目"特徵
features['Total_Bathrooms'] = (features['FullBath'] + (0.5 * features['HalfBath']) +
                               features['BsmtFullBath'] + (0.5 * features['BsmtHalfBath']))

#將新特徵加入到數值變數中
numerical_cols.append('TotalSF')
numerical_cols.append('Area')
numerical_cols.append('Total_porch_sf')
numerical_cols.append('Total_Bathrooms')
print('特徵建立後的資料維度 :', features.shape)
特徵建立後的資料維度 : (2917, 83)
小夥伴們可以根據自己對特徵的理解來自定義構建新的特徵,這裡就因人而異了,充分發揮你們的創造力吧,奧裡給~~
對影響房價關鍵因子進行分箱
許多與房價屬性高度相關的特徵可能需要分箱 binning 來表達更明確的含義,或者有效地去減少對於數值的擬合來增加其泛化性(在測試集上的準確度)。
分箱也是一門學問,我還是把知識連結給放上吧…
#檢視與標籤10個最相關的特徵屬性
train_ = features.iloc[:len(y),:]
train_ = pd.concat([train_,y],axis=1)
cols = train_ .corr().nlargest(10, 'SalePrice').index

plt.subplots(figsize=(8,8))
sns.set(font_scale=1.1)
sns.heatmap(train_ [cols].corr(),square=True, annot=True)
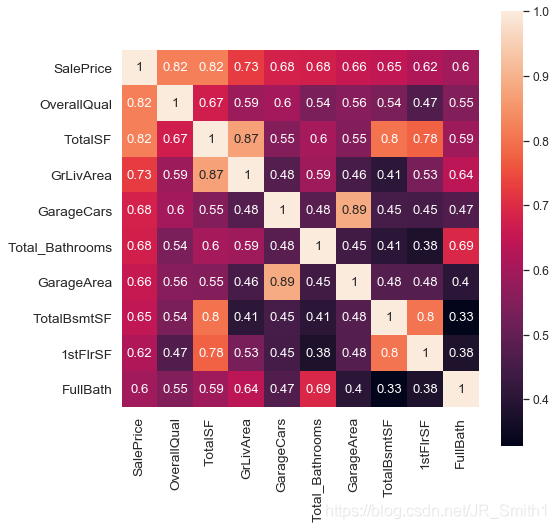
由熱圖可知,‘完工品質和材料’,‘總居住面積’,‘地面上居住面積’,'車庫容量數’,‘總浴室數目’,‘車庫面積’,‘總地下室面積’,'第一層面積’等都是與房價密切相關的特徵。
#完工品質和材料
sns.distplot(features['OverallQual'],bins=10,kde=False)
#完工品質和材料分組
def OverallQual_category(cat):
    if cat <= 4:
        return 1
    elif cat <= 6 and cat > 4:
        return 2
    else:
        return 3

features['OverallQual_cat'] = features['OverallQual'].apply(OverallQual_category)
#總居住面積
sns.distplot(features['TotalSF'],bins=10,kde=False)
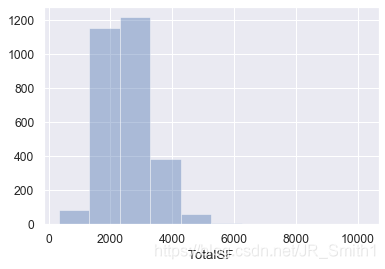
#總居住面積分組
def TotalSF_category(cat):
    if cat <= 2000:
        return 1
    elif cat <= 3000 and cat > 2000:
        return 2
    elif cat <= 4000 and cat > 3000:
        return 3
    else:
        return 4

features['TotalSF_cat'] = features['TotalSF'].apply(TotalSF_category)
博主後面還進行了車庫面積、地面上居住面積、地下室總面積、建築相關時間等特徵的分箱操作,原理都一樣,這裡不再貼程式碼。
#然後將建立的分組加入類別型變數中
categorical_cols.append('GarageArea_cat')
categorical_cols.append('GrLivArea_cat')
categorical_cols.append('TotalBsmtSF_cat')
categorical_cols.append('TotalSF_cat')
categorical_cols.append('OverallQual_cat')
categorical_cols.append('LotFrontage_cat')
categorical_cols.append('YearBuilt_cat')
categorical_cols.append('YearRemodAdd_cat')
categorical_cols.append('GarageYrBlt_cat')

#列印當前資料維度
features.shape
(2917, 92)
數值型變數偏度修正
針對一些線性迴歸模型,它們本身對資料分佈有一定要求,例如正態分佈等。所以需要在使用這些模型之前將所使用的特徵儘可能轉化為正態分佈狀態,就需要對資料的偏度和峰度進行了解和轉化。不瞭解資料偏度和峰度的小夥伴看這裡。
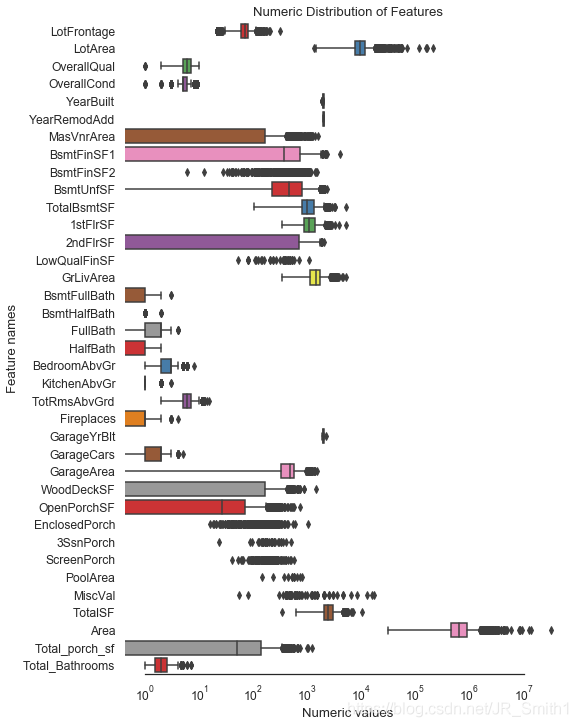
#檢視數值型特徵變數的偏度情況並繪圖
skew_features = features[numerical_cols].apply(lambda x: skew(x)).sort_values(ascending=False)

sns.set_style("white")
f, ax = plt.subplots(figsize=(8, 12))
ax.set_xscale("log")
ax = sns.boxplot(data=features[numerical_cols], orient="h", palette="Set1")
ax.xaxis.grid(False)
ax.set(ylabel="Feature names")
ax.set(xlabel="Numeric values")
ax.set(title="Numeric Distribution of Features")
sns.despine(trim=True, left=True)
#對特徵變數'GrLivArea',繪製直方圖和Q-Q圖,以清楚資料分佈結構
plt.figure(figsize=(8,4))
ax_121 = plt.subplot(1,2,1)
sns.distplot(features['GrLivArea'],fit=stats.norm)
ax_122 = plt.subplot(1,2,2)
res = stats.probplot(features['GrLivArea'],plot=plt)
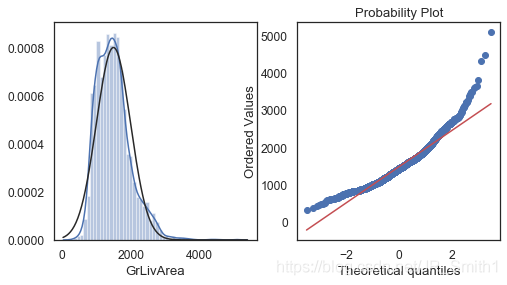
#以0.5作為閾值,統計偏度超過此數值的高偏度分佈資料列,獲取這些資料列的index
high_skew = skew_features[skew_features > 0.5]
skew_index = high_skew.index
print("There are {} numerical features with Skew > 0.5 :".format(high_skew.shape[0]))
high_skew.sort_values(ascending=False)
There are 28 numerical features with Skew > 0.5 :
MiscVal           21.939672
Area              18.642721
PoolArea          17.688664
LotArea           13.109495
LowQualFinSF      12.084539
3SsnPorch         11.372080
...
HalfBath           0.696666
TotalBsmtSF        0.671751
BsmtFullBath       0.622415
OverallCond        0.569314
dtype: float64
對高偏度資料進行處理,將其轉化為正態分佈時,一般使用Box-Cox變換。它可以使資料滿足線性性、獨立性、方差齊次以及正態性的同時,又不丟失資訊。

#使用boxcox_normmax用於找出最佳的λ值
for i in skew_index:
    features[i] = boxcox1p(features[i], boxcox_normmax(features[i] + 1))

features[numerical_cols].apply(lambda x: skew(x)).sort_values(ascending=False)
BsmtFinSF2          2.578329
EnclosedPorch       2.149132
Area                1.000000
MasVnrArea          0.977618
2ndFlrSF            0.895453
WoodDeckSF          0.785550
HalfBath            0.732625
OpenPorchSF         0.621231
BsmtFullBath        0.616643
Fireplaces          0.553135
.....
GarageArea          0.216857
OverallQual         0.189591
FullBath            0.165514
LotFrontage         0.059189
BsmtUnfSF           0.054195
TotRmsAbvGrd        0.047190
TotalSF             0.027351
GrLivArea           0.008823
dtype: float64
#box-cox變換後的對特徵變數'GrLivArea'
plt.figure(figsize=(8,4))
ax_121 = plt.subplot(1,2,1)
sns.distplot(features['GrLivArea'],fit=stats.norm)
ax_122 = plt.subplot(1,2,2)
res = stats.probplot(features['GrLivArea'],plot=plt)
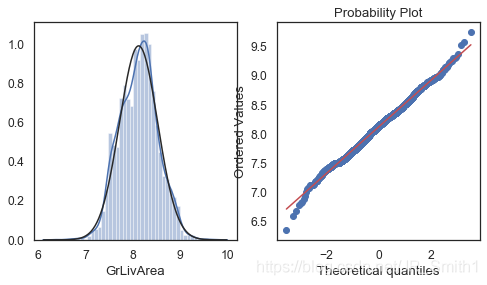
至此,數位型特徵列偏度校正全部完成!
(呼~好累,活動一下手臂繼續肝!!)
刪除單一值特徵
在某些類別型特徵中,某個種類佔據了99%以上的部分,也就是說特徵之間的具有明顯的單一值特點,這些特徵對模型也沒有什麼貢獻可言,需要刪除。
檢視類別型特徵的唯一值分佈情況
features[categorical_cols].describe(include='O').T
count	unique	top	freq
MSZoning	2917	5	RL	2265
Street	2917	2	Pave	2905
Alley	2917	3	None	2719
LotShape	2917	4	Reg	1859
LandContour	2917	4	Lvl	2622
Utilities	2917	3	AllPub	2914
LotConfig	2917	5	Inside	2132
......
SaleType	2917	9	WD	2526
SaleCondition	2917	6	Normal	2402
MSSubClass	2917	16	20	1079
YrSold	2917	5	2007	691
MoSold	2917	12	6	503
#對於類別型特徵變數中,單個型別佔比超過99%以上的特徵(即> 2888個)進行刪除.
freq_ = features[categorical_cols].describe(include='O').T.freq
drop_cols = []
for index,num in enumerate(freq_):
    if (freq_[index] > 2888) :
        drop_cols.append(freq_.index[index])

features = features.drop(drop_cols, axis=1)
print('These drop_cols are:', drop_cols)
print('The new shape is :', features.shape)

categorical_cols.remove('Street')
categorical_cols.remove('PoolQC')
categorical_cols.remove('Utilities')
These drop_cols are: ['Street', 'Utilities', 'PoolQC']
The new shape is : (2917, 89)
特徵簡化:0/1二值化處理
對於某些分佈單調的數位型資料列, 按照「有」和「沒有」來進行二值化處理,以擴充更多地特徵維度。
#通過對於特徵含義理解,篩選出了以下幾個變數進行二值化處理
features['HasPool'] = features['PoolArea'].apply(lambda x: 1 if x > 0 else 0)
features['HasWoodDeckSF'] = features['WoodDeckSF'].apply(lambda x: 1 if x > 0 else 0)
features['Hasfireplace'] = features['Fireplaces'].apply(lambda x: 1 if x > 0 else 0)
features['HasBsmt'] = features['TotalBsmtSF'].apply(lambda x: 1 if x > 0 else 0)
features['HasGarage'] = features['GarageArea'].apply(lambda x: 1 if x > 0 else 0)

#檢視當前特徵數
print("經過特徵處理後的特徵維度為 :",features.shape)
經過特徵處理後的特徵維度為 : (2917, 94)
至此,特徵構造處理完成全部完成!
特徵編碼
對於類別型資料,一般採用獨熱編碼onehot形式,對於彼此有數量關聯的特徵一般採用labelencoder編碼。
#使用pd.get_dummies()方法對特徵矩陣進行類似「座標投影」操作,獲得在新空間下onehot的特徵表達。
final_features = pd.get_dummies(features,columns=categorical_cols).reset_index(drop=True)
print("經過onehot編碼後的特徵維度為 :", final_features.shape)
經過onehot編碼後的特徵維度為 : (2917, 370)
#訓練集&測試集資料還原
X_train = final_features.iloc[:len(y), :]
X_sub = final_features.iloc[len(y):, :]
print("訓練集特徵維度為:", X_train.shape)
print("測試集特徵維度為:", X_sub.shape)
訓練集特徵維度為: (1458, 370)
測試集特徵維度為: (1459, 370)
異常值複查:基於迴歸模型
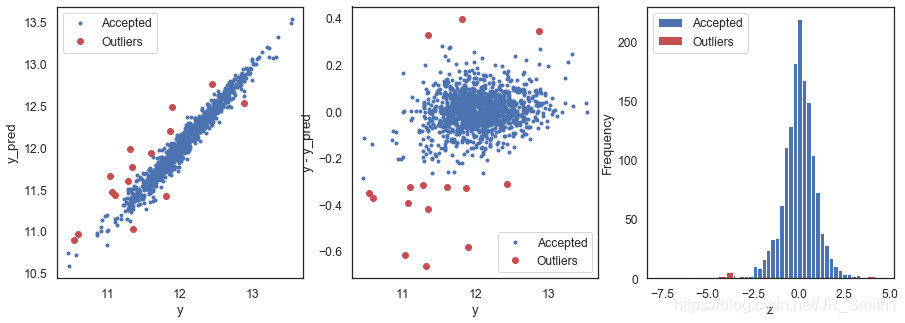
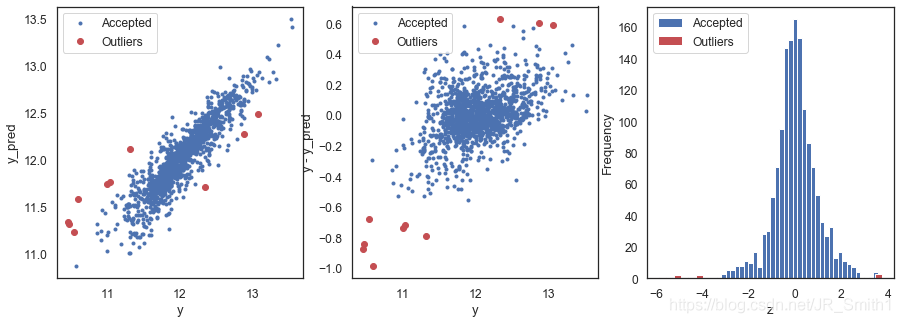
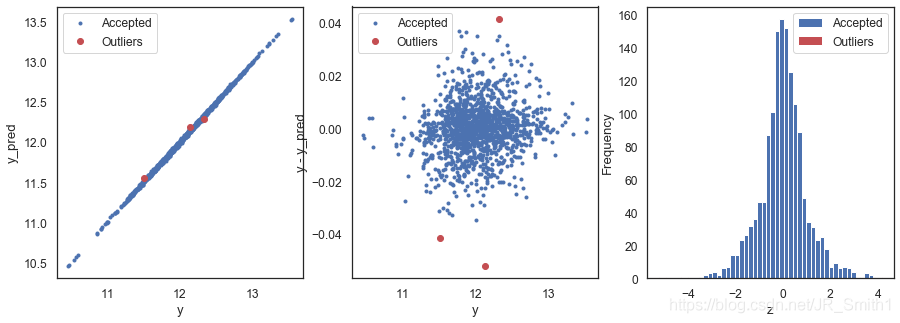
除了根據視覺化的異常值篩查以外,使用模型對資料進行擬合,然後設定一個殘差閾值(y_true - y_pred) 也能從另一個角度找出可能潛在的異常值。
#定義迴歸模型找出異常值並繪圖的函數
def find_outliers(model, X, y, sigma=4):
    try:
        y_pred = pd.Series(model.predict(X), index=y.index)
    except:
        model.fit(X,y)
        y_pred = pd.Series(model.predict(X), index=y.index)

    #計算模型預測y值與真實y值之間的殘差
    resid = y - y_pred
    mean_resid = resid.mean()
    std_resid = resid.std()

    #計算異常值定義的引數z引數,資料的|z|大於σ將會被視為異常
    z = (resid - mean_resid) / std_resid
    outliers = z[abs(z) > sigma].index

    #列印結果並繪製影象
    print('R2 = ',model.score(X,y))
    print('MSE = ',mean_squared_error(y, y_pred))
    print('RMSE = ',np.sqrt(mean_squared_error(y, y_pred)))
    print('------------------------------------------')

    print('mean of residuals',mean_resid)
    print('std of residuals',std_resid)
    print('------------------------------------------')

    print(f'find {len(outliers)}','outliers:')
    print(outliers.tolist())

    plt.figure(figsize=(15,5))
    ax_131 = plt.subplot(1,3,1)
    plt.plot(y,y_pred,'.')
    plt.plot(y.loc[outliers],y_pred.loc[outliers],'ro')
    plt.legend(['Accepted','Outliers'])
    plt.xlabel('y')
    plt.ylabel('y_pred');

    ax_132 = plt.subplot(1,3,2)
    plt.plot(y, y-y_pred, '.')
    plt.plot(y.loc[outliers],y.loc[outliers] - y_pred.loc[outliers],'ro')
    plt.legend(['Accepted','Outliers'])
    plt.xlabel('y')
    plt.ylabel('y - y_pred');

    ax_133 = plt.subplot(1,3,3)
    z.plot.hist(bins=50, ax=ax_133)
    z.loc[outliers].plot.hist(color='r', bins=30, ax=ax_133)
    plt.legend(['Accepted','Outliers'])
    plt.xlabel('z')

    return outliers
#使用LR迴歸模型
outliers_lr = find_outliers(LinearRegression(), X_train, y, sigma=3.5)
R2 =  0.9533461995514986
MSE =  0.007448781362371816
RMSE =  0.08630632284121376
------------------------------------------
mean of residuals -2.8022090059126034e-17
std of residuals 0.08633593557937841
------------------------------------------
find 15 outliers:
[30, 88, 431, 462, 580, 587, 631, 687, 727, 873, 967, 969, 1322, 1430, 1451]
#使用Elasnet模型
outliers_ent = find_outliers(ElasticNetCV(), X_train, y, sigma=3.5)
R2 =  0.8237243364637833
MSE =  0.028144306885302683
RMSE =  0.16776265044789523
------------------------------------------
mean of residuals -1.6593950721969417e-15
std of residuals 0.1678202118324841
------------------------------------------
find 10 outliers:
[30, 185, 410, 462, 495, 631, 687, 915, 967, 1243]
#使用XGB模型
outliers_xgb = find_outliers(XGBRegressor(), X_train, y, sigma=4)
R2 =  0.9993821316841015
MSE =  9.864932656333151e-05
RMSE =  0.00993223673516351
------------------------------------------
mean of residuals 6.241242620683598e-06
std of residuals 0.009935642643516977
------------------------------------------
find 3 outliers:
[883, 1055, 1279]
後面還用了LGB模型、GBDT模型和SVR模型來確定outliers,這裡省略繪圖了。
然後比較每個模型下的異常值序號,進行人工投票選擇,超過半數即為異常值,這樣最終確定了outliers,並在特徵集和標籤集中刪除。
outliers = [30, 462, 631, 967]
X_train = X_train.drop(X_train.index[outliers])
y = y.drop(y.index[outliers])
消除one-hot特徵矩陣的過擬合
當使用one-hot編碼後,一些列可能會帶來過擬合的風險。判斷某一列是否將產生過擬合的條件是:
特徵矩陣某一列中的某個值出現的次數除以特徵矩陣的列數超過99.95%,即其幾乎在被投影的各個維度上都有著同樣的取值,並不具有「主成分」的性質,則記為過擬合的列。
#記錄產生過擬合的資料列的序號
overfit = []
for i in X_train.columns:
    counts = X_train[i].value_counts(ascending=False)
    zeros = counts.iloc[0]
    if zeros / len(X_train) * 100 > 99.95:
        overfit.append(i)

overfit
['Area', 'MSSubClass_150']
#對訓練集和測試集同時刪除這些列
X_train = X_train.drop(overfit, axis=1).copy()
X_sub = X_sub.drop(overfit, axis=1).copy()
print('經過異常值和過擬合刪除後訓練集的特徵維度為:', X_train.shape)
print('經過異常值和過擬合刪除後測試集的特徵維度為:', X_sub.shape)
經過異常值和過擬合刪除後訓練集的特徵維度為: (1454, 368)
經過異常值和過擬合刪除後測試集的特徵維度為: (1459, 368)
至此,資料預處理和特徵工程部分全部完成!(喘一口粗氣)
那麼本期的Kaggle入門案例解析就到此啦,實在沒辦法一下全部寫完,分成兩期寫吧。資料處理和特徵工程已經可以結束了,下一期的話給大家帶來後面的模型搭建、調優和融合部分的程式碼解析和講解。感謝努力學習知識,並且沉穩帥氣/美麗動人的你~,咱們後續再見!