從頭構建神經網路
從頭構建神經網路
Building a neural network from sractch
僅用numpy實現神經網路,並用於實際的迴歸預測任務
目錄
I 資料集
資料集來源國家統計局
注:
1.鐵路運輸資料來源於中國國家鐵路集團有限公司、公路水路運輸資料來源於交通運輸部,民航運輸資料來源於中國民用航空局。
2.自2020年1月起,交通運輸部根據2019道路貨物運輸量專項調查調整月度公路貨物運輸量、公路貨物運輸週轉量統計口徑,同比增速按照調整後可比口徑計算。
3.自2020年1月起,水路運輸(海洋)統計方式改變,由行業主管部門報送調整為企業聯網直報,2020年以可比口徑計算增速。
4.從2015年1月起,鐵路客運統計口徑發生變化,由按售票數統計改為按乘車人數統計。
5.根據2013年開展的交通運輸業經濟統計專項調查,我部對公路水路運輸量的統計口徑和推算方案進行了調整。有關2014年月度公路水路客貨運輸量均按新方案推算並進行更新。
資料來源:國家統計局
資料集讀取
import numpy as np
import pandas as pd
from sklearn.utils import resample

data = pd.read_csv('國家統計局月度資料統計.csv',encoding='gbk')
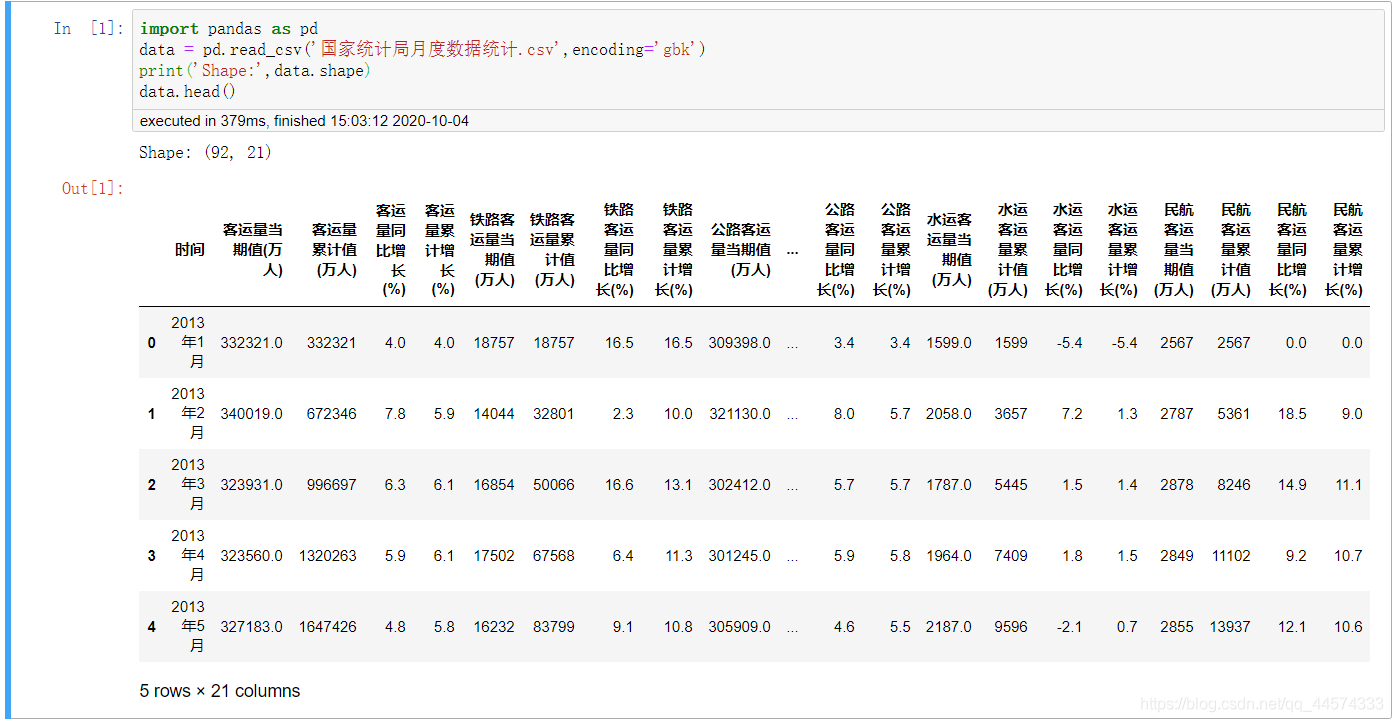
print('Shape:',data.shape)
data.head()

劃分X和Y,我們的目的就是希望訓練一個神經網路來通過上圖data各列資料去預測客運量當期值(萬人),迴歸預測,當然X中不包含客運量當期值(萬人)這一列。
# 空值填充
data.fillna(0,inplace=True)

X_names = data['時間']
Y_names = '客運量當期值(萬人)'
X_ = data[[i for i in data.columns if i not in ['時間','客運量當期值(萬人)']]]
Y_ = data['客運量當期值(萬人)'].values

X_ = (X_ - np.mean(X_ , axis=0)) / np.std(X_ , axis = 0)
print(X_.shape)
資料集部分不再闡述,讓我們主要關注神經網路的構建。
II 神經網路構建
2.1 構建基礎類別
首先讓我們明確神經網路中應該有的模組及功能:
- Forward:前向傳播 Funtion , how to calculate the inputs
- Backforward:反向傳播BP Funtion , how to get the gredients when backprogramming
- Gradient:梯度「下降」 Mapper ,the gradient map the this node of its inputs node
- Inputs:輸入 List, the input nodes of this node
- Outputs:輸出 List , the output node of this node
2.1.1 Node
簡單來說每個節點的作用是這樣的:
I
n
p
u
t
−
>
L
i
n
e
a
r
−
>
A
c
t
i
v
a
t
i
o
n
Input -> Linear -> Activation
Input−>Linear−>Activation
通俗理解就是
(
x
−
>
k
∗
x
+
b
−
>
s
i
g
m
o
i
d
)
(x -> k * x + b ->sigmoid)
(x−>k∗x+b−>sigmoid)
因為在神經網路中又包含函數、字典、列表這些共同特性,讓我們用物件導向的方式來組織這個框架
構建基礎類別程式碼實現如下
class Node:
    """
    Each node in neural networks will have these attributes and methods
    """
    def __init__(self,inputs=[]):
        """
        if the node is operator of "ax + b" , the inputs will be x node , and the outputs
        of this is its successors , and the value is *ax + b*
        """
        self.inputs = inputs
        self.outputs = []
        self.value = None
        self.gradients = { }

        for node in self.inputs:
            node.outputs.append(self) # bulid a connection relationship

    def forward(self):
        """Forward propogation

        compute the output value based on input nodes and store the value
        into *self.value*

        """
        # 虛類
        # 如果一個物件是它的子類,就必須要重新實現這個方法
        raise NotImplemented

    def backward(self):
        """Backward propogation

        compute the gradient of each input node and store the value
        into *self.gradients*

        """
        # 虛類
        # 如果一個物件是它的子類,就必須要重新實現這個方法
        raise NotImplemented
2.1.2 Input
神經網路的輸入節點定義如下,對於每個輸入節點,都有兩個屬性:
- forward:前向傳播計算值
- backward:反向傳播,更新引數
class Input(Node):
    def __init__(self, name=''):
        Node.__init__(self, inputs=[])
        self.name = name

    def forward(self, value=None):
        if value is not None:
            self.value = value

    def backward(self):
        self.gradients = {}

        for n in self.outputs:
            grad_cost = n.gradients[self]
            self.gradients[self] = grad_cost

    def __repr__(self):
        return 'Input Node: {}'.format(self.name)
2.1.3 Linear
神經網路中的線性層如下
對於線性層,我們定義了 「wx+b」的前向計算,和反向傳播時需要的對w、x、b引數的梯度值
class Linear(Node):
    def __init__(self, nodes, weights, bias):
        self.w_node = weights
        self.x_node = nodes
        self.b_node = bias
        Node.__init__(self, inputs=[nodes, weights, bias])

    def forward(self):
        """compute the wx + b using numpy"""
        self.value = np.dot(self.x_node.value, self.w_node.value) + self.b_node.value


    def backward(self):

        for node in self.outputs:
            #gradient_of_loss_of_this_output_node = node.gradient[self]
            grad_cost = node.gradients[self]

            self.gradients[self.w_node] = np.dot(self.x_node.value.T, grad_cost) # loss對w的偏導 = loss對self的偏導 * self對w的偏導
            self.gradients[self.b_node] = np.sum(grad_cost * 1, axis=0, keepdims=False)
            self.gradients[self.x_node] = np.dot(grad_cost, self.w_node.value.T)
2.1.4 Sigmoid
神經網路中的啟用函數如下,數學定義式,不再闡述
class Sigmoid(Node):
    def __init__(self, node):
        Node.__init__(self, [node])
        self.x_node = node

    def _sigmoid(self, x):
        return 1. / (1 + np.exp(-1 * x))

    def forward(self):
        self.value = self._sigmoid(self.x_node.value)

    def backward(self):
        y = self.value

        self.partial = y * (1 - y)

        for n in self.outputs:
            grad_cost = n.gradients[self]
            self.gradients[self.x_node] = grad_cost * self.partial
2.1.5 MSE
神經網路中的損失函數MSE定義,數學定義式,不再闡述
class MSE(Node):
    def __init__(self, y_true, y_hat):
        self.y_true_node = y_true
        self.y_hat_node = y_hat
        Node.__init__(self, inputs=[y_true, y_hat])

    def forward(self):
        y_true_flatten = self.y_true_node.value.reshape(-1, 1)
        y_hat_flatten = self.y_hat_node.value.reshape(-1, 1)

        self.diff = y_true_flatten - y_hat_flatten

        self.value = np.mean(self.diff**2)

    def backward(self):
        n = self.y_hat_node.value.shape[0]

        self.gradients[self.y_true_node] = (2 / n) * self.diff
        self.gradients[self.y_hat_node] =  (-2 / n) * self.diff
2.2 構建圖
有關拓撲圖的定義如下,在此你只需知道拓撲排序將神經網路中的各個節點進行有序排序,設定其有效的入度和出度。
def topological_sort(data_with_value):
    feed_dict = data_with_value
    input_nodes = [n for n in feed_dict.keys()]

    G = {}
    nodes = [n for n in input_nodes]
    while len(nodes) > 0:
        n = nodes.pop(0)
        if n not in G:
            G[n] = {'in': set(), 'out': set()}
        for m in n.outputs:
            if m not in G:
                G[m] = {'in': set(), 'out': set()}
            G[n]['out'].add(m)
            G[m]['in'].add(n)
            nodes.append(m)

    L = []
    S = set(input_nodes)
    while len(S) > 0:
        n = S.pop()

        if isinstance(n, Input):
            n.value = feed_dict[n]
            ## if n is Input Node, set n'value as
            ## feed_dict[n]
            ## else, n's value is caculate as its
            ## inbounds

        L.append(n)
        for m in n.outputs:
            G[n]['out'].remove(m)
            G[m]['in'].remove(n)
            # if no other incoming edges add to S
            if len(G[m]['in']) == 0:
                S.add(m)
    return L

def training_one_batch(topological_sorted_graph):
    # graph 是經過拓撲排序之後的 一個list
    for node in topological_sorted_graph:
        node.forward()

    for node in topological_sorted_graph[::-1]:
        node.backward()

def sgd_update(trainable_nodes, learning_rate=1e-2):
    for t in trainable_nodes:
        t.value += -1 * learning_rate * t.gradients[t]

def run(dictionary):
    return topological_sort(dictionary)
接下來,讓我們定義神經網路每層的權重、輸入輸出,我們只設定了兩個線性層
n_features = X_.shape[1]
n_hidden = 10
n_hidden_2 = 10

W1_ = np.random.randn(n_features , n_hidden)
b1_ = np.zeros(n_hidden)
W2_ = np.random.randn(n_hidden,1)
b2_ = np.zeros(1)

X, Y = Input(name='X'), Input(name='y')  # tensorflow -> placeholder
W1, b1 = Input(name='W1'), Input(name='b1')
W2, b2 = Input(name='W2'), Input(name='b2')
接下來,讓我們定義神經網路的層
linear_output = Linear(X, W1, b1)
sigmoid_output = Sigmoid(linear_output)
Yhat = Linear(sigmoid_output, W2, b2)
loss = MSE(Y, Yhat)
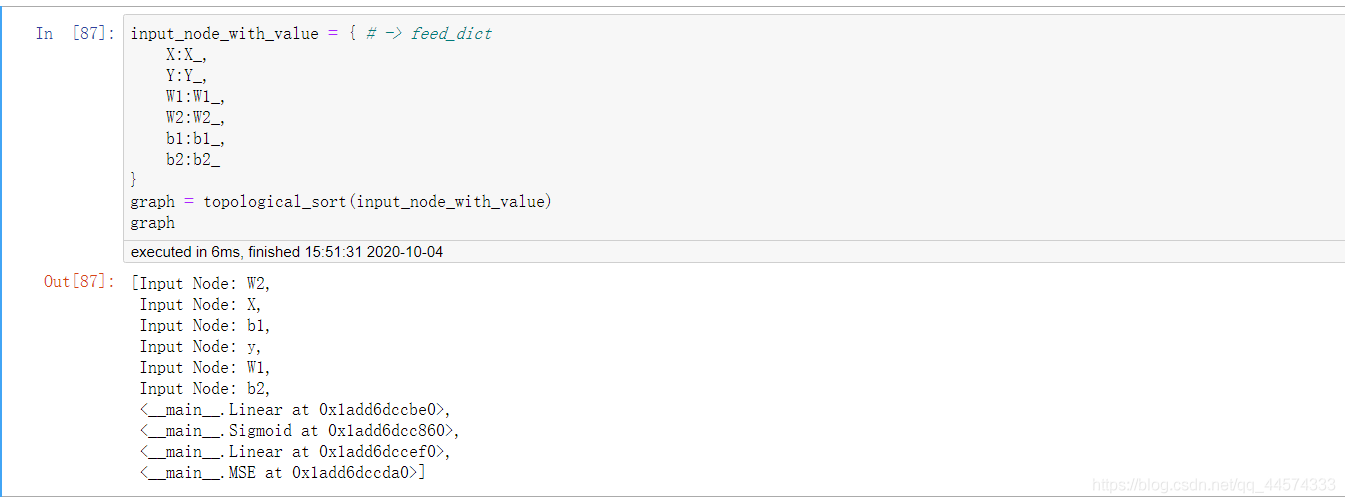
讓我們看一下我們輸入輸出經過拓撲排序後得到的神經網路圖
input_node_with_value = { # -> feed_dict
    X:X_,
    Y:Y_,
    W1:W1_,
    W2:W2_,
    b1:b1_,
    b2:b2_
}
graph = topological_sort(input_node_with_value)
graph

III 訓練
losses = []
epochs = 50000

batch_size = 64
steps_per_epoch = X_.shape[0] // batch_size
learning_rate = 0.1

for i in range(epochs):
    loss = 0

    for batch in range(steps_per_epoch):

        X_batch, Y_batch = resample(X_, Y_, n_samples=batch_size)

        X.value = X_batch
        Y.value = Y_batch


        training_one_batch(graph)
        sgd_update(trainable_nodes=[W1, W2, b1, b2], learning_rate=learning_rate)

        loss += graph[-1].value

    if i % 100 == 0:
        print('Epoch: {}, loss = {:.3f}'.format(i+1, loss/steps_per_epoch))
        losses.append(loss)
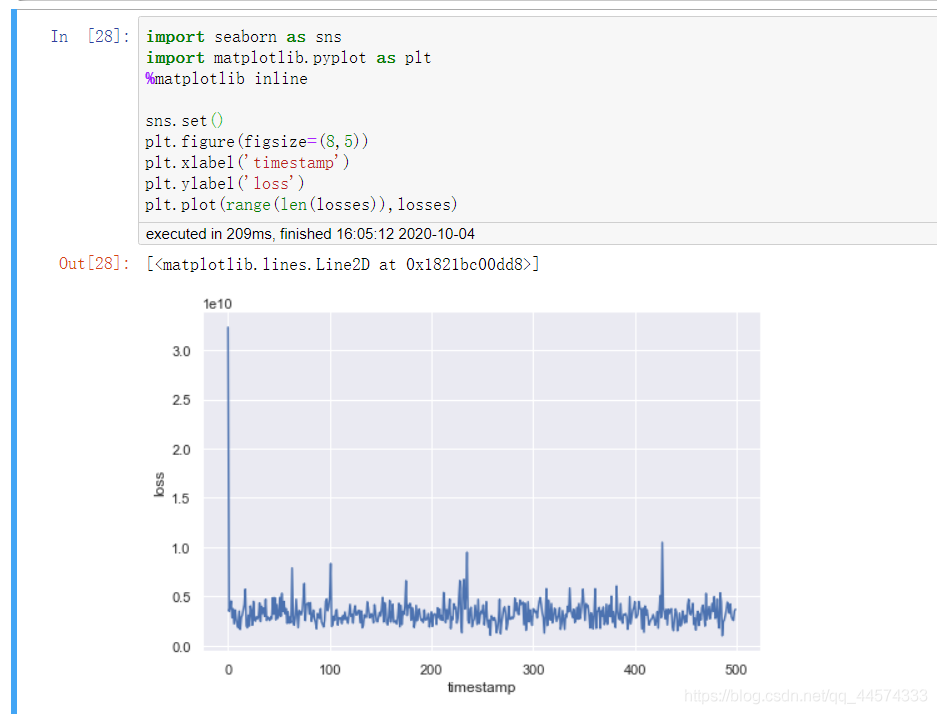
讓我們看一下實現效果
import seaborn as sns
import matplotlib.pyplot as plt
%matplotlib inline

sns.set()
plt.figure(figsize=(8,5))
plt.xlabel('timestamp')
plt.ylabel('loss')
plt.plot(range(len(losses)),losses)

僅用兩個線性層即可實現如此的迴歸效果也還是可以的了,各位可以嘗試通過增加線性層和啟用函數來優化迴歸效果。
完整資料和程式碼檔案請見Github: