Pandas看這一篇就夠了!
2020-10-04 07:00:11
文章目錄
1.Series
1.1 Pandas系列可以使用以下建構函式建立
– pandas.Series( data, index, dtype)
– data:資料採取各種形式,如:ndarray,list,constants
– index:必須是唯一的和雜湊的,與資料的長度相同。 預設np.arange(n)如果沒有索引被傳遞。
– dtype用於資料型別。如果沒有,將推斷資料型別
import pandas as pd
import numpy as np
data = np.array(['a', 'b', 'c', 'd'])
s = pd.Series(data)
print(s)
s = pd.Series(data, index=[100, 101, 102, 103])
print(s)
0    a
1    b
2    c
3    d
dtype: object
100    a
101    b
102    c
103    d
dtype: object
2.從字典(dict)資料建立Pandas系列,字典作為輸入傳遞,如果沒有指定索
引,則按排序順序取得字典鍵以構造索引。 如果傳遞了索引,索引中
與標籤對應的資料中的值將被拉出。
import pandas as pd
import numpy as np
data = {'a': 0., 'b': 1., 'c': 2.}
s = pd.Series(data)
print(s)
s = pd.Series(data, ['b', 'c', 'd', 'a'])
print(s)
a    0.0
b    1.0
c    2.0
dtype: float64
b    1.0
c    2.0
d    NaN
a    0.0
dtype: float64
3.從標量資料建立Pandas系列,資料是標量值,則必須提供索引。將重複
該值以匹配索引的長度
import pandas as pd
import numpy as np
s = pd.Series(5, index=[0, 1, 3])
print(s)
0    5
1    5
3    5
dtype: int64
import pandas as pd
import numpy as np
s = pd.Series([1, 2, 3, 4, 5], index=['a', 'b', 'c', 'd', 'e'])
# retrieve the first element
print(s[0])
# retrieve the first three element
print(s[:3])
# retrieve the last three element
print(s[-3:])
# retrieve a single element
print(s['a'])
# retrieve multiple elements
print(s[['a', 'c', 'd']])
1
a    1
b    2
c    3
dtype: int64
c    3
d    4
e    5
dtype: int64
1
a    1
c    3
d    4
dtype: int64
2.DataFrame
資料框(DataFrame)是二維資料結構,即資料以行和列的表格方式排列。
• 功能:
– 潛在的列是不同的型別
– 大小可變
– 標記軸(行和列) – 可以對行和列執行算術運算
Pandas中的DataFrame可以使用以下建構函式建立
– pandas.DataFrame( data, index, columns, dtype) – 引數如下:
• data資料採取各種形式,如:ndarray,series,map,lists,dict,constant和另一個DataFrame。
• index對於行標籤,要用於結果幀的索引是可選預設值np.arrange(n),如果沒有傳遞索引值。
• columns對於列標籤,可選的預設語法是 - np.arange(n)。 這隻有在沒有索引傳遞的情況下才是這樣。
• dtype每列的資料型別。
import pandas as pd
import numpy as np
df = pd.DataFrame()#empty DataFrame
print(df)
data = [1, 2, 3, 4, 5]
df = pd.DataFrame(data) #from list
print(df)
data = [['Alex', 10], ['Bob', 12], ['Clarke', 13]]
df = pd.DataFrame(data, columns=['Name', 'Age']) # from list
print(df)
data = {'Name': ['Tom', 'Jack', 'Steve'], 'Age': [28, 34, 29]} #from dict 列
df = pd.DataFrame(data)
print(df)
data = [{'a': 1, 'b': 2}, {'a': 5, 'b': 10, 'c': 20}] #from dict 行
df = pd.DataFrame(data)
print(df)
d = {'one': pd.Series([1, 2, 3], index=['a', 'b', 'c']),
'two': pd.Series([1, 2, 3, 4], index=['a', 'b', 'c', 'd'])}
df = pd.DataFrame(d) # from Series
print(df)
Empty DataFrame
Columns: []
Index: []
   0
0  1
1  2
2  3
3  4
4  5
     Name  Age
0    Alex   10
1     Bob   12
2  Clarke   13
   Age   Name
0   28    Tom
1   34   Jack
2   29  Steve
   a   b     c
0  1   2   NaN
1  5  10  20.0
   one  two
a  1.0    1
b  2.0    2
c  3.0    3
d  NaN    4
2.1 列的選擇、新增、刪除
import pandas as pd
import numpy as np
d = {'one': pd.Series([1, 2, 3], index=['a', 'b', 'c']),
'two': pd.Series([1, 2, 3, 4], index=['a', 'b', 'c', 'd'])}
df = pd.DataFrame(d)
print(df['one'])
df['three'] = pd.Series([10, 20, 30], index=['a', 'b', 'c'])
print(df)
df['four'] = df['one'] + df['three']
print(df)
del df['one']
print(df)
a    1.0
b    2.0
c    3.0
d    NaN
Name: one, dtype: float64
   one  two  three
a  1.0    1   10.0
b  2.0    2   20.0
c  3.0    3   30.0
d  NaN    4    NaN
   one  two  three  four
a  1.0    1   10.0  11.0
b  2.0    2   20.0  22.0
c  3.0    3   30.0  33.0
d  NaN    4    NaN   NaN
   two  three  four
a    1   10.0  11.0
b    2   20.0  22.0
c    3   30.0  33.0
d    4    NaN   NaN
import pandas as pd
d = {'one': pd.Series([1, 2, 3], index=['a', 'b', 'c']),
'two': pd.Series([1, 2, 3, 4], index=['a', 'b', 'c', 'd'])}
df = pd.DataFrame(d)
print(df)
print(df.loc['b'])
print(df.iloc[0])
print(df[2:4])
df = df.append(pd.DataFrame([[5, 6], [7, 8]], columns=['one',
'two']))
print(df)
df = df.drop(0)
print(df)
   one  two
a  1.0    1
b  2.0    2
c  3.0    3
d  NaN    4
one    2.0
two    2.0
Name: b, dtype: float64
one    1.0
two    1.0
Name: a, dtype: float64
   one  two
c  3.0    3
d  NaN    4
   one  two
a  1.0    1
b  2.0    2
c  3.0    3
d  NaN    4
0  5.0    6
1  7.0    8
   one  two
a  1.0    1
b  2.0    2
c  3.0    3
d  NaN    4
1  7.0    8
行的交換:
df = pd.DataFrame(np.arange(25).reshape(5, -1))
print(df)
a, b = df.iloc[1].copy(), df.iloc[2].copy()
df.iloc[1], df.iloc[2] = b, a
print(df)
    0   1   2   3   4
0   0   1   2   3   4
1   5   6   7   8   9
2  10  11  12  13  14
3  15  16  17  18  19
4  20  21  22  23  24
    0   1   2   3   4
0   0   1   2   3   4
1  10  11  12  13  14
2   5   6   7   8   9
3  15  16  17  18  19
4  20  21  22  23  24
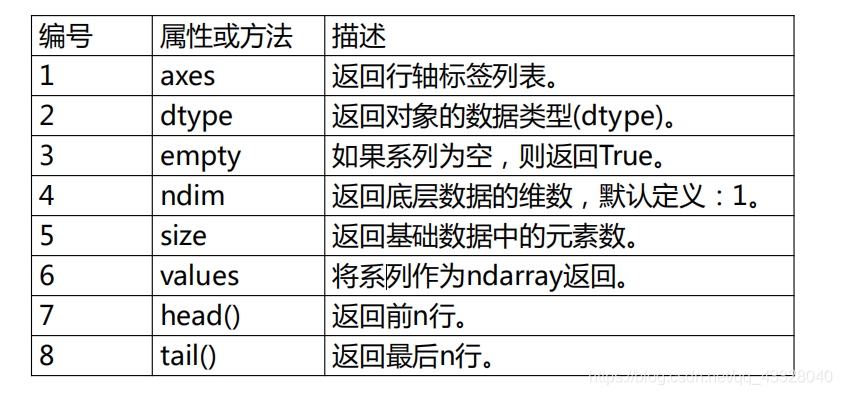
3. Series的基本操作

import pandas as pd
import numpy as np
data = pd.Series(np.random.randint(0,4,5))
print(data)
print(data.axes)
print(data.empty)
print(data.ndim)
print(data.size)
print(data.values)
print(data.head(3))
print(data.tail(2))
0    2
1    0
2    0
3    0
4    1
dtype: int32
[RangeIndex(start=0, stop=5, step=1)]
False
1
df=pd.DataFrame({ 'a':range(10),
                  'b':np.random.rand(10),
                  'c':[1,2,3,4]*2 + [1, 2],
                  'd':['apple', 'banana','carrot'] * 3 + ['apple'] } )
df.rename(columns={'d':'fruit'})
| a | b | c | fruit | |
|---|---|---|---|---|
| 0 | 0 | 0.670179 | 1 | apple |
| 1 | 1 | 0.115708 | 2 | banana |
| 2 | 2 | 0.832918 | 3 | carrot |
| 3 | 3 | 0.466246 | 4 | apple |
| 4 | 4 | 0.114392 | 1 | banana |
| 5 | 5 | 0.928451 | 2 | carrot |
| 6 | 6 | 0.256953 | 3 | apple |
| 7 | 7 | 0.595865 | 4 | banana |
| 8 | 8 | 0.781242 | 1 | carrot |
| 9 | 9 | 0.155173 | 2 | apple |
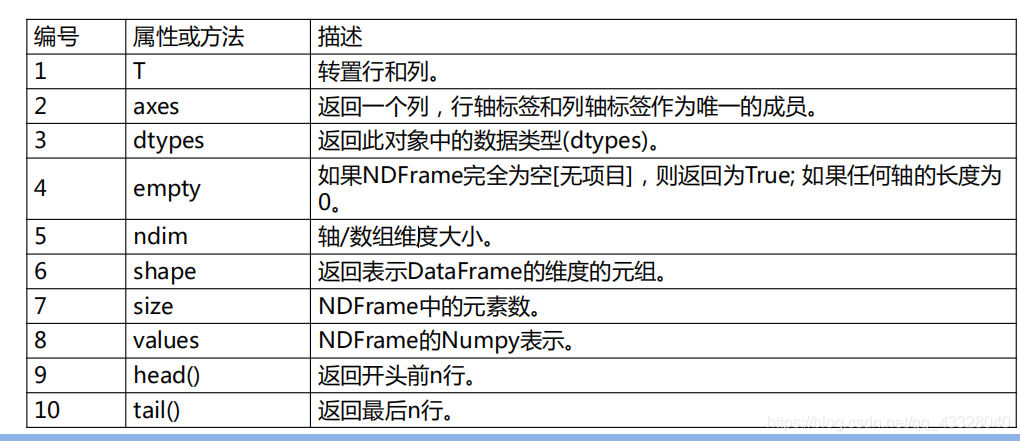
4.DataFrame基本操作

import pandas as pd
# Create a Dictionary of series
d = {'Name': pd.Series(['Tom', 'James', 'Ricky', 'Vin', 'Steve', 'Minsu', 'Jack']),
'Age': pd.Series([25, 26, 25, 23, 30, 29, 23]),
'Rating': pd.Series([4.23, 3.24, 3.98, 2.56, 3.20, 4.6, 3.8])}
# Create a DataFrame
data = pd.DataFrame(d)
print(data)
print(data.T)
print(data.axes)
print(data.dtypes)
print(data.empty)
print(data.ndim)
print(data.shape)
print(data.size)
print(data.values)
print(data.head(3))
print(data.tail(2))
   Age   Name  Rating
0   25    Tom    4.23
1   26  James    3.24
2   25  Ricky    3.98
3   23    Vin    2.56
4   30  Steve    3.20
5   29  Minsu    4.60
6   23   Jack    3.80
           0      1      2     3      4      5     6
Age       25     26     25    23     30     29    23
Name     Tom  James  Ricky   Vin  Steve  Minsu  Jack
Rating  4.23   3.24   3.98  2.56    3.2    4.6   3.8
[RangeIndex(start=0, stop=7, step=1), Index(['Age', 'Name', 'Rating'], dtype='object')]
Age         int64
Name       object
Rating    float64
dtype: object
False
2
(7, 3)
21
[[25 'Tom' 4.23]
 [26 'James' 3.24]
 [25 'Ricky' 3.98]
 [23 'Vin' 2.56]
 [30 'Steve' 3.2]
 [29 'Minsu' 4.6]
 [23 'Jack' 3.8]]
   Age   Name  Rating
0   25    Tom    4.23
1   26  James    3.24
2   25  Ricky    3.98
   Age   Name  Rating
5   29  Minsu     4.6
6   23   Jack     3.8
用0填充dataframe的對角線上的數,iat和iloc用法一樣
df = pd.DataFrame(np.random.randint(1,100, 100).reshape(10, -1))
for i in range(df.shape[0]):
    df.iat[i, i] = 0
    df.iat[df.shape[0]-i-1, i] = 0
print(df)
    0   1   2   3   4   5   6   7   8   9
0   0  42  46  24  34  57  31   1   4   0
1  33   0  73  31  25  49   4  89   0  64
2  55  37   0  91  56  18  28   0  11  48
3  69  28  28   0  34  42   0  16  56  43
4  45  66  28  99   0   0  87  30  14  11
5  61  79  87  32   0   0  27  82  85  59
6  61  20  16   0  66  81   0  41  18  52
7  38  30   0  22  72   2  58   0  71  83
8  59   0  35  54  30  59  18  22   0  88
9   0  52  29  10  78  66  78  37  83   0
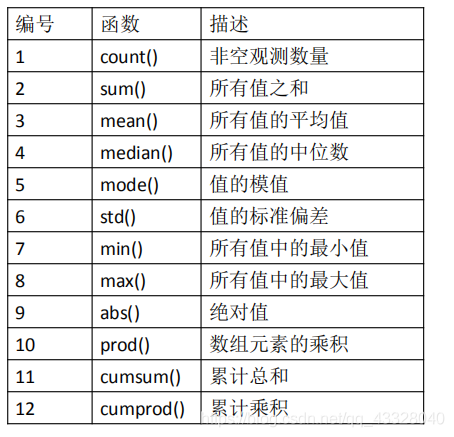
Pandas常用的描述性統計資訊的函數:

import pandas as pd
# Create a Dictionary of series
d = {'Name': pd.Series(['Tom', 'James', 'Ricky', 'Vin', 'Steve', 'Minsu', 'Jack',
'Lee', 'David', 'Gasper', 'Betina', 'Andres']),
'Age': pd.Series([25, 26, 25, 23, 30, 29, 23, 34, 40, 30, 51, 46]),
'Rating': pd.Series([4.23, 3.24, 3.98, 2.56, 3.20, 4.6, 3.8, 3.78, 2.98,
4.80, 4.10, 3.65])}
# Create a DataFrame
data = pd.DataFrame(d)
print(data)
print(data.sum())
print(data.mean())
print(data.std())
    Age    Name  Rating
0    25     Tom    4.23
1    26   James    3.24
2    25   Ricky    3.98
3    23     Vin    2.56
4    30   Steve    3.20
5    29   Minsu    4.60
6    23    Jack    3.80
7    34     Lee    3.78
8    40   David    2.98
9    30  Gasper    4.80
10   51  Betina    4.10
11   46  Andres    3.65
Age                                                     382
Name      TomJamesRickyVinSteveMinsuJackLeeDavidGasperBe...
Rating                                                44.92
dtype: object
Age       31.833333
Rating     3.743333
dtype: float64
Age       9.232682
Rating    0.661628
dtype: float64
Pandas 描述性統計函數,注意事項:
– 由於DataFrame是異構資料結構。通用操作不適用於所有函數。
– 類似於:sum(),cumsum()函數能與數位和字元(或)字串資料元素一起工作,不會產生任何錯誤。
– 由於這樣的操作無法執行,因此,當DataFrame包含字元或字串資料時,像abs(),cumprod()這樣的函數會丟擲異常。
要將自定義或其他庫的函數應用於Pandas物件,有三種方式:
– pipe():表格函數應用,通過將函數和適當數量的引數作為管道引數來執行自定義操作,對整個DataFrame執行操作。
– apply( ) :可以沿DataFrame的軸應用任意函數,它與描述性統計方法一樣,採用可選的axis引數。
– applymap() :給DataFrame的所有元素應用任何Python函數,並且返回單個值。
import pandas as pd
import numpy as np
df = pd.DataFrame(np.random.randn(5, 3), columns=['col1', 'col2', 'col3'])
print(df)
df = df.apply(np.mean)
print(df)
       col1      col2      col3
0  0.026660  0.551035  0.182109
1 -1.066038 -3.086139 -0.183103
2 -1.566943  1.022386  0.750337
3  0.813376 -0.697546  0.417025
4 -0.472393  1.457343 -0.922107
col1   -0.453067
col2   -0.150584
col3    0.048852
dtype: float64
dataframe獲取行之和大於100的資料, 並返回最後的兩行
df = pd.DataFrame(np.random.randint(10, 40, 60).reshape(-1, 4))
rowsums = df.apply(np.sum, axis=1)
last_two_rows = df.iloc[np.where(rowsums > 100)[0][-2:]]
last_two_rows
| 0 | 1 | 2 | 3 | |
|---|---|---|---|---|
| 9 | 35 | 35 | 23 | 29 |
| 12 | 24 | 33 | 29 | 27 |
Pandas物件之間的基本迭代的行為取決於型別。當迭代一個系列時,它 被視為陣列式,基本迭代產生這些值
import pandas as pd
import numpy as np
N = 5
df = pd.DataFrame({
'X': np.linspace(0, stop=N - 1, num=N),
'Y': np.random.rand(N),
'C': np.random.choice(['Low', 'Medium', 'High'], N)
.tolist(),
})
for key, value in df.iteritems(): # 按列存取值
    print(key, value)
print("=====================")
for row_index, row in df.iterrows(): # 按行存取值
    print(row_index, row)
print("=====================")
for row in df.itertuples(): # 按行存取值
    print(row)
C 0    Medium
1    Medium
2       Low
3    Medium
4      High
Name: C, dtype: object
X 0    0.0
1    1.0
2    2.0
3    3.0
4    4.0
Name: X, dtype: float64
Y 0    0.959929
1    0.058876
2    0.756262
3    0.984280
4    0.999868
Name: Y, dtype: float64
=====================
0 C      Medium
X           0
Y    0.959929
Name: 0, dtype: object
1 C       Medium
X            1
Y    0.0588758
Name: 1, dtype: object
2 C         Low
X           2
Y    0.756262
Name: 2, dtype: object
3 C     Medium
X          3
Y    0.98428
Name: 3, dtype: object
4 C        High
X           4
Y    0.999868
Name: 4, dtype: object
=====================
Pandas(Index=0, C='Medium', X=0.0, Y=0.9599285927026967)
Pandas(Index=1, C='Medium', X=1.0, Y=0.058875797837255606)
Pandas(Index=2, C='Low', X=2.0, Y=0.75626198656391275)
Pandas(Index=3, C='Medium', X=3.0, Y=0.98427963491833415)
Pandas(Index=4, C='High', X=4.0, Y=0.99986776764752849)
Pandas中有兩種排序方式:
– 按標籤排序:sort_index()方法通過傳遞axis引數和排序順序,可以對DataFrame進行排序。ascending=true為升序,false為降序。axis=0排序行,1為排序列。
– 按實際值:sort_values()是按值排序的方法。它接受一個by引數,指定排序列名
import pandas as pd
import numpy as np
unsorted_df = pd.DataFrame(np.random.randn(10, 2),
                           index=[1, 4, 6, 2, 3, 5, 9, 8, 0, 7],
                           columns=['col2', 'col1'])
print(unsorted_df)
sorted_df = unsorted_df.sort_index()
print(sorted_df) # 按索引排序
sorted_df = unsorted_df.sort_values(by='col1')
print(sorted_df) # 按col1排序
       col2      col1
1  1.440434  1.725768
4  0.009801  0.196239
6  0.923630  0.890150
2  0.185936  0.202835
3  0.690447 -0.141488
5  1.662561  1.752920
9 -0.157736  0.405503
8 -1.419687 -0.044129
0 -0.053966 -0.605254
7 -1.571451 -0.328177
       col2      col1
0 -0.053966 -0.605254
1  1.440434  1.725768
2  0.185936  0.202835
3  0.690447 -0.141488
4  0.009801  0.196239
5  1.662561  1.752920
6  0.923630  0.890150
7 -1.571451 -0.328177
8 -1.419687 -0.044129
9 -0.157736  0.405503
       col2      col1
0 -0.053966 -0.605254
7 -1.571451 -0.328177
3  0.690447 -0.141488
8 -1.419687 -0.044129
4  0.009801  0.196239
2  0.185936  0.202835
9 -0.157736  0.405503
6  0.923630  0.890150
1  1.440434  1.725768
5  1.662561  1.752920
5. Pandas函數應用
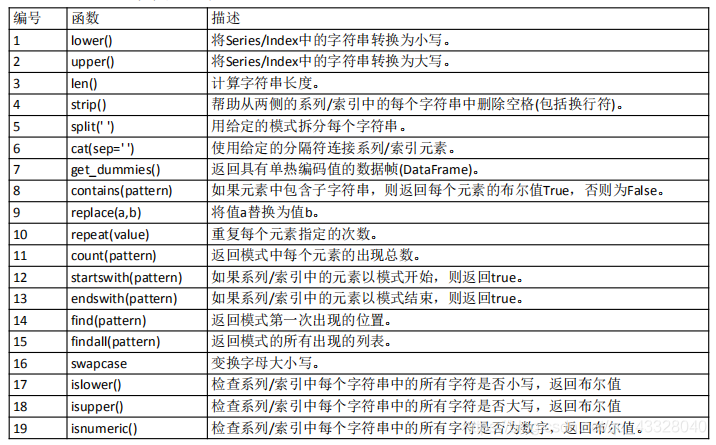
常用字串文字函數列表如下:

import pandas as pd
import numpy as np
s = pd.Series(['Tom', 'William Rick', 'John',
'Alber@t', np.nan, '1234', 'SteveMinsu'])
print(s.str.lower())
print(s.str.upper())
print(s.str.len())
print(s.str.find('e'))
print(s.str.count('m'))
0             tom
1    william rick
2            john
3         alber@t
4             NaN
5            1234
6      steveminsu
dtype: object
0             TOM
1    WILLIAM RICK
2            JOHN
3         ALBER@T
4             NaN
5            1234
6      STEVEMINSU
dtype: object
0     3.0
1    12.0
2     4.0
3     7.0
4     NaN
5     4.0
6    10.0
dtype: float64
0   -1.0
1   -1.0
2   -1.0
3    3.0
4    NaN
5   -1.0
6    2.0
dtype: float64
0    1.0
1    1.0
2    0.0
3    0.0
4    NaN
5    0.0
6    0.0
dtype: float64
6.Pandas多軸索引:
- DataFrame.loc() 方法通過標籤來完成DataFrame的索引。
- DataFrame.iloc() 方法通過基於始0的下標來完成DataFrame的索引
- DataFrame.ix() 方法通過混合標籤和下標的方式來完成DataFrame的索引。
import pandas as pd
import numpy as np
df = pd.DataFrame(np.random.randn(8, 4),
index=['a', 'b', 'c', 'd', 'e', 'f', 'g', 'h'],
columns=['A', 'B', 'C', 'D'])
# select all rows for a specific column
print(df.loc[:, 'A'])
print(df.loc[:, ['A', 'C']])
print(df.loc[['a', 'b', 'f', 'h'], ['A', 'C']])
print(df.loc['a':'h'])
print(df.loc['a'] > 0)
a   -1.096360
b   -0.509215
c   -0.496389
d   -0.790647
e    1.483483
f    1.534044
g   -1.354682
h    0.095619
Name: A, dtype: float64
          A         C
a -1.096360 -0.206507
b -0.509215  1.151713
c -0.496389 -1.135079
d -0.790647  1.067650
e  1.483483  0.251884
f  1.534044  0.178737
g -1.354682 -0.362621
h  0.095619  1.342643
          A         C
a -1.096360 -0.206507
b -0.509215  1.151713
f  1.534044  0.178737
h  0.095619  1.342643
          A         B         C         D
a -1.096360 -1.119847 -0.206507 -0.627628
b -0.509215  0.786663  1.151713 -0.266289
c -0.496389  0.658526 -1.135079 -0.258309
d -0.790647  0.960095  1.067650  0.070966
e  1.483483  0.090211  0.251884  1.090053
f  1.534044  0.370134  0.178737  0.835015
g -1.354682  0.910268 -0.362621 -1.334036
h  0.095619 -0.650006  1.342643 -0.782496
A    False
B    False
C    False
D    False
Name: a, dtype: bool
import pandas as pd
import numpy as np
df = pd.DataFrame(np.random.randn(8, 4),
index=['a', 'b', 'c', 'd', 'e', 'f', 'g', 'h'],
columns=['A', 'B', 'C', 'D'])
# select all rows for a specific column
print(df.iloc[:4])
print(df.iloc[1:5, 2:4])
print(df.iloc[[1, 3, 5], [1, 3]])
print(df.iloc[1:3, :])
print(df.iloc[:, 1:3])
          A         B         C         D
a -0.985919 -0.311362 -0.390002  0.964154
b  0.264029 -0.296392 -0.944643  0.307082
c -0.605262  1.729297 -0.090857 -0.751519
d -1.375307 -0.596479 -1.836798 -1.405262
          C         D
b -0.944643  0.307082
c -0.090857 -0.751519
d -1.836798 -1.405262
e -0.142980 -0.830023
          B         D
b -0.296392  0.307082
d -0.596479 -1.405262
f  0.389874 -0.462296
          A         B         C         D
b  0.264029 -0.296392 -0.944643  0.307082
c -0.605262  1.729297 -0.090857 -0.751519
          B         C
a -0.311362 -0.390002
b -0.296392 -0.944643
c  1.729297 -0.090857
d -0.596479 -1.836798
e  1.684399 -0.142980
f  0.389874 -0.753835
g  0.199919 -0.972075
h -1.118849 -0.672530
import pandas as pd
import numpy as np
df = pd.DataFrame(np.random.randn(8, 4),
index=['a', 'b', 'c', 'd', 'e', 'f', 'g', 'h'],
columns=['A', 'B', 'C', 'D'])
# select all rows for a specific column
print(df.ix[:4])
print(df.ix[:, 'A'])
          A         B         C         D
a -0.527016  0.031919  0.698404  1.386758
b -1.746599 -0.246425  0.133075  0.418947
c -0.327233 -1.566975 -0.437066 -0.731450
d -0.956644 -0.134168 -1.083254  0.053951
a   -0.527016
b   -1.746599
c   -0.327233
d   -0.956644
e    0.576412
f   -1.348915
g    0.256975
h   -1.351225
Name: A, dtype: float64
Pandas還支援通過屬性運運算元.來選擇列。
import pandas as pd
import numpy as np
df = pd.DataFrame(np.random.randn(8, 4),
index=['a', 'b', 'c', 'd', 'e', 'f', 'g', 'h'],
columns=['A', 'B', 'C', 'D'])
print(df.A)
a    0.785159
b    0.322105
c   -1.210970
d   -0.955962
e   -0.896882
f    2.222450
g    1.222612
h   -0.286081
Name: A, dtype: float64
7.Pandas統計函數
統計方法有助於理解和分析資料的行為。Pandas也提供了統計函數。
– 差分函數:pct_change( ) 函數將每個元素與其前一個元素進行比較,並計算變化 百分比。 – 協方差函數:協方差適用於系列資料。Series物件有cov( )方法用來計算序列物件之間的協方差。NA將被自動排除。
– 相關性函數: corr( )用於計算某兩列值的相關性。
– 資料排名函數:rank( ) 用於為元素陣列中的每個元素生成排名。
import pandas as pd
import numpy as np
df = pd.DataFrame(np.random.randn(3, 2), columns=['a', 'b'])
print(df.pct_change())
s1 = pd.Series(np.random.randn(10))
s2 = pd.Series(np.random.randn(10))
print(s1.cov(s2))
print(df['a'].cov(df['b'])) # a列和b列的協方差
print(df.cov()) # df協方差矩陣
print(df['a'].corr(df['b']))# a列和b列的相關性
print(df.corr()) #df的相關矩陣
s = pd.Series(np.random.np.random.randn(6), index=list('abcdee'))
print(s)
print(s.rank())
           a         b
0        NaN       NaN
1  -0.838600 -2.274759
2 -20.205354 -1.757039
-0.309369947243
0.186491516577
          a         b
a  1.986867  0.186492
b  0.186492  0.181958
0.310162676192
          a         b
a  1.000000  0.310163
b  0.310163  1.000000
a    1.315629
b    1.025438
c    0.066169
d    0.969194
e   -1.793737
e   -0.576699
dtype: float64
a    6.0
b    5.0
c    3.0
d    4.0
e    1.0
e    2.0
dtype: float64
8.Pandas分組
任何分組(groupby)操作都涉及原始物件的以下操作
– 根據指定條件分割物件集合:df.groupby(‘key’)
– 在每個分割後的集合上應用函數:聚合函數,轉換函數,過濾函數
– 整合結果並顯示
import pandas as pd
import numpy as np
ipl_data = {'Team': ['Riders', 'Riders', 'Devils', 'Devils', 'Kings',
'Kings', 'Kings', 'Kings', 'Riders', 'Royals','Royals', 'Riders'],
'Rank': [1, 2, 2, 3, 3, 4, 1, 1, 2, 4, 1, 2],
'Year': [2014, 2015, 2014, 2015,2014, 2015, 2016, 2017, 2016, 2014, 2015, 2017],
'Points': [876, 789, 863, 673, 741, 812, 756, 788, 694, 701, 804, 690]}
df = pd.DataFrame(ipl_data)
print(df)
grouped = df.groupby('Team')
print("===================")
for name, group in grouped:
    print(name, group)
print(grouped['Rank'].agg(np.mean))
    Points  Rank    Team  Year
0      876     1  Riders  2014
1      789     2  Riders  2015
2      863     2  Devils  2014
3      673     3  Devils  2015
4      741     3   Kings  2014
5      812     4   Kings  2015
6      756     1   Kings  2016
7      788     1   Kings  2017
8      694     2  Riders  2016
9      701     4  Royals  2014
10     804     1  Royals  2015
11     690     2  Riders  2017
===================
Devils    Points  Rank    Team  Year
2     863     2  Devils  2014
3     673     3  Devils  2015
Kings    Points  Rank   Team  Year
4     741     3  Kings  2014
5     812     4  Kings  2015
6     756     1  Kings  2016
7     788     1  Kings  2017
Riders     Points  Rank    Team  Year
0      876     1  Riders  2014
1      789     2  Riders  2015
8      694     2  Riders  2016
11     690     2  Riders  2017
Royals     Points  Rank    Team  Year
9      701     4  Royals  2014
10     804     1  Royals  2015
Team
Devils    2.50
Kings     2.25
Riders    1.75
Royals    2.50
Name: Rank, dtype: float64